Sıradaki adımlar
Matplotlib ile Veri Görselleştirmeye Giriş

Ariel Rokem
Data Scientist
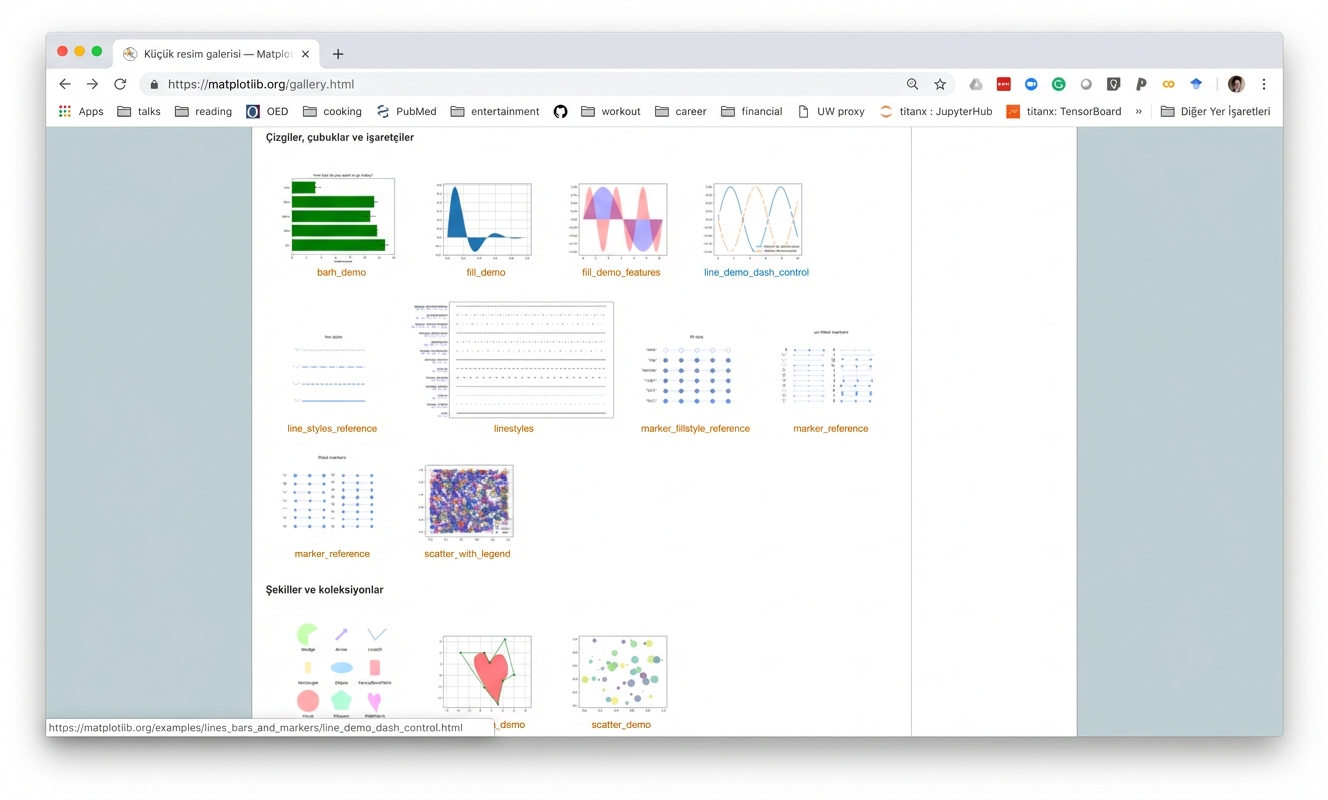
Örnek galerisi
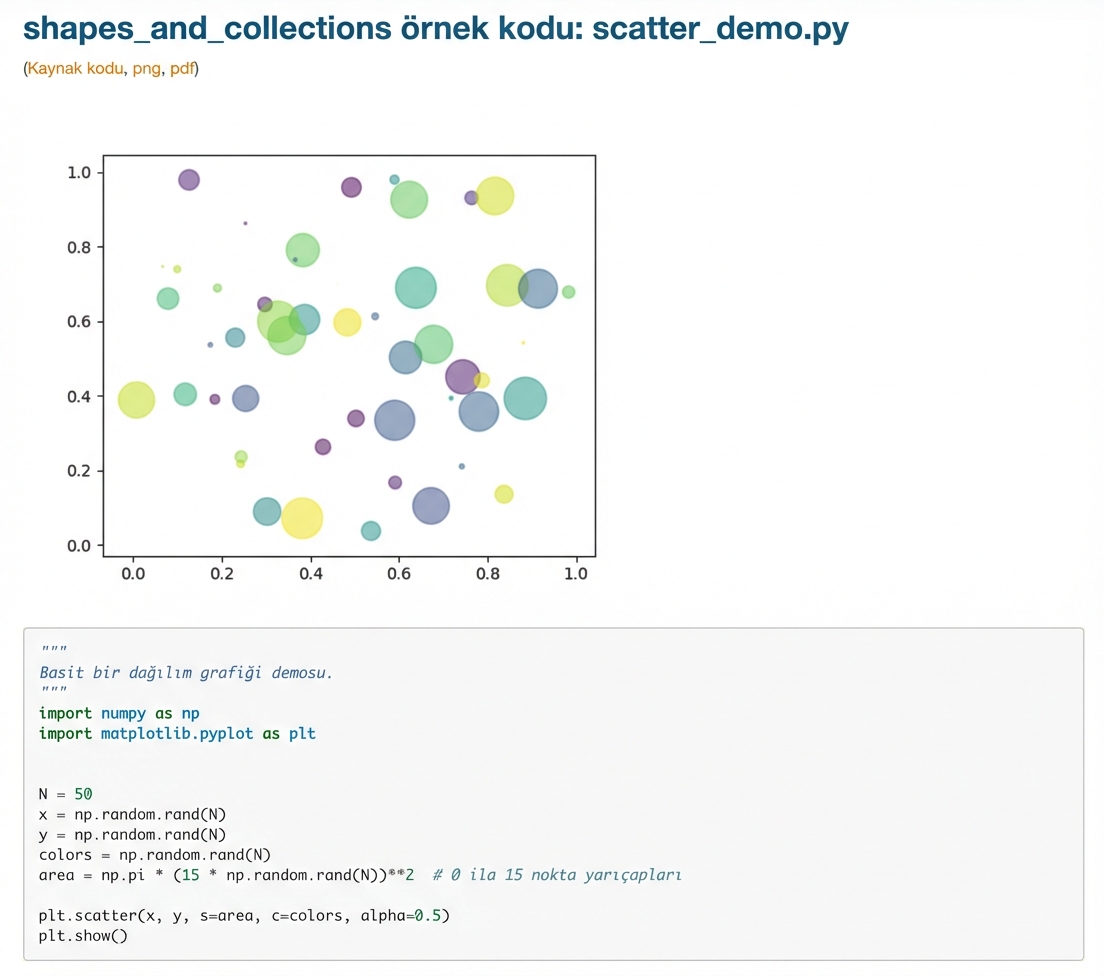
Kodlu örnek sayfası
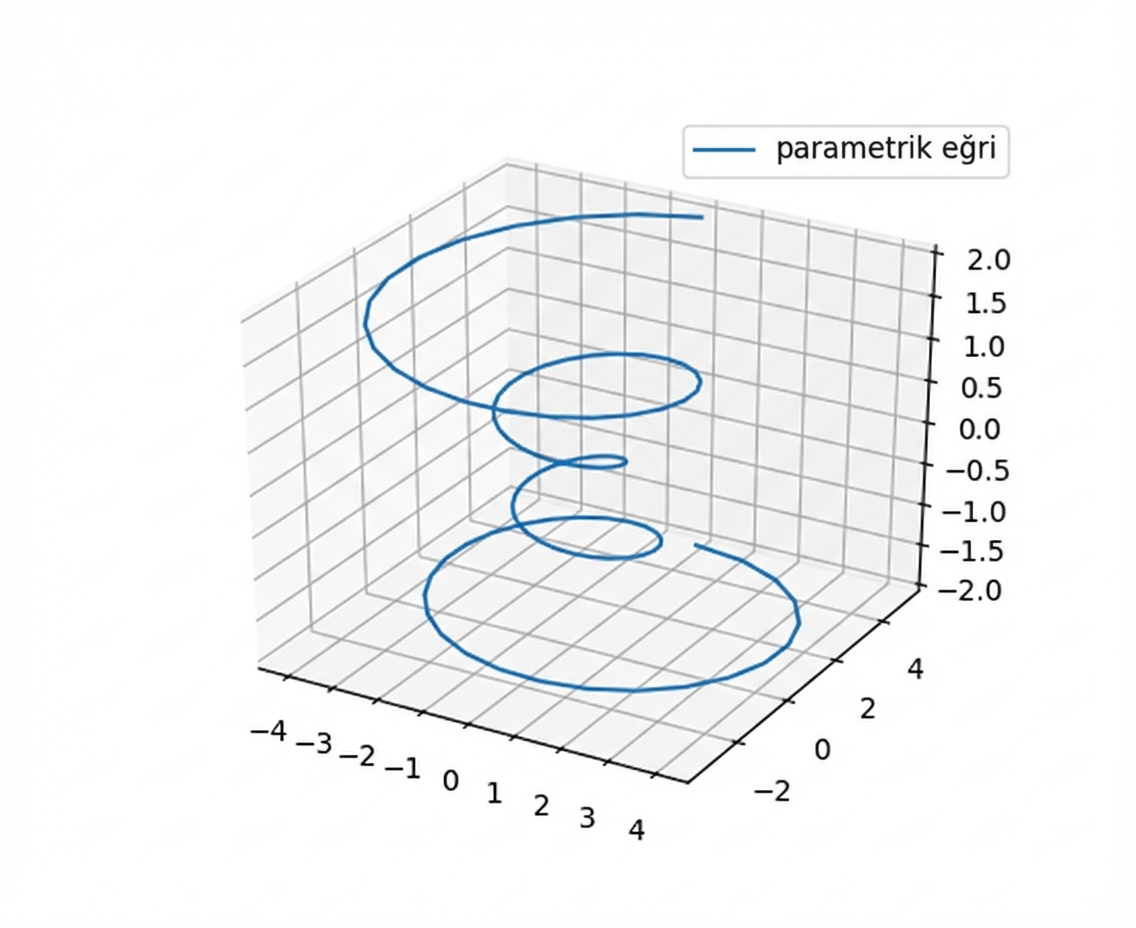
3B veri görselleştirme
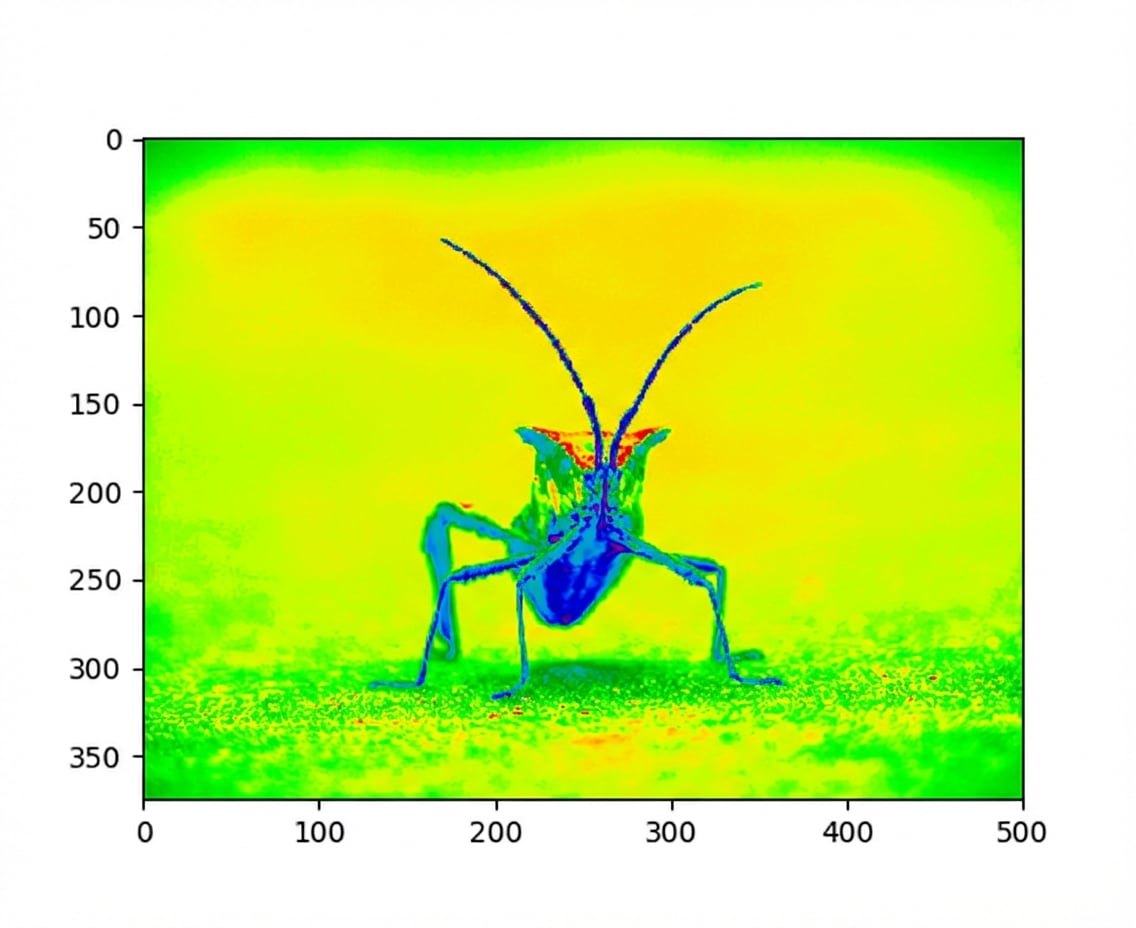
Sahte renklerle görüntü görselleştirme
Animasyonlar
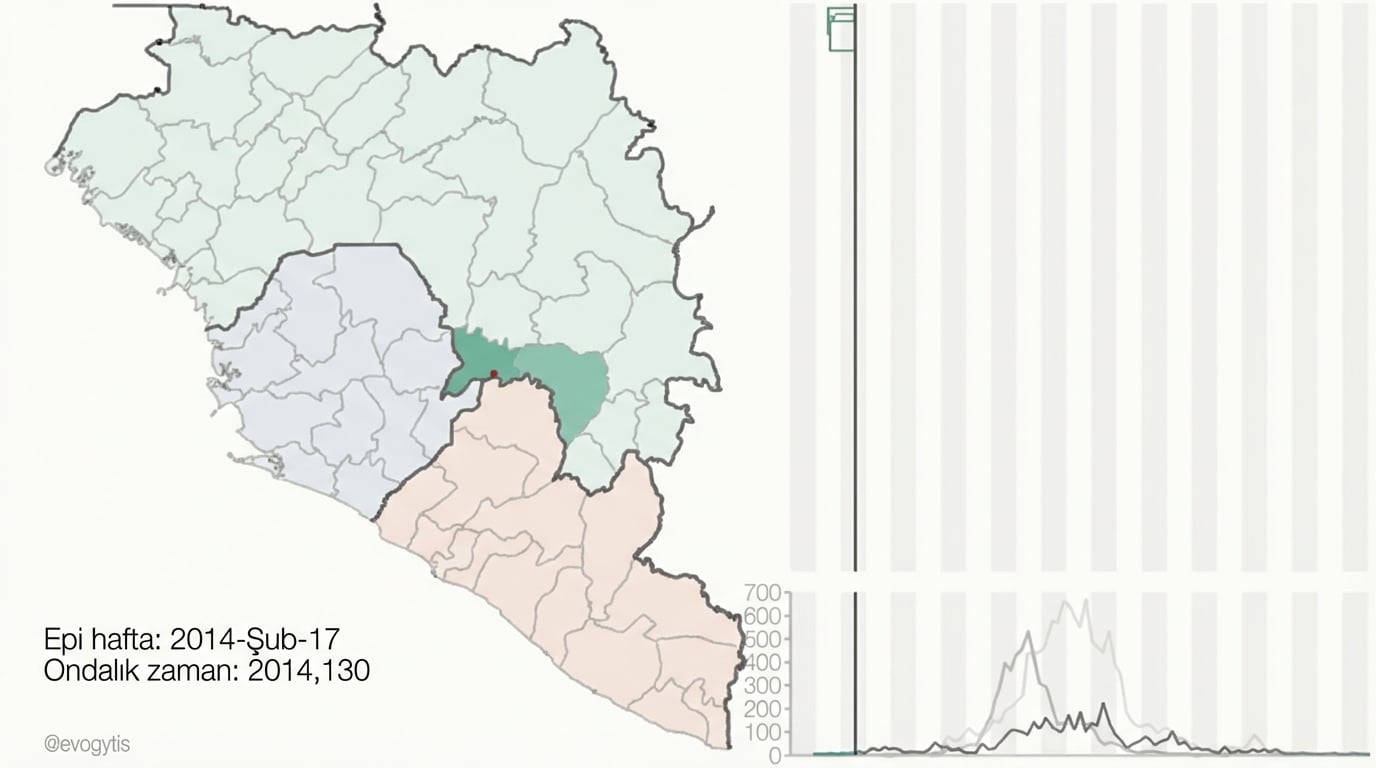
Coğrafi veriler için Matplotlib kullanımı

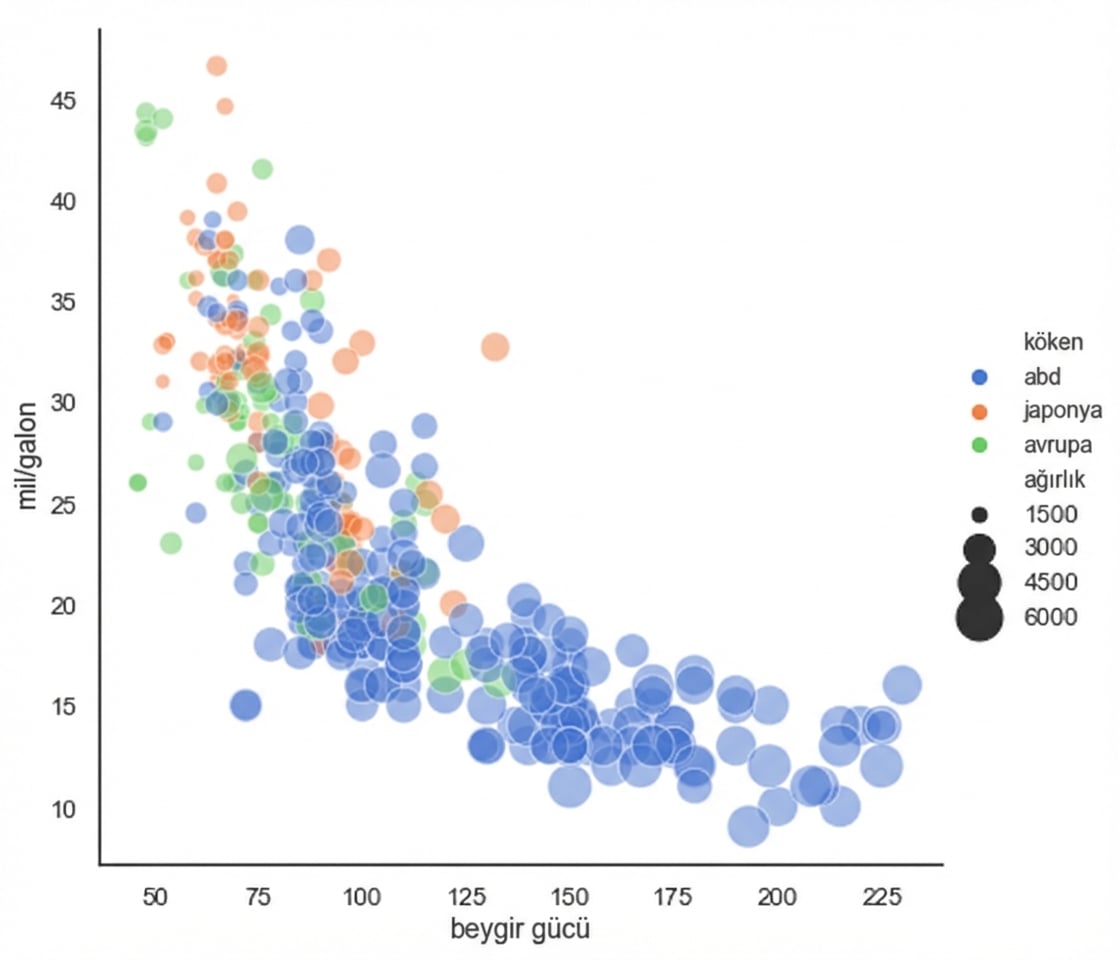
pandas + Matplotlib = Seaborn
seaborn.relplot(x="horsepower", y="mpg", hue="origin", size="weight",
                sizes=(40, 400), alpha=.5, palette="muted",
                height=6, data=mpg)