Seaborn ile pandas kullanma

Seaborn ile Veri Görselleştirmeye Giriş

Content Team

DataCamp

pandas nedir?

  • Veri analizi için Python kütüphanesi
  • csv, txt ve diğer dosya türlerinden veri okur
  • Veriler DataFrame nesneleri şeklindedir
Seaborn ile Veri Görselleştirmeye Giriş

DataFrame'lerle çalışmak

import pandas as pd

df = pd.read_csv("masculinity.csv")
df.head()
    participant_id        age    how_masculine    how_important
0                1    18 - 34         Somewhat         Somewhat
1                2    18 - 34         Somewhat         Somewhat
2                3    18 - 34             Very         Not very
3                4    18 - 34             Very         Not very
4                5    18 - 34             Very             Very
Seaborn ile Veri Görselleştirmeye Giriş

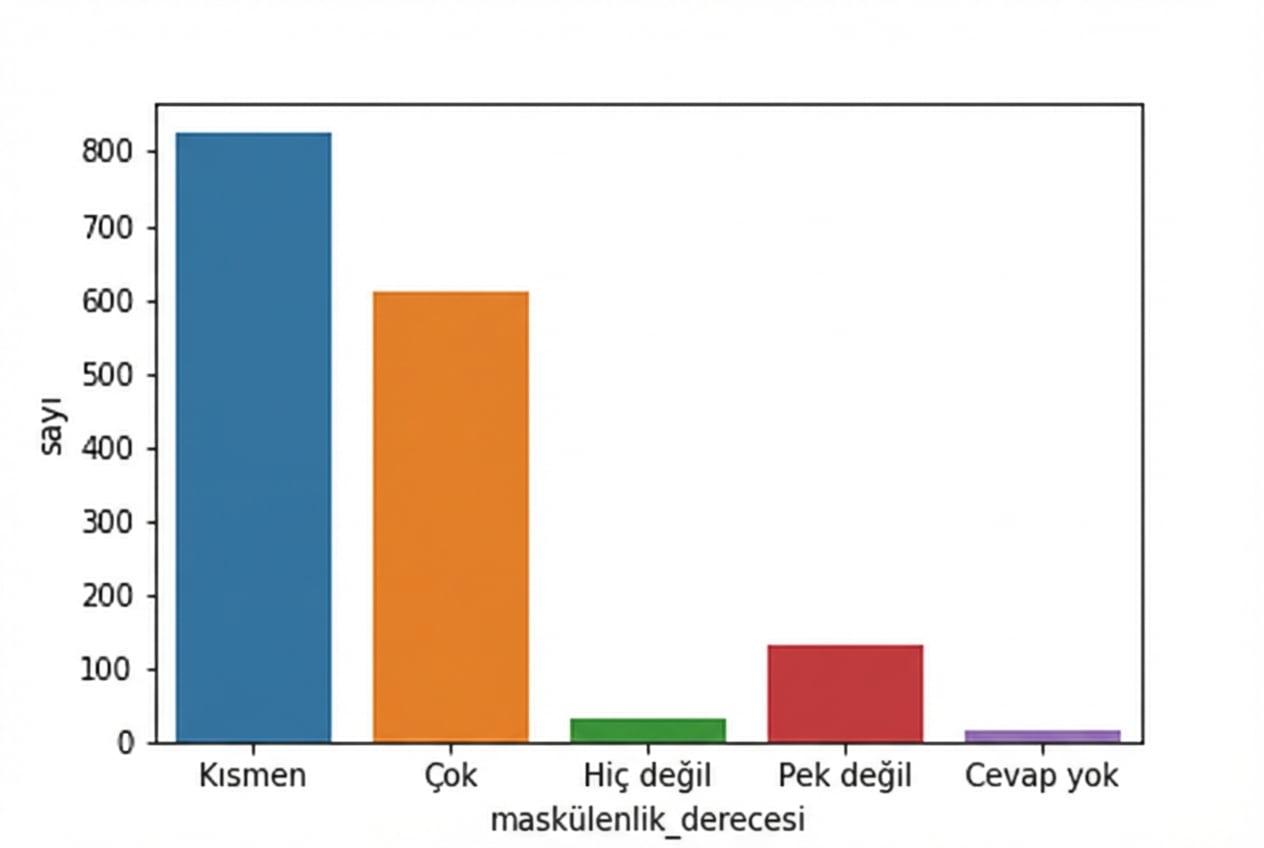
countplot() ile DataFrame kullanımı

import pandas as pd
import matplotlib.pyplot as plt
import seaborn as sns

df = pd.read_csv("masculinity.csv")
sns.countplot(x="how_masculine", data=df)
plt.show()

"how_masculine" sütununun bir count plot'u

Seaborn ile Veri Görselleştirmeye Giriş

masculinity DataFrame'inin ilk 10 satırı

Seaborn ile Veri Görselleştirmeye Giriş

"Düzensiz" bir DataFrame

Seaborn ile Veri Görselleştirmeye Giriş

Haydi pratik yapalım!

Seaborn ile Veri Görselleştirmeye Giriş

Preparing Video For Download...