Çubuk grafiği oluşturma
Python ile Veri Bilimine Giriş

Hillary Green-Lerman
Lead Data Scientist, Looker
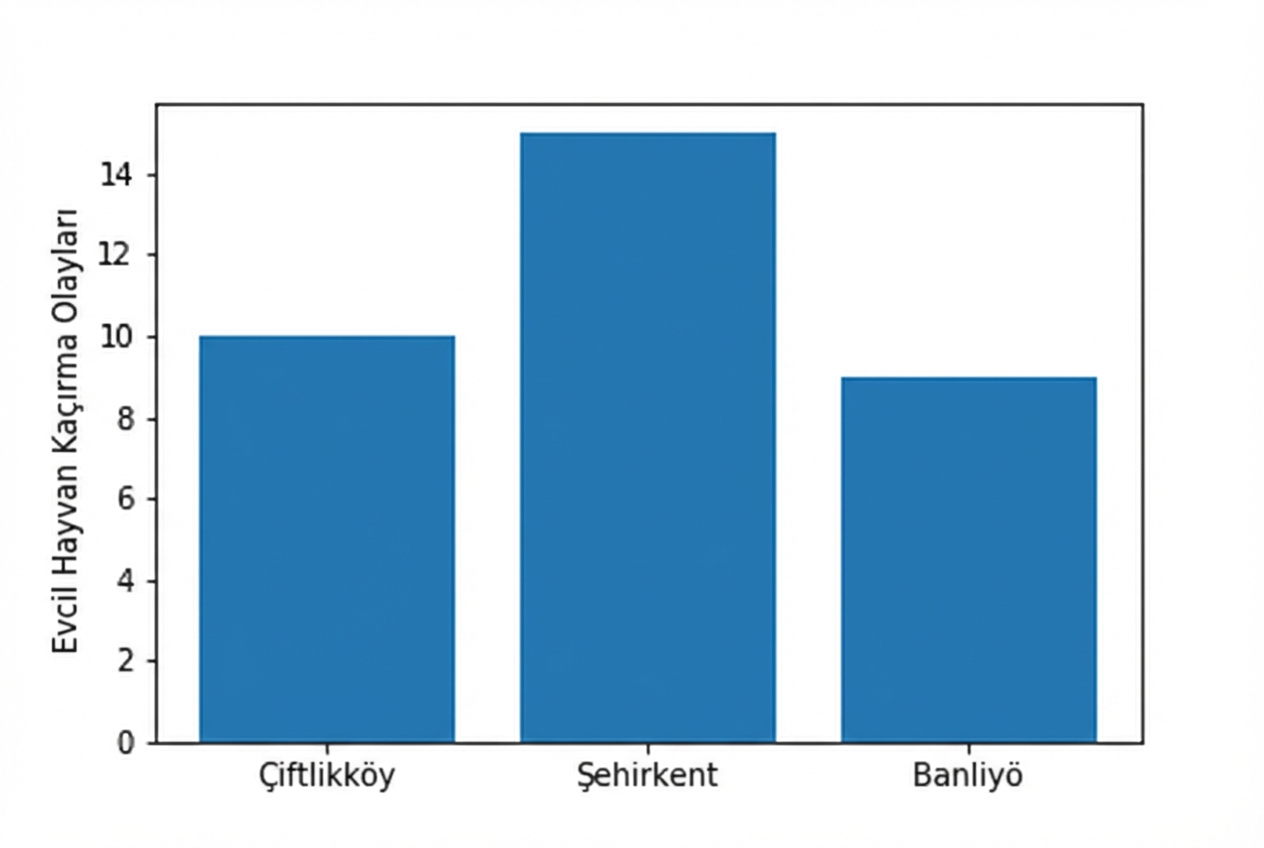
Evcil hayvan suçlarını karşılaştırma
plt.bar(df.precinct,
        df.pets_abducted)

plt.ylabel('Pet Abductions')
plt.show()
Yatay çubuk grafikler

Hata çubukları ekleme
plt.bar(df.precinct, df.pet_abductions,
        yerr=df.error)

plt.ylabel('Pet Abductions')
plt.show()

Yığılmış çubuk grafikler
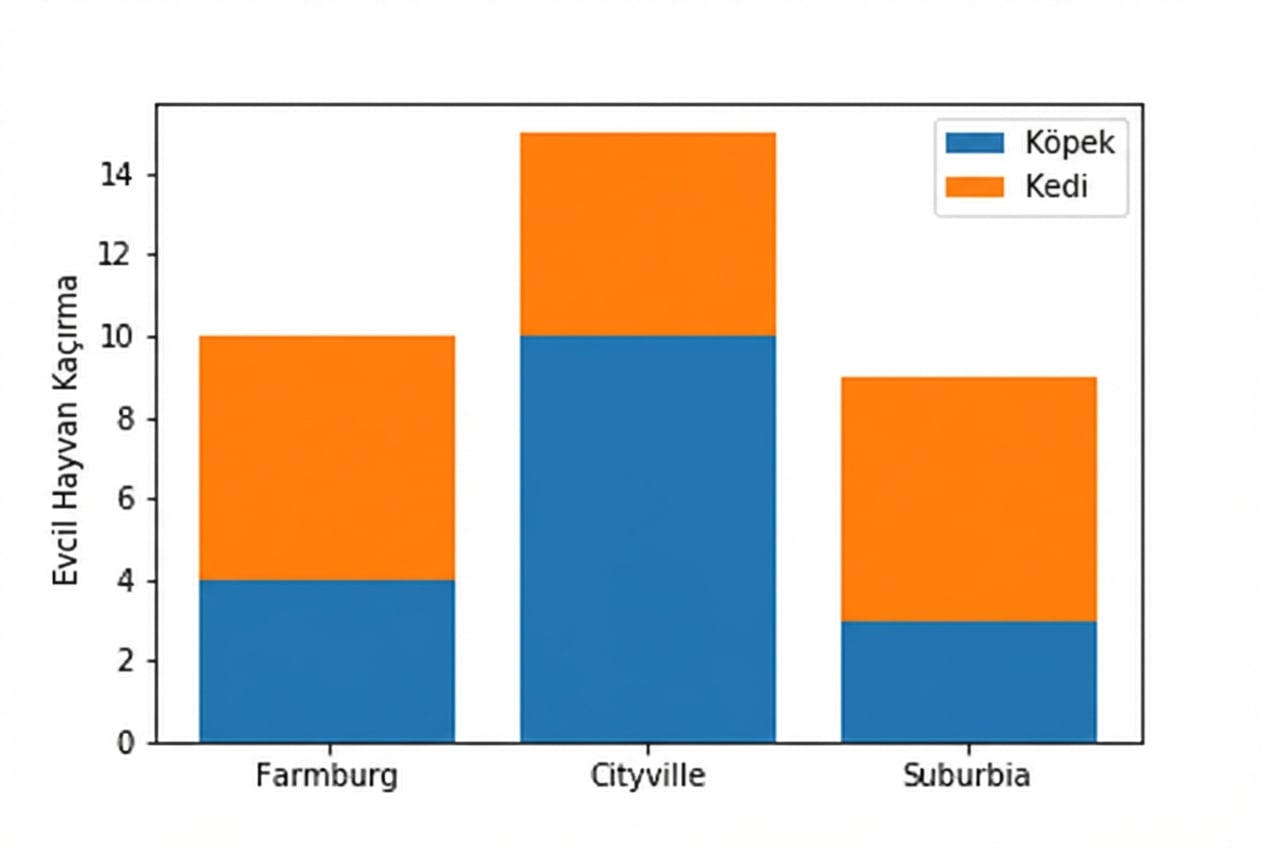
Yığılmış çubuk grafikler
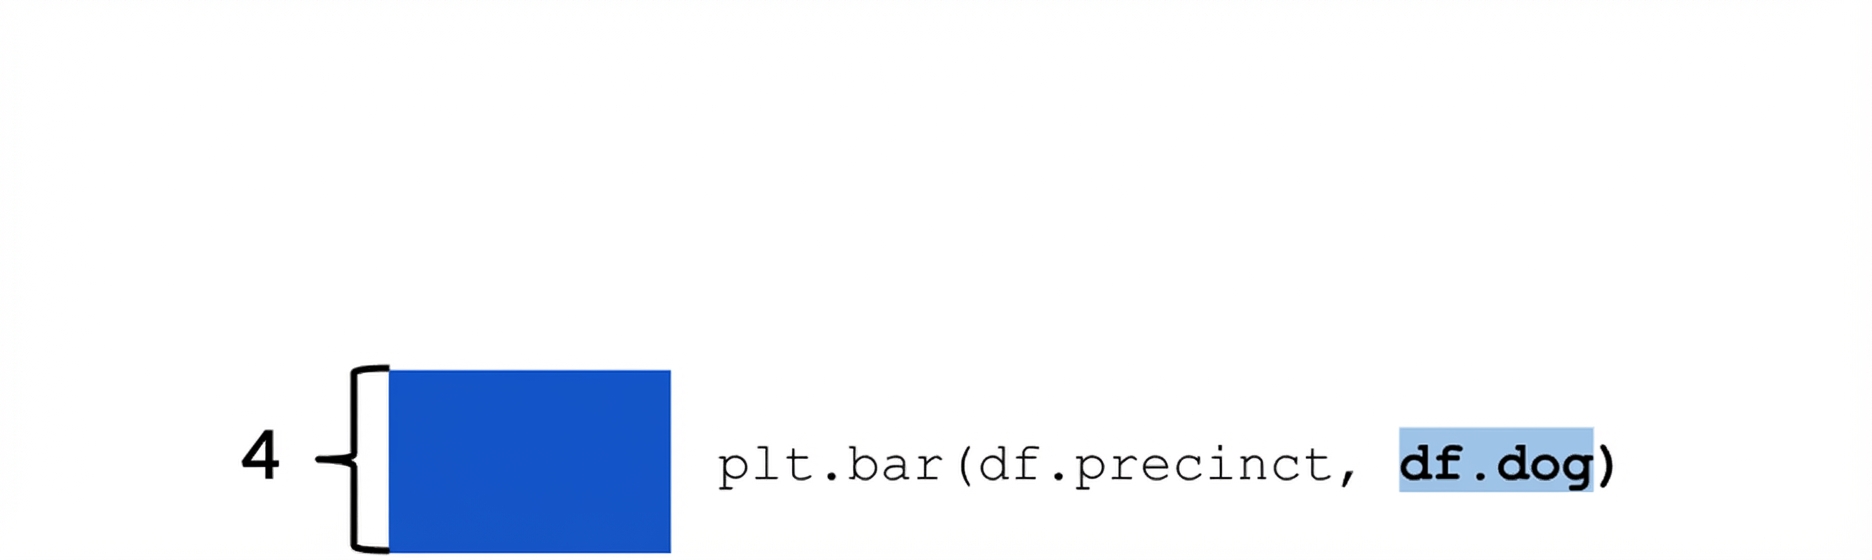
Yığılmış çubuk grafikler
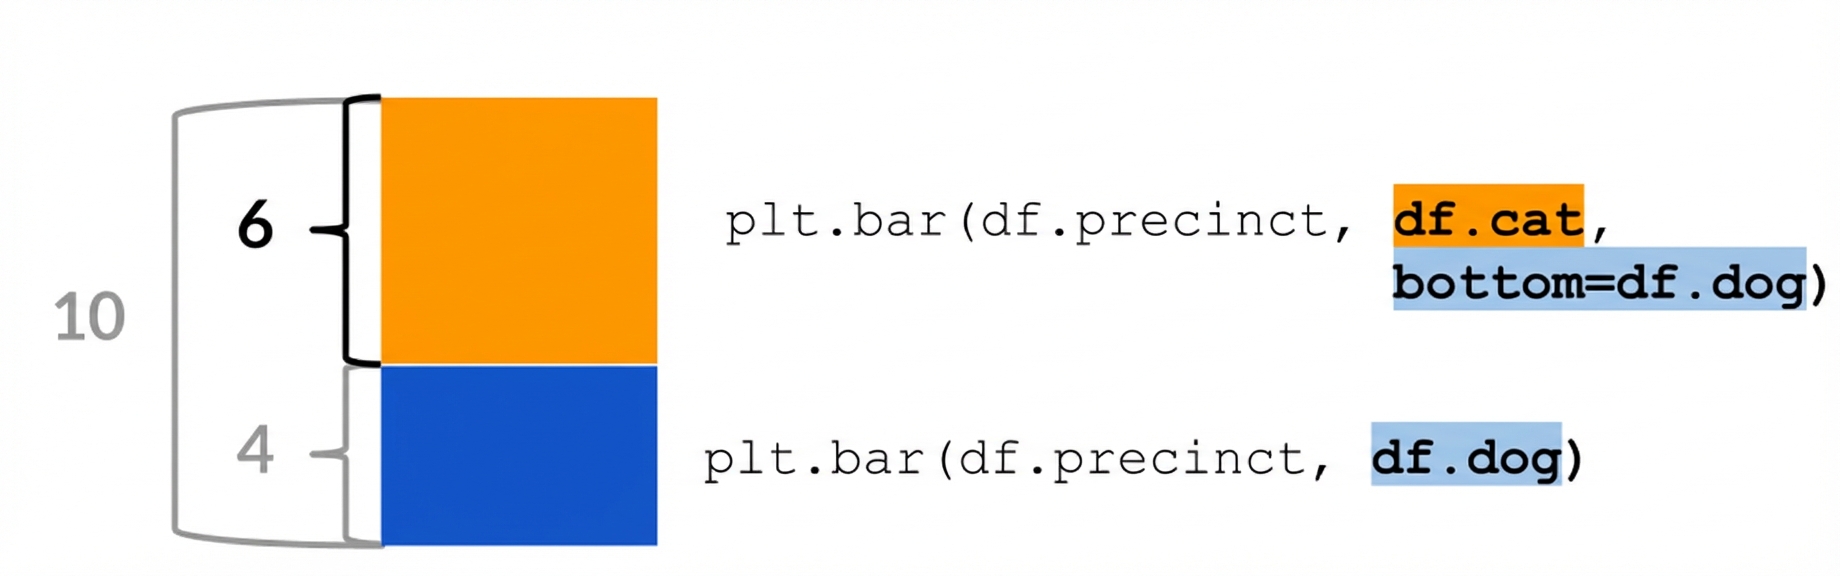
Yığılmış çubuk grafikler

