Çizgi grafikleri oluşturma
Python ile Veri Bilimine Giriş

Hillary Green-Lerman
Lead Data Scientist, Looker
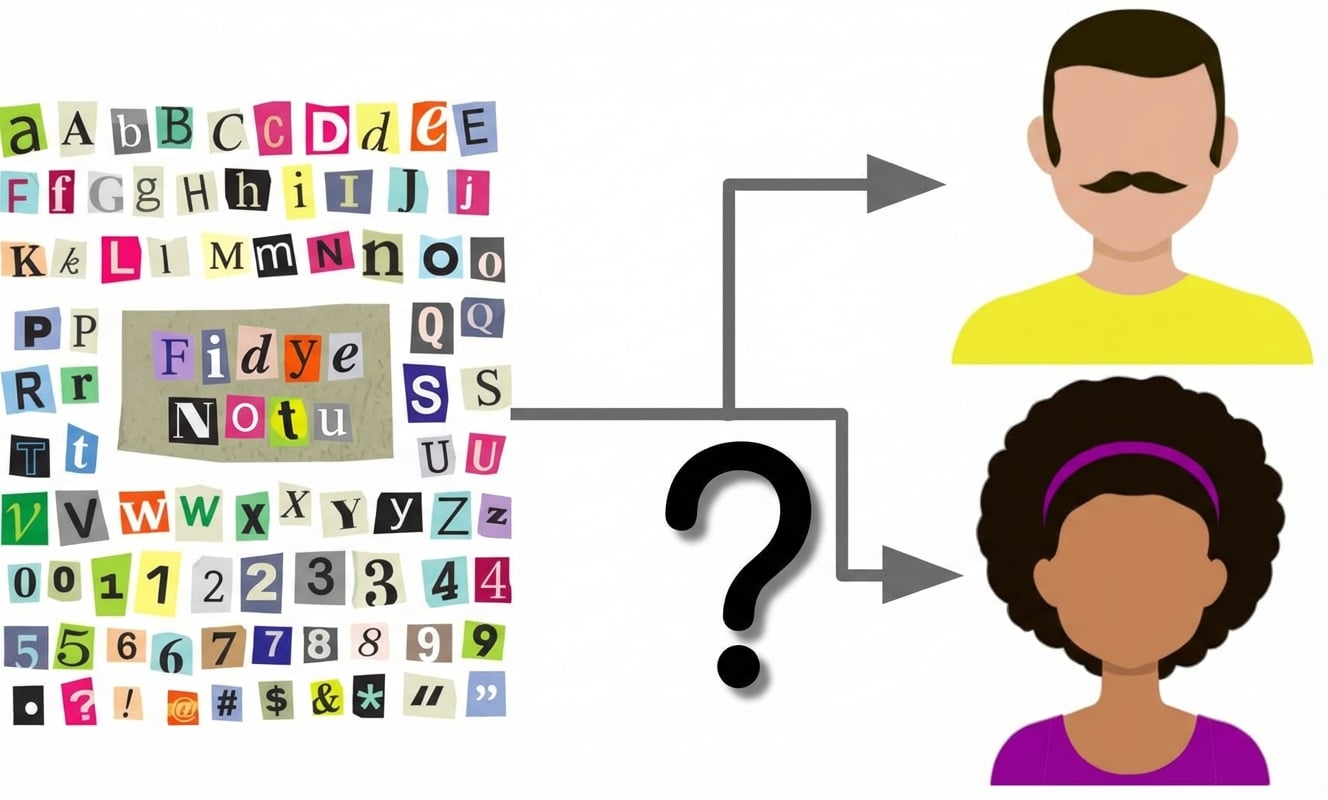
Olaylar karışıyor
DataFrame'den görselleştirmeye
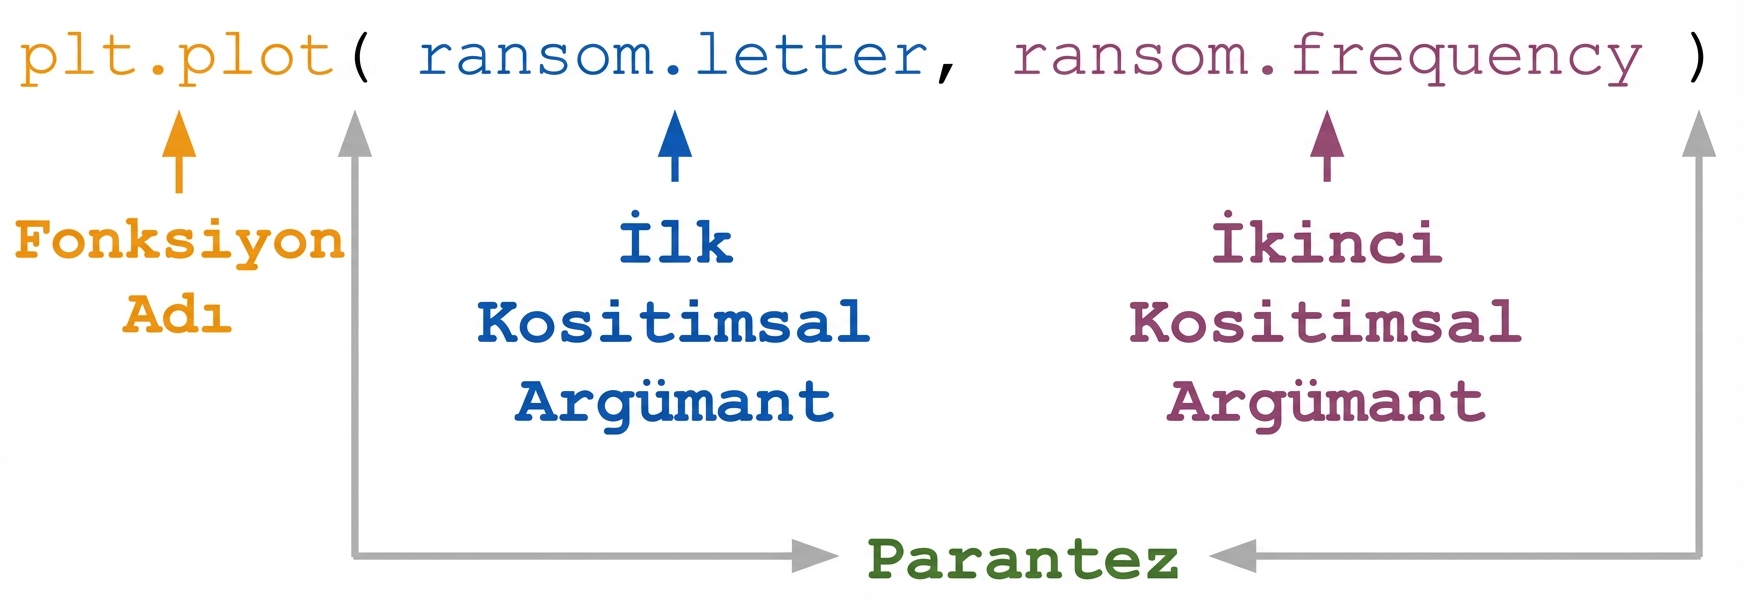
Matplotlib'e giriş
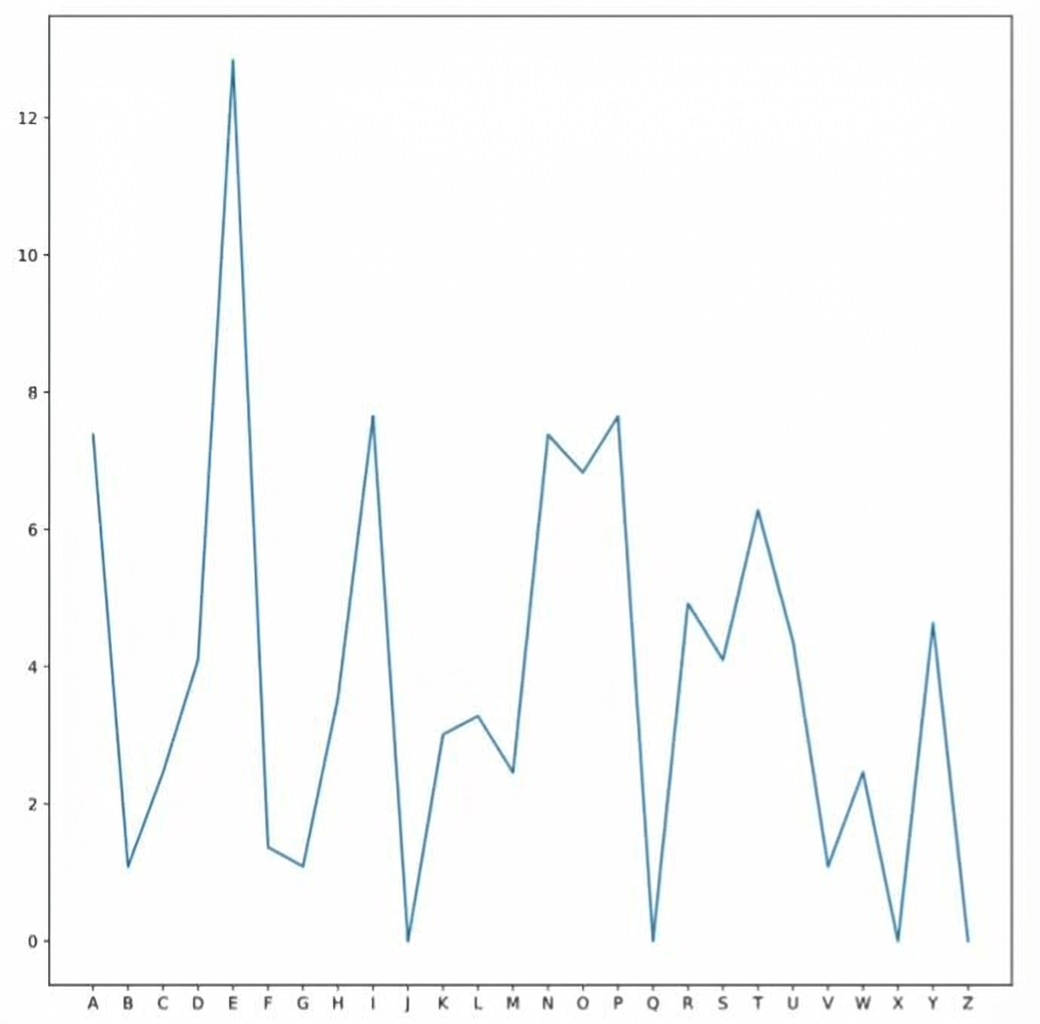
Çizgi grafiği
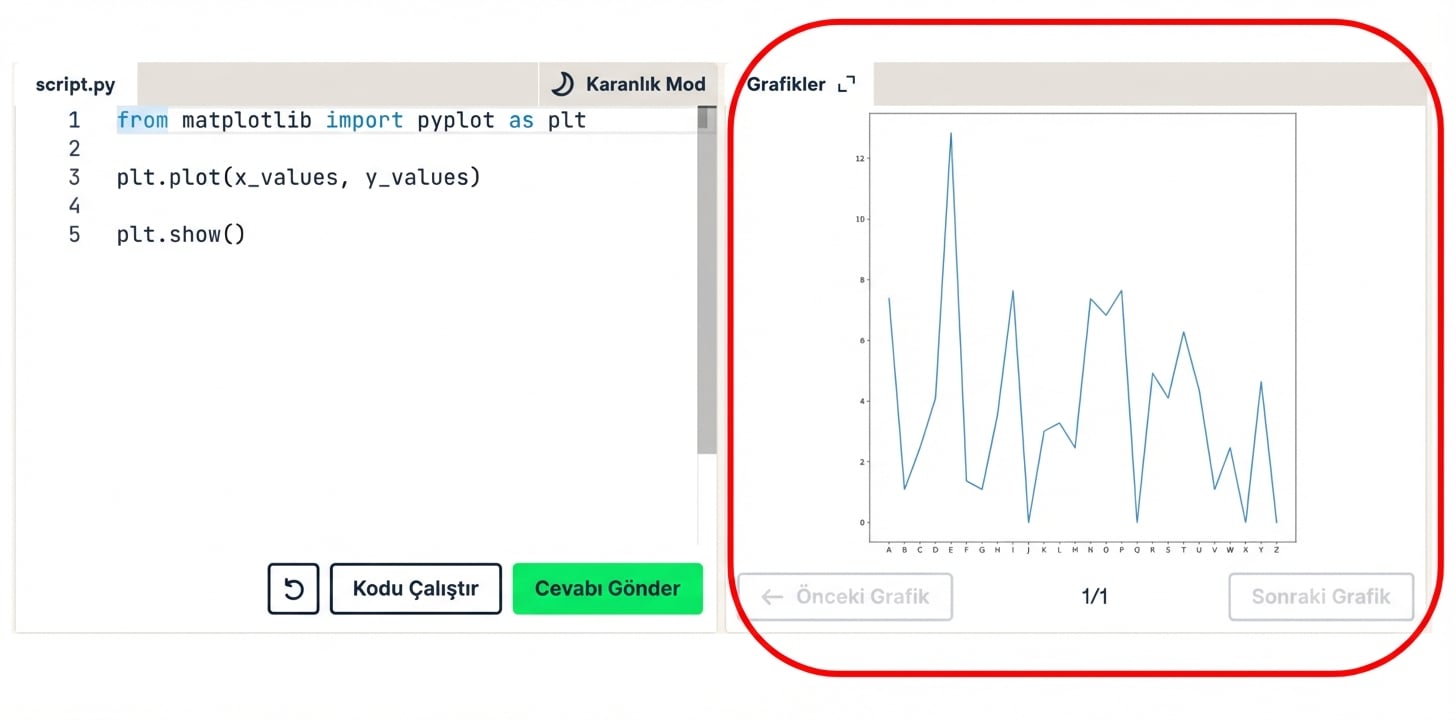
Sonuçları görüntüleme
plt.show()
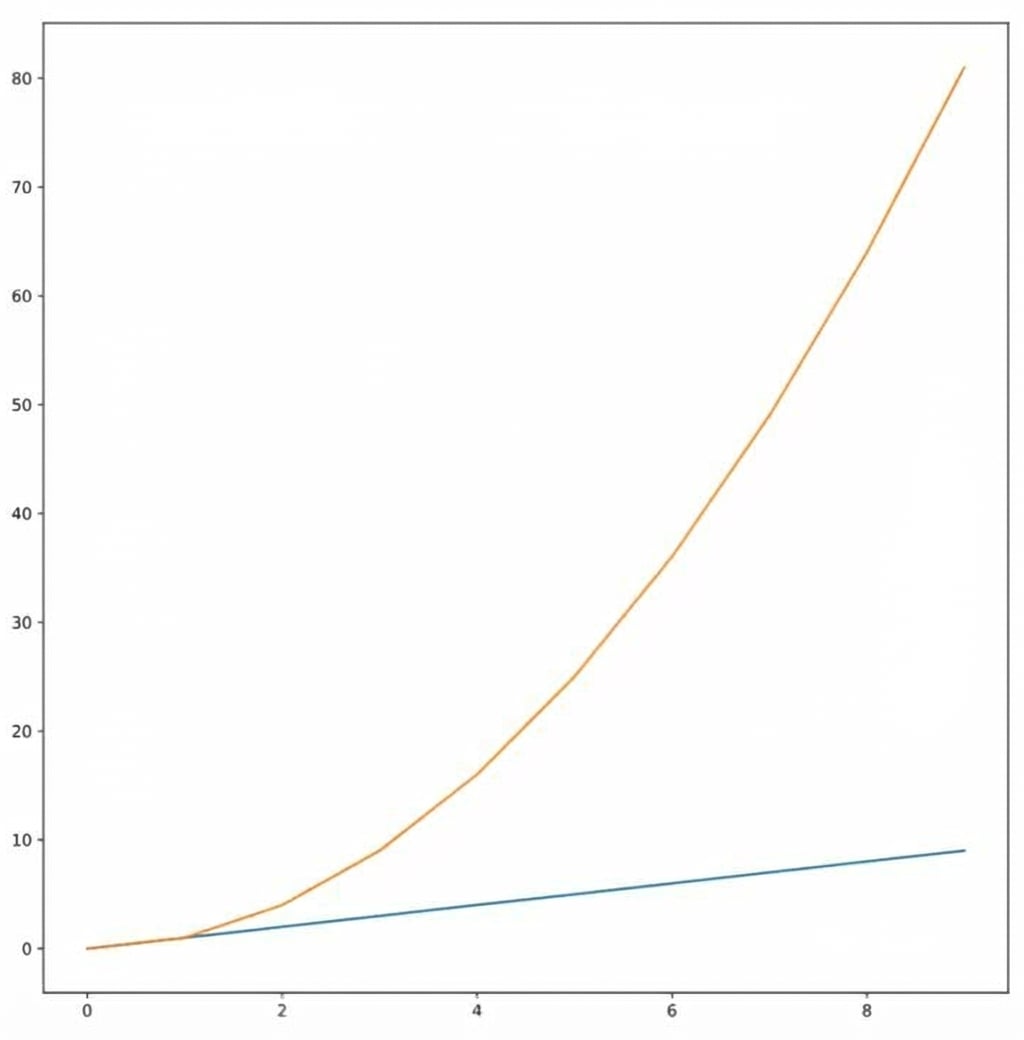
Birden çok çizgi
Python ile Veri Bilimine Giriş
Hillary Green-Lerman
Lead Data Scientist, Looker
plt.show()

