Etiketler ve açıklamalar
Python ile Veri Bilimine Giriş

Hillary Green-Lerman
Lead Data Scientist, Looker
Az önce neyi çizdirdik?
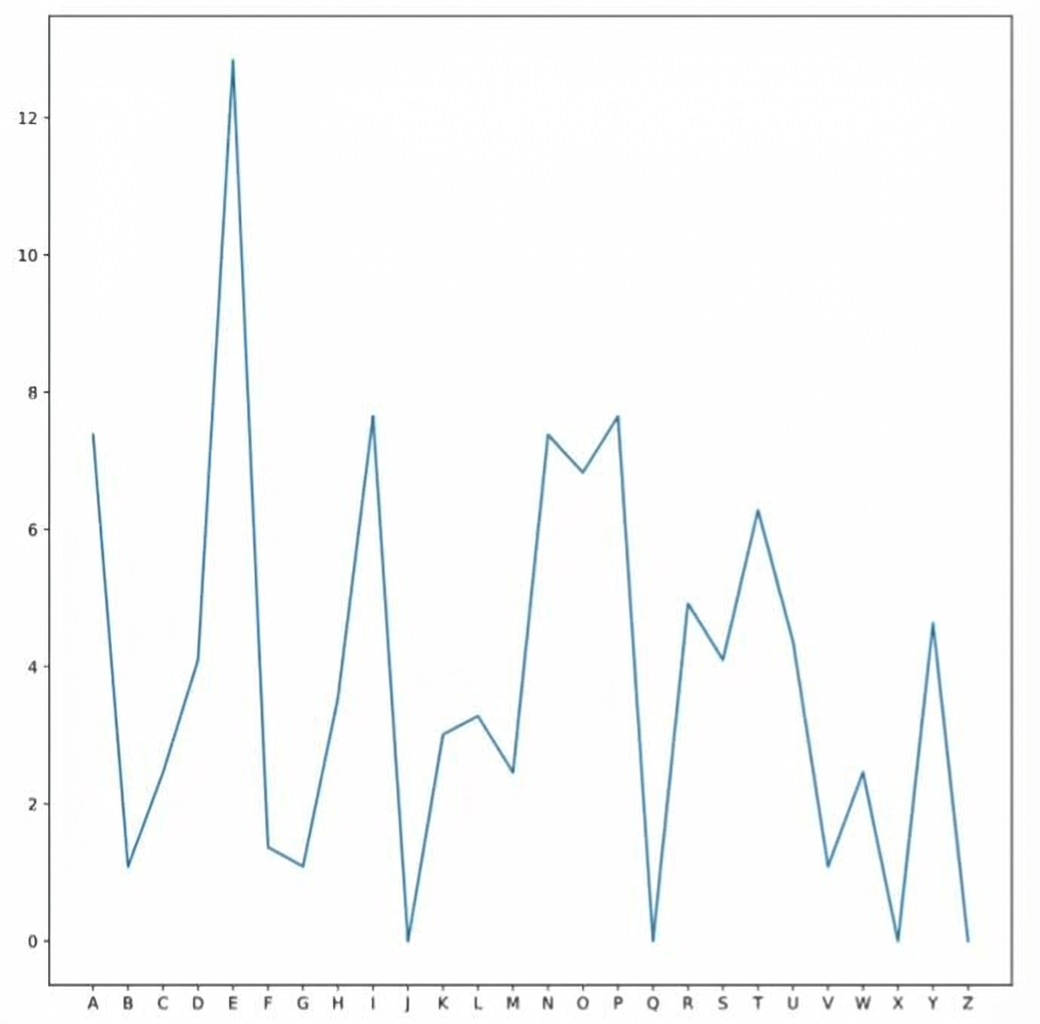
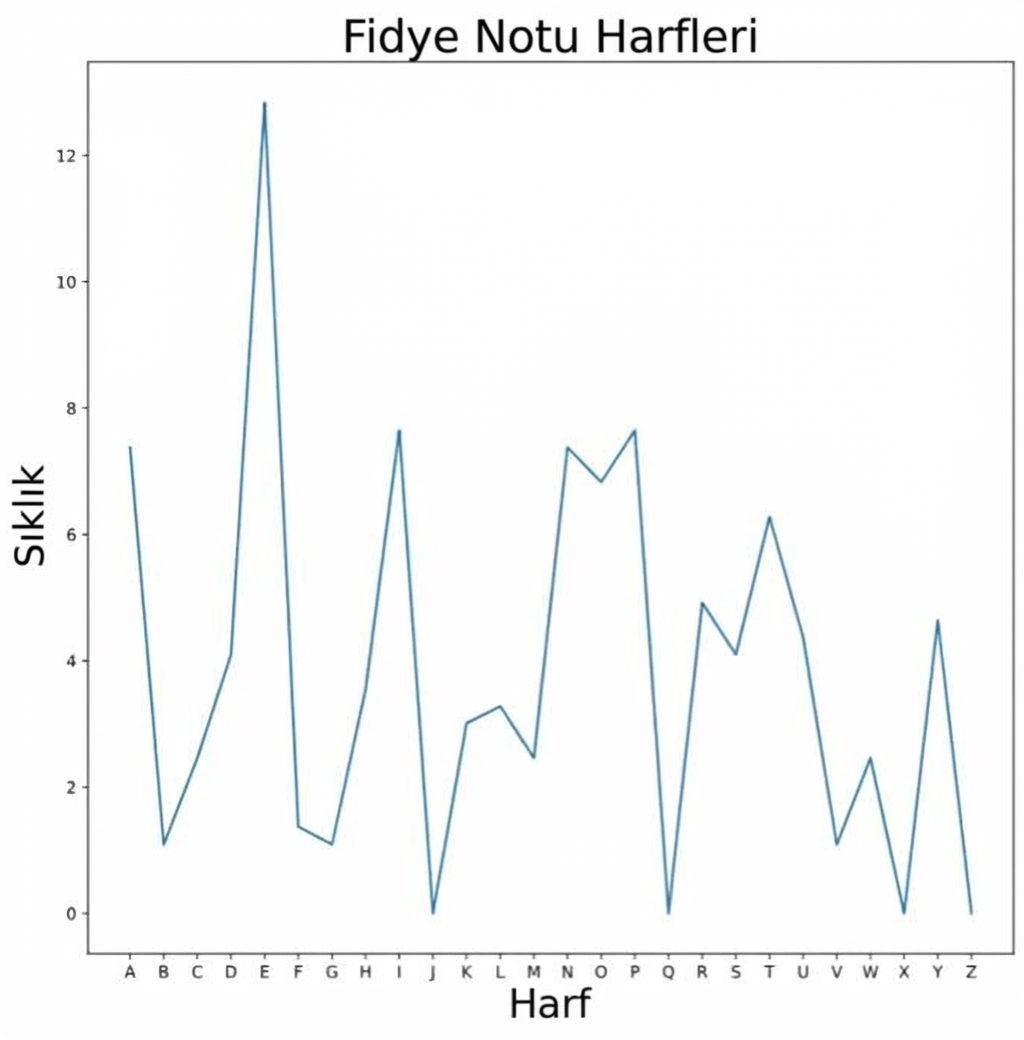
Eksen ve başlık etiketleri
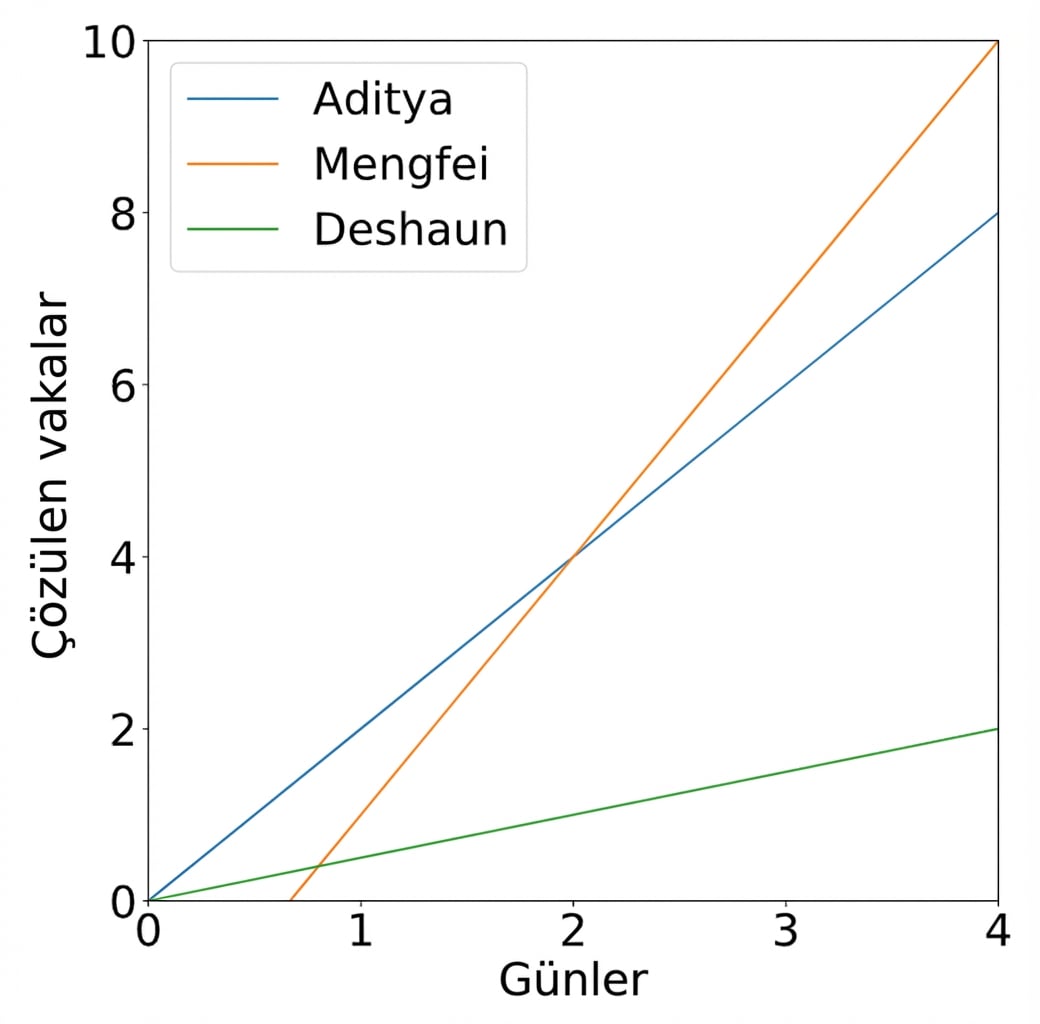
Açıklama kutuları
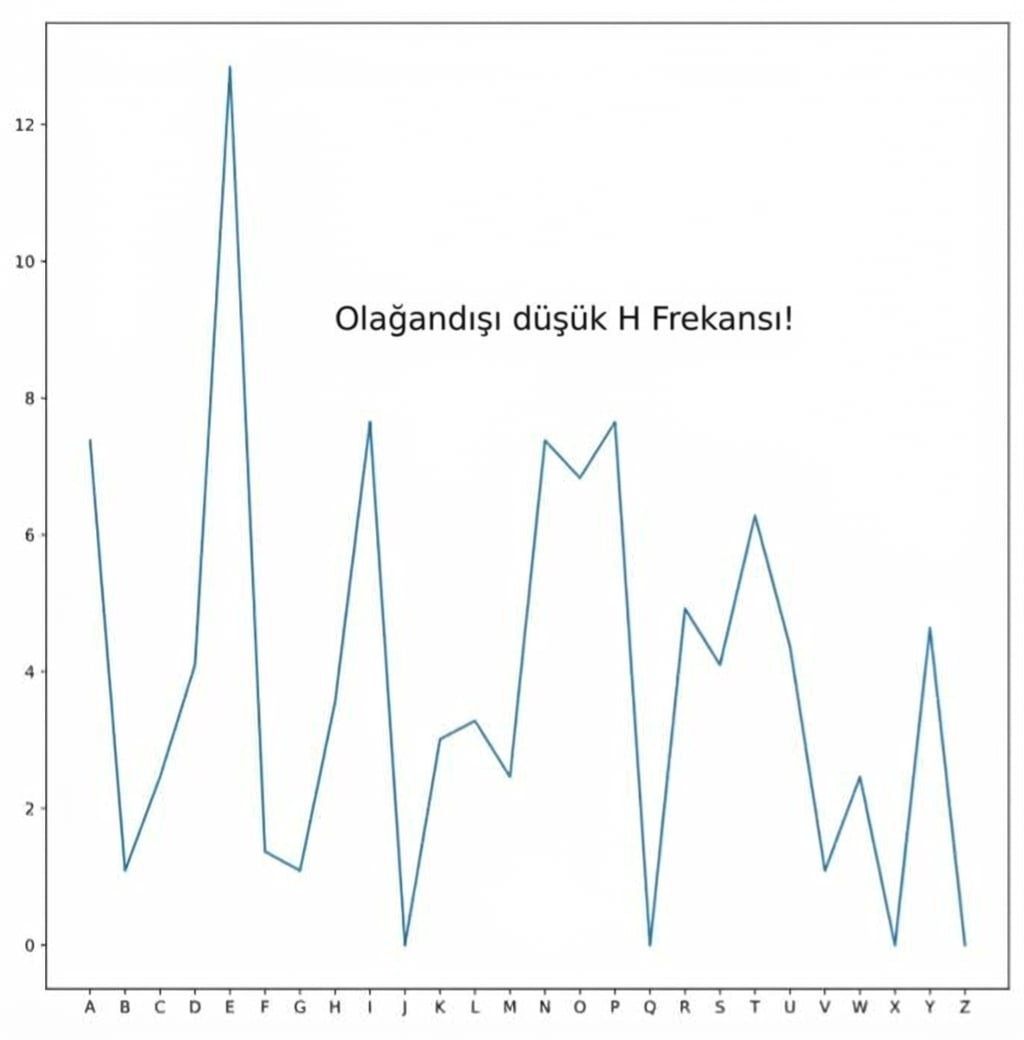
Serbest metin
Python ile Veri Bilimine Giriş
Hillary Green-Lerman
Lead Data Scientist, Looker

