Histogram oluşturma
Python ile Veri Bilimine Giriş

Hillary Green-Lerman
Lead Data Scientist, Looker
Kaçıranı iz sürme


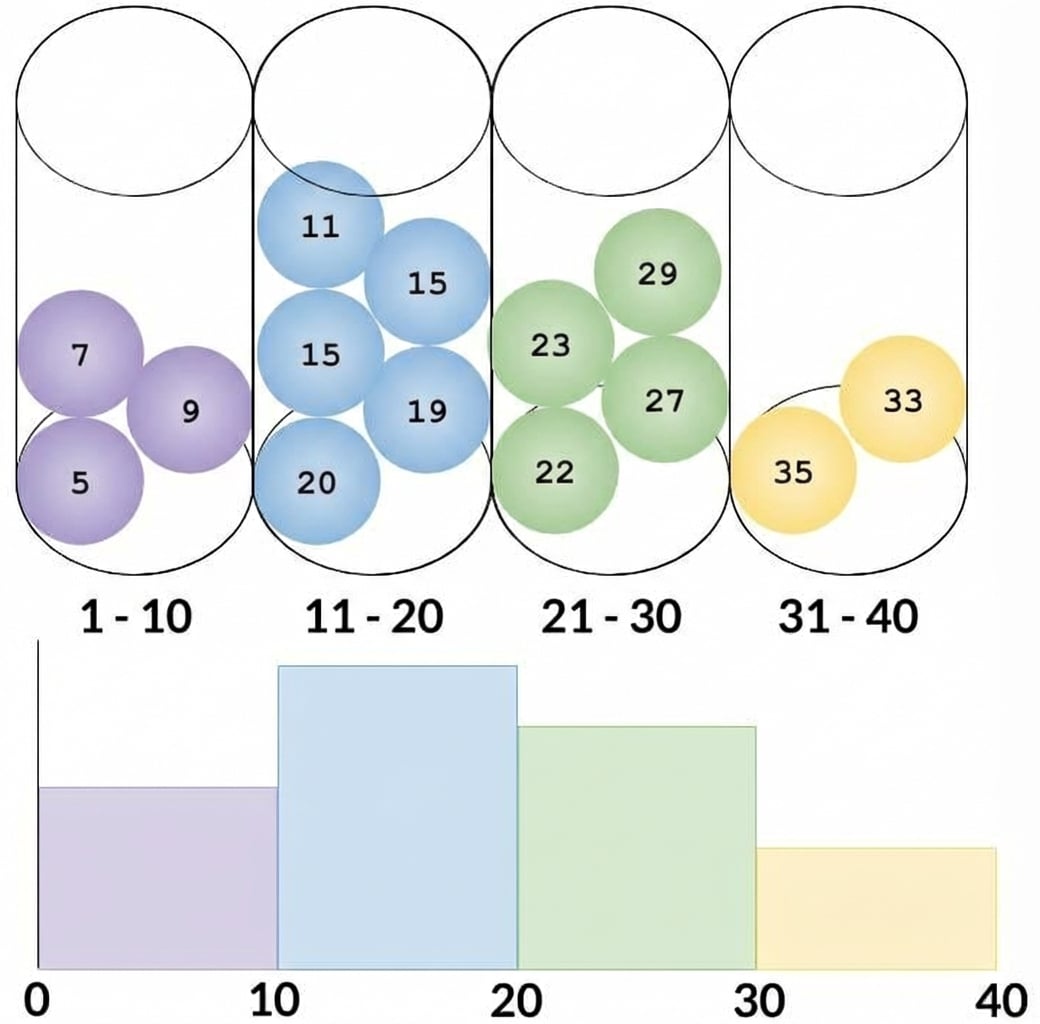
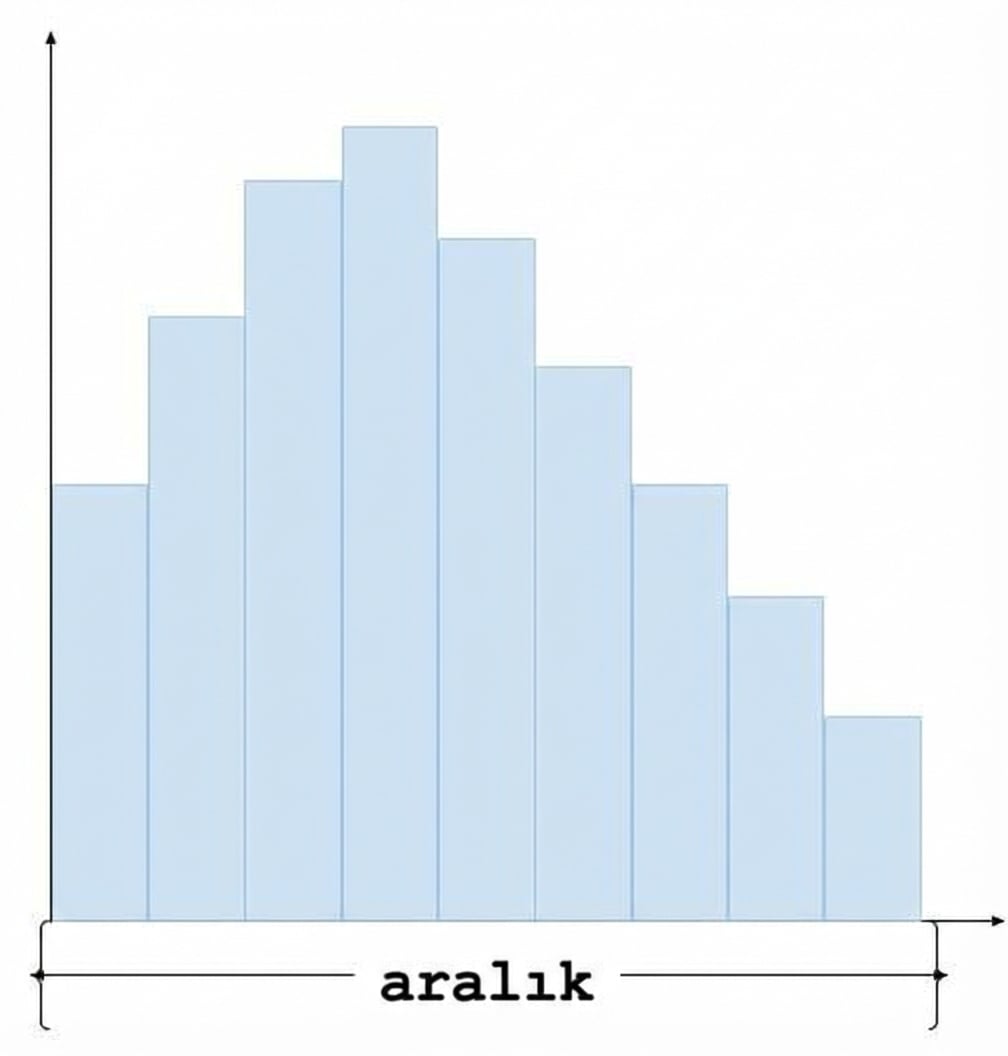
Histogram nedir?
matplotlib ile histogramlar
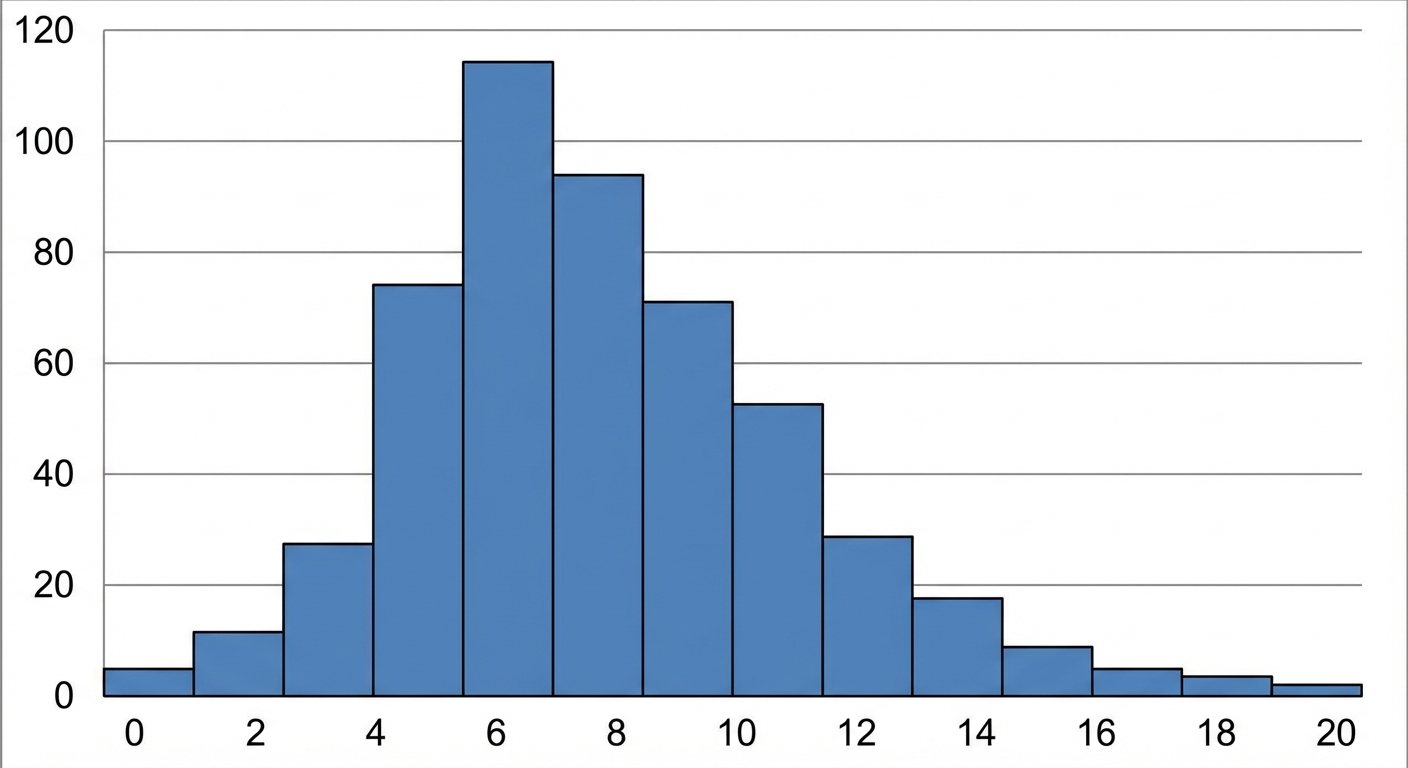
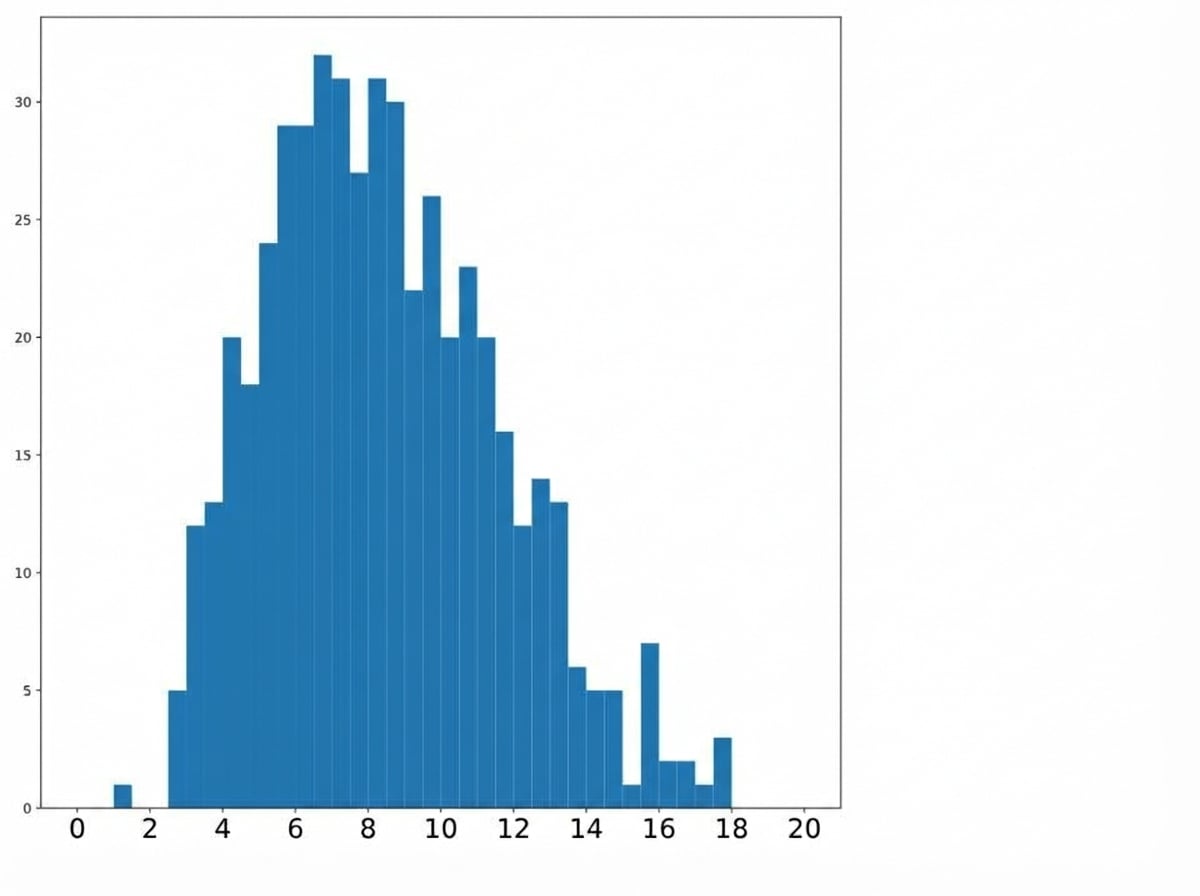
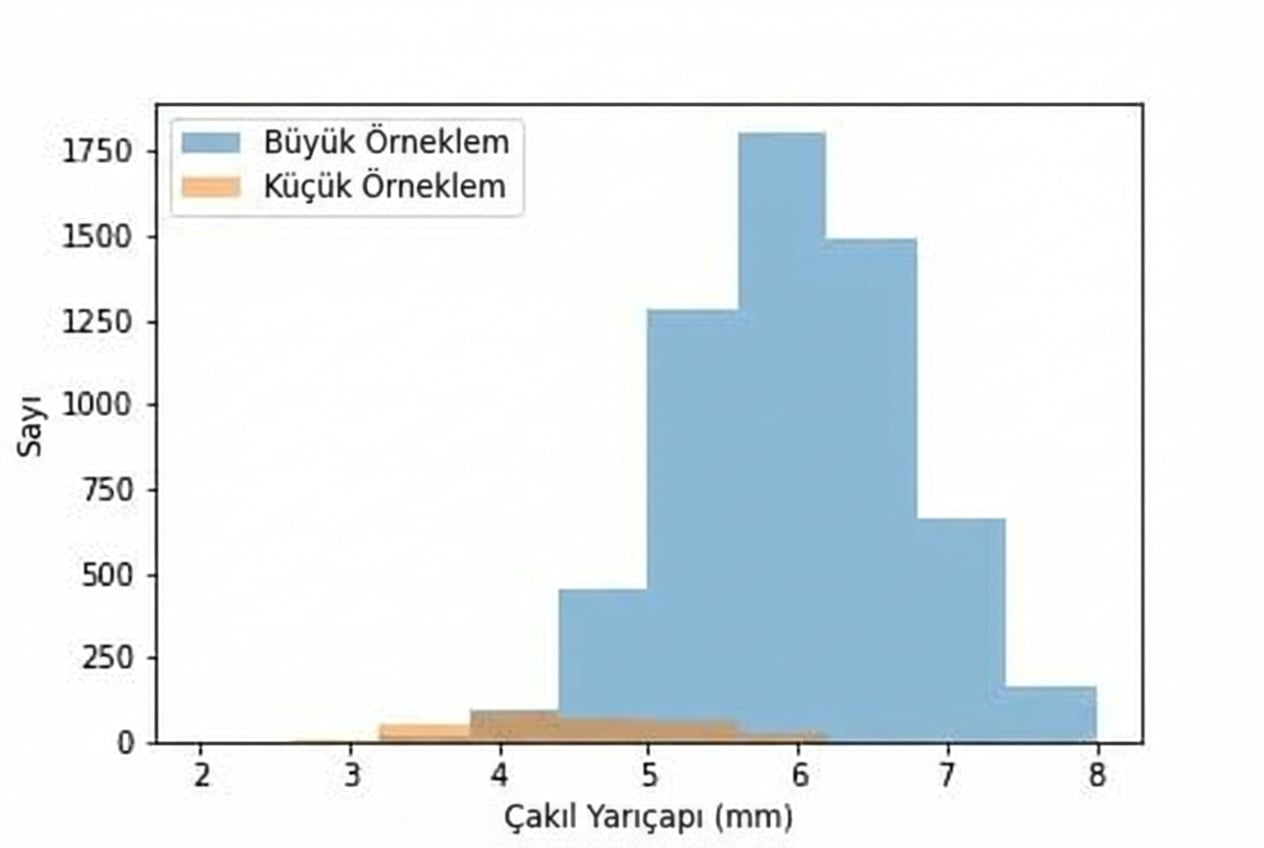
Kutu sayısını değiştirme
Aralığı değiştirme
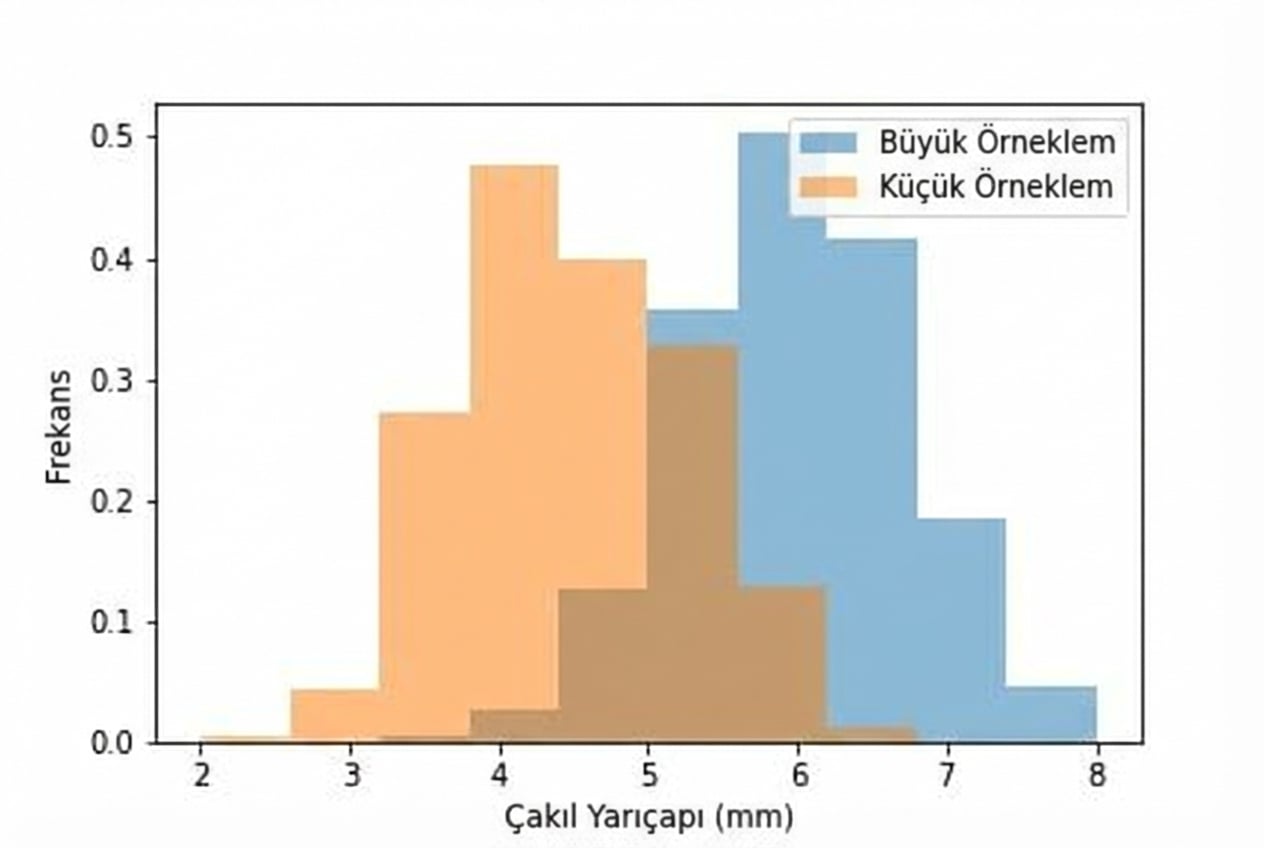
Normalize etme
Normalize edilmemiş çubuk grafiği
plt.hist(male_weight)
plt.hist(female_weight)
Çubuk alanlarının toplamı = 1
plt.hist(male_weight, density=True)
plt.hist(female_weight, density=True)