Saçılım grafiği oluşturma
Python ile Veri Bilimine Giriş

Hillary Green-Lerman
Lead Data Scientist, Looker
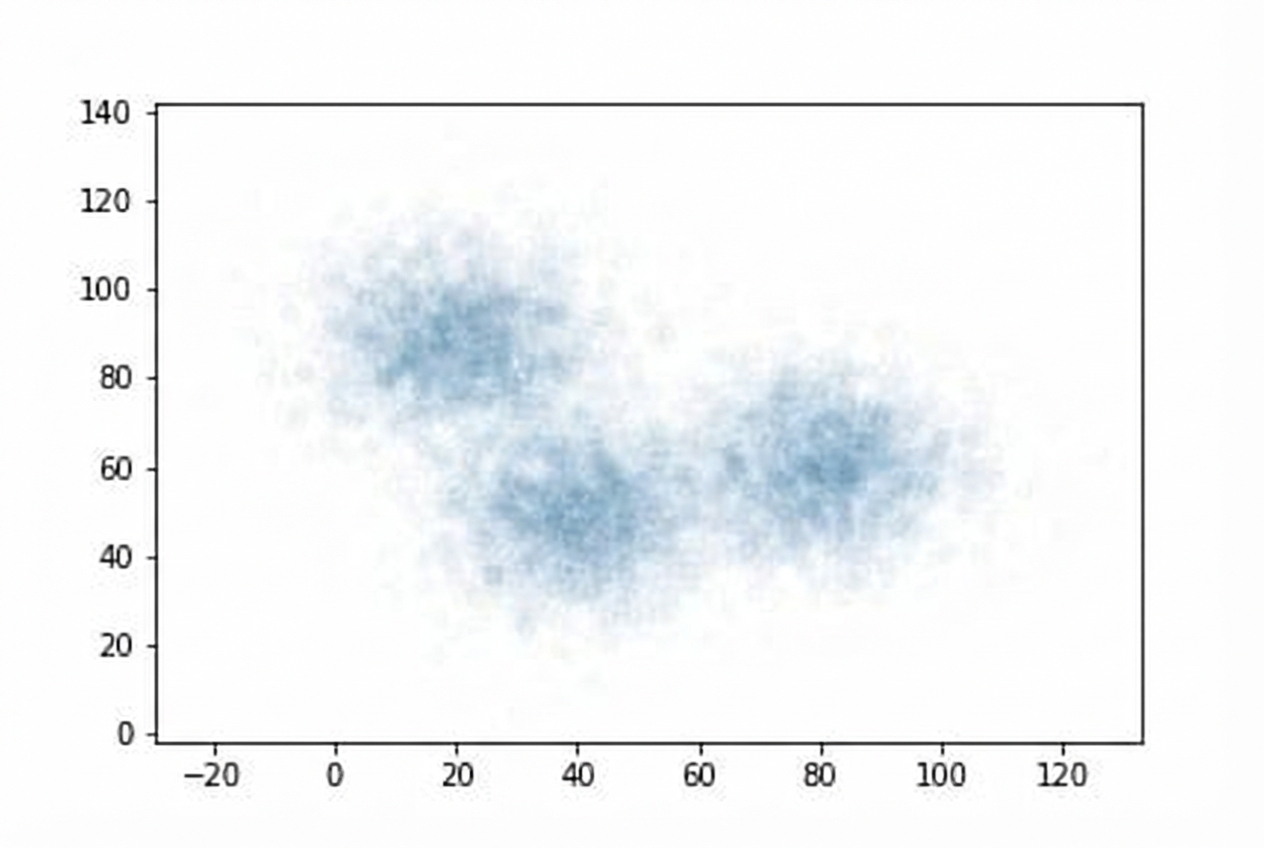
Cep telefonu sinyallerini haritalama

Saçılım grafiği nedir?
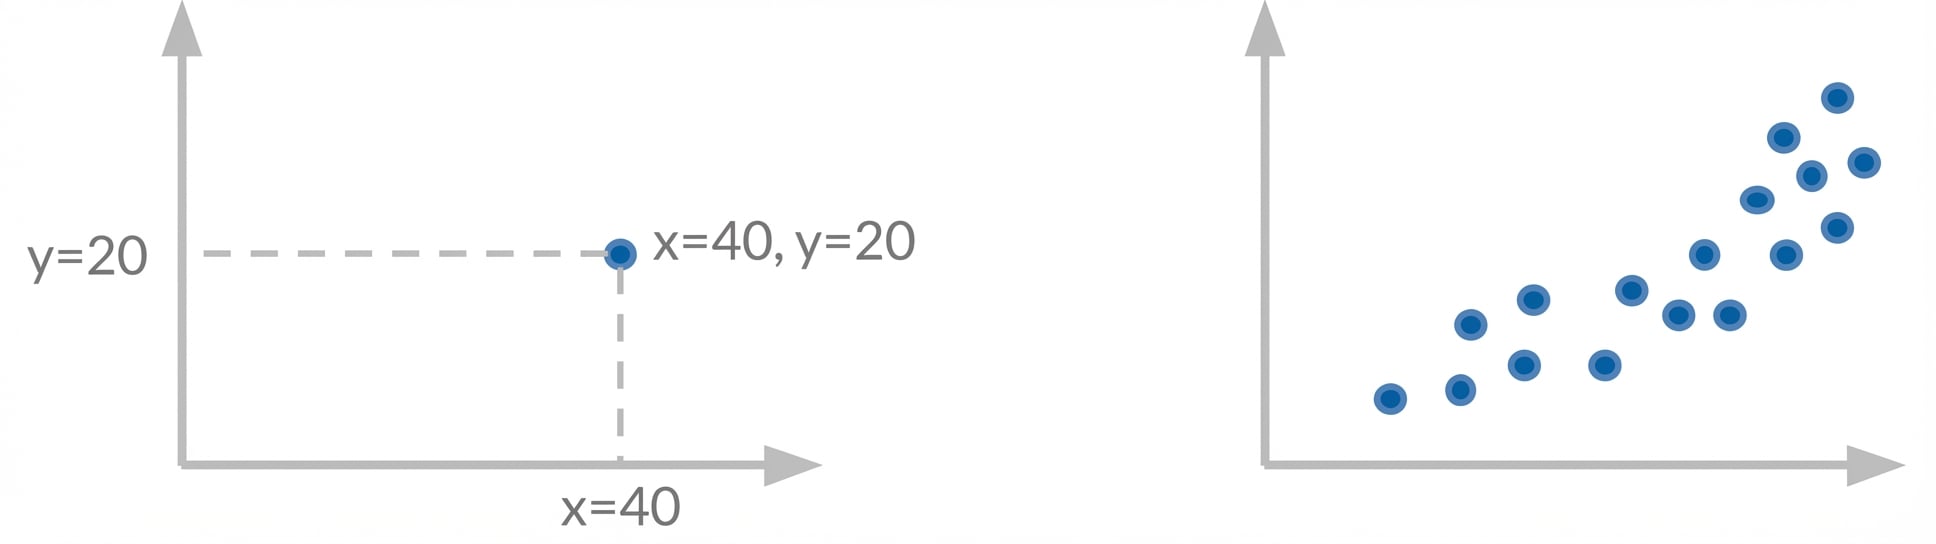
Saçılım grafiği nedir?
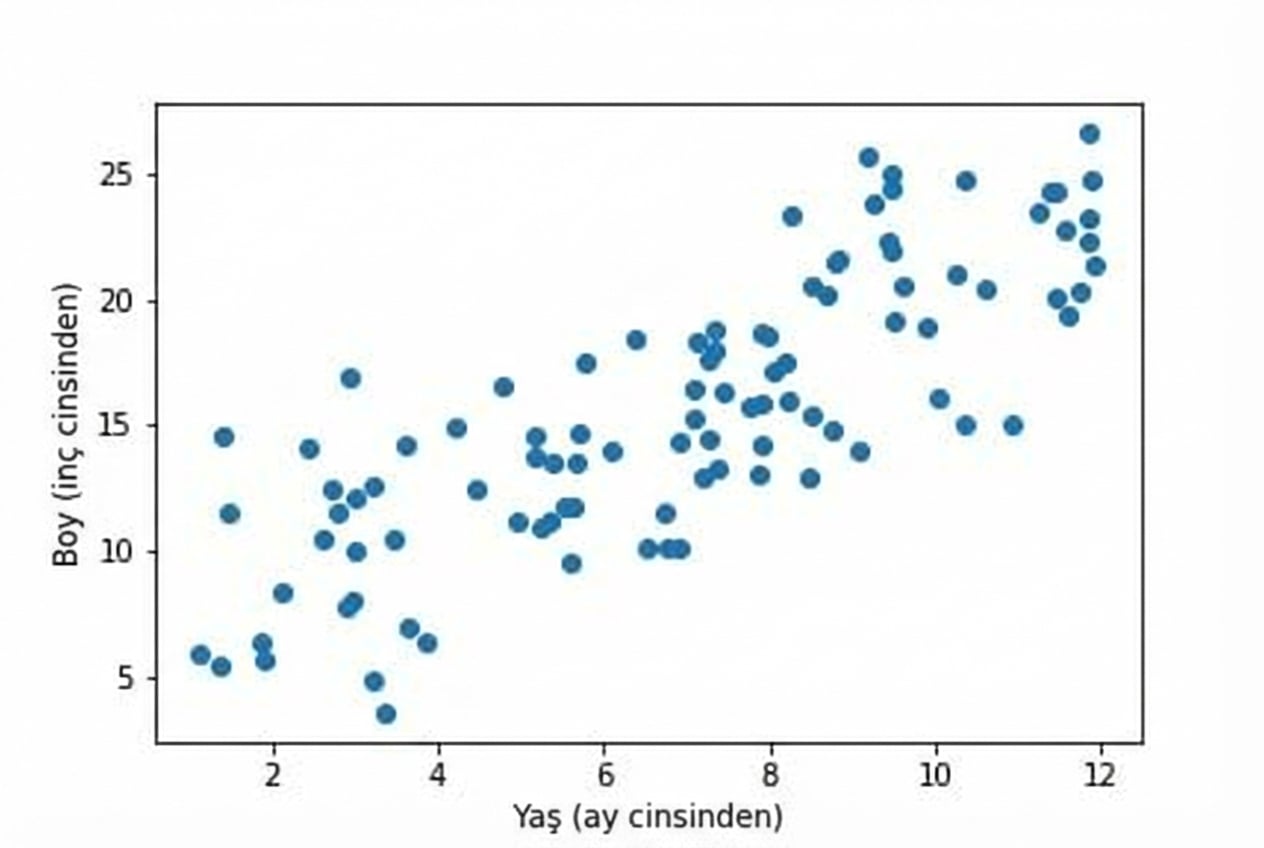
Saçılım grafiği oluşturma
Anahtar sözcük argümanları
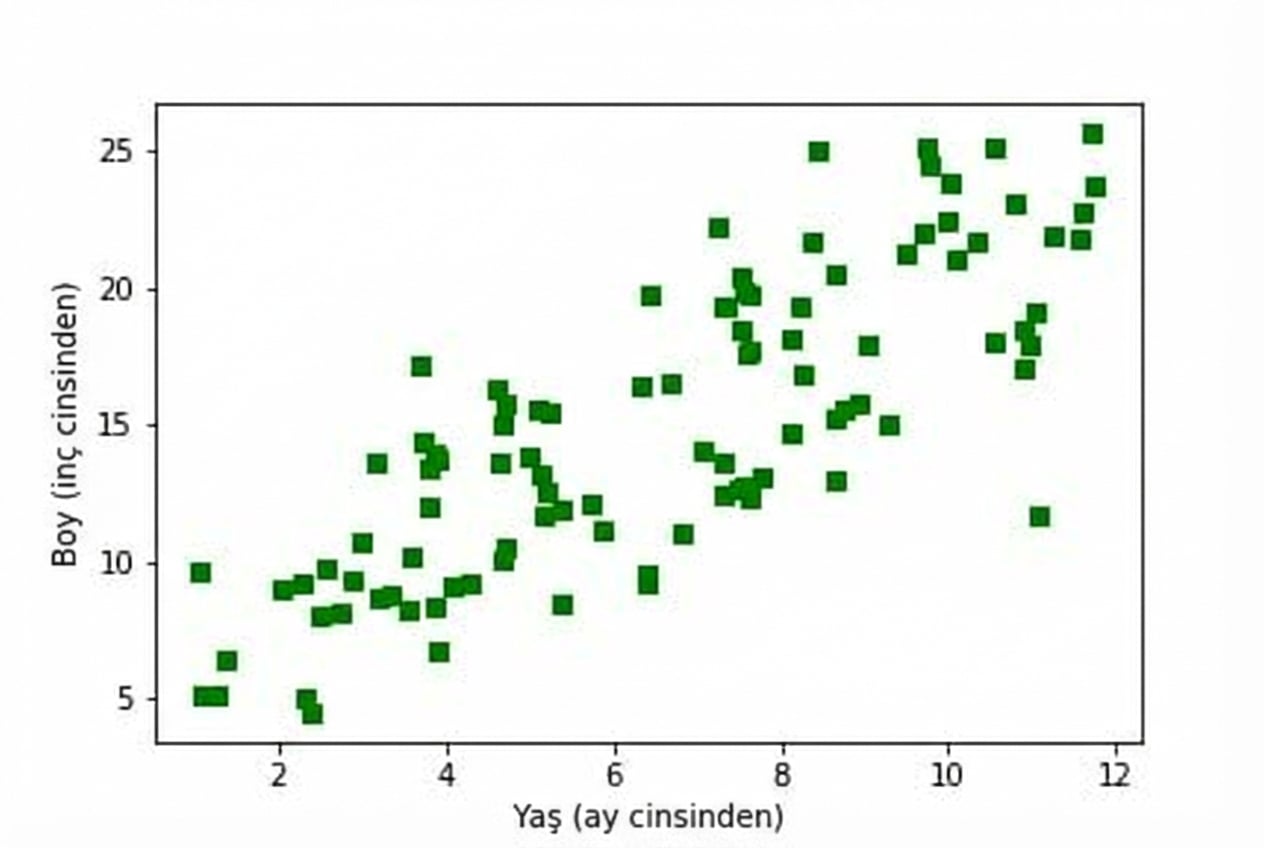
İşaretçi saydamlığını değiştirme
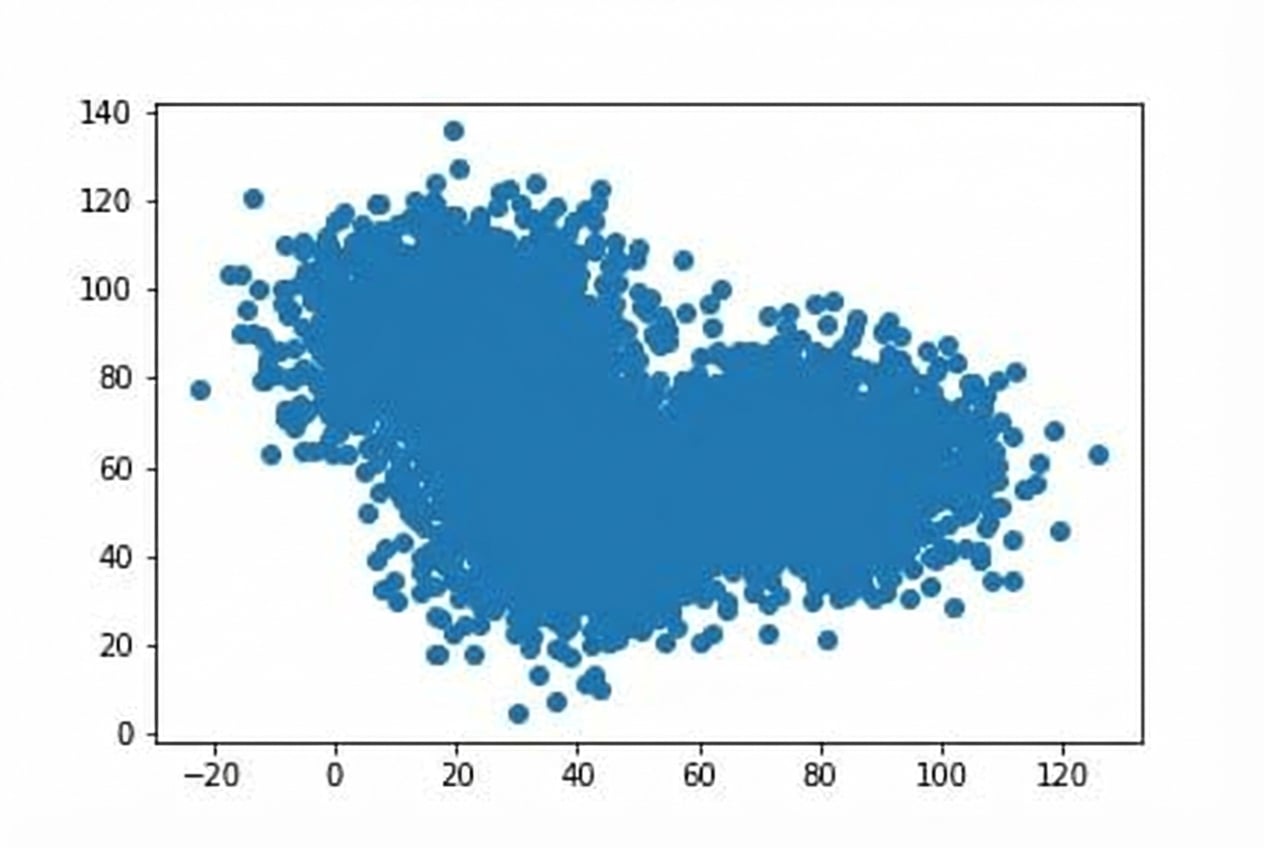
plt.scatter(df.x_data,
            df.y_data,
            alpha=0.1)