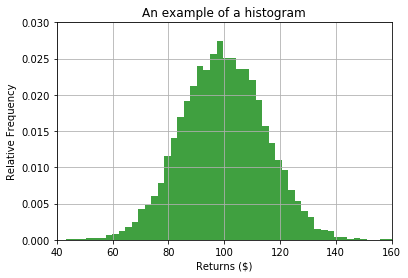
Histogramlar
Finans için Python’a Giriş

Adina Howe
Professor
Finansal analizde neden histogram?
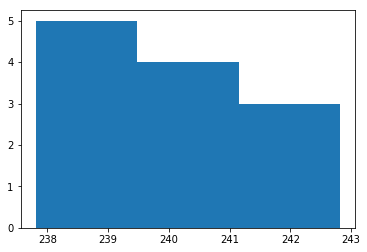
Histogramlar ve matplotlib.pyplot
import matplotlib.pyplot as plt
plt.hist(x=prices, bins=3)
plt.show()
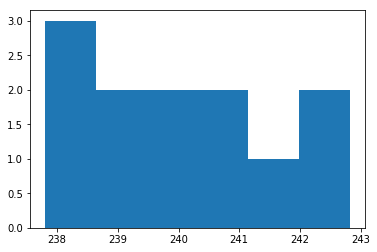
Kutu (bin) sayısını değiştirme
import matplotlib.pyplot as plt
plt.hist(prices, bins=6)
plt.show()
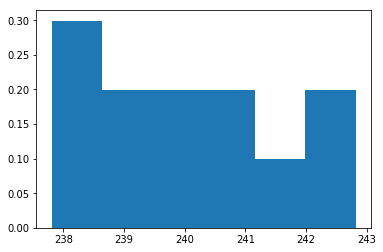
Histogram verisini normalize etme
import matplotlib.pyplot as plt
plt.hist(prices, bins=6, density=True)
plt.show()
Histogram sonucu
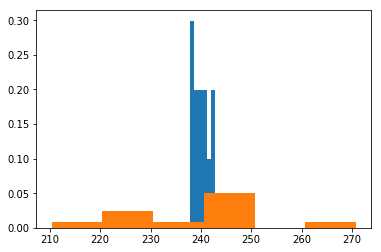
Histogram sonucu
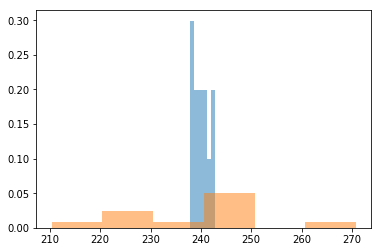
Histogram sonucu


