Python’da görselleştirme
Finans için Python’a Giriş

Adina Howe
Professor
Matplotlib: Görselleştirme paketi
Matplotlib galerisine bu bağlantıdan bakın.
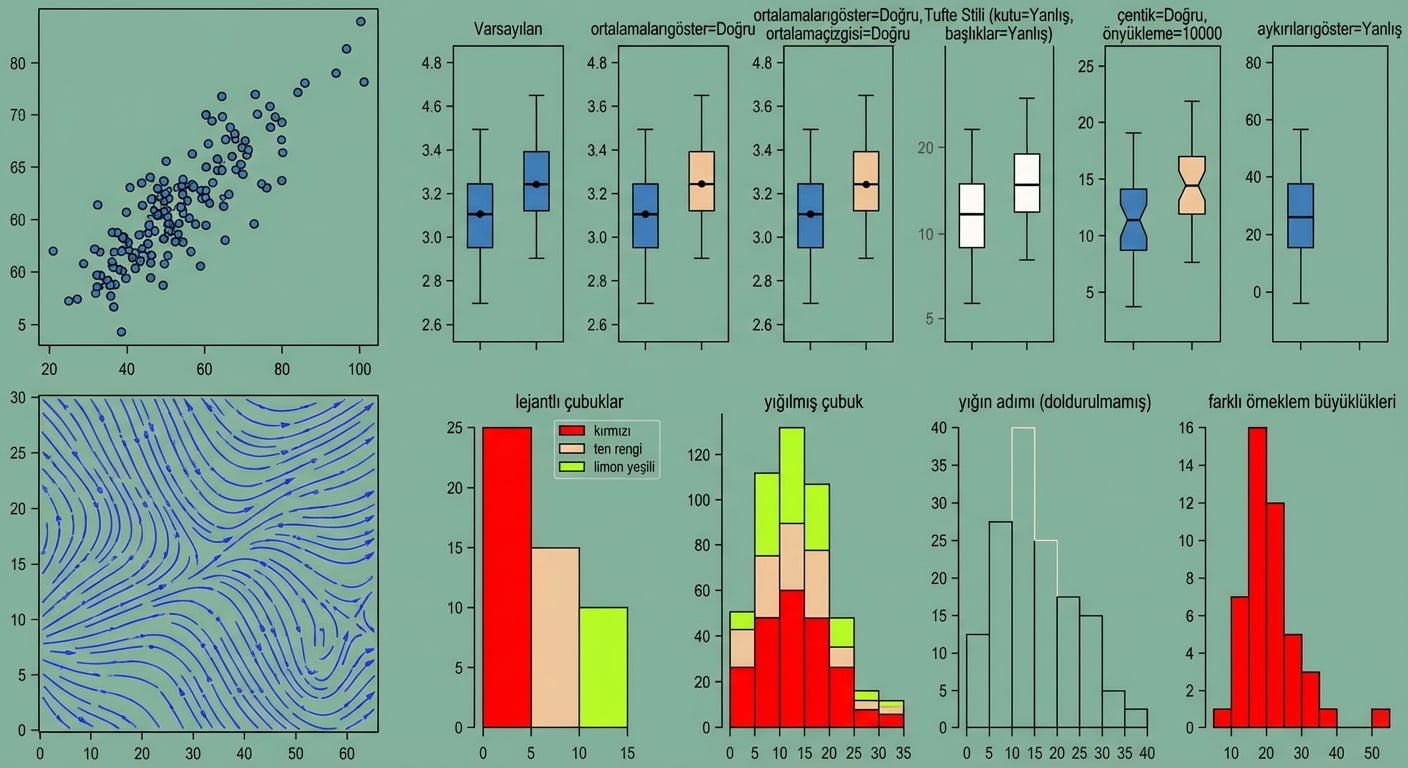
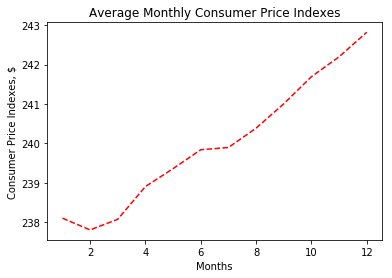
Grafik sonucu
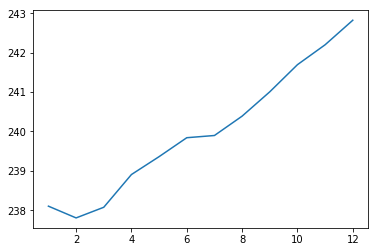
Grafik sonucu
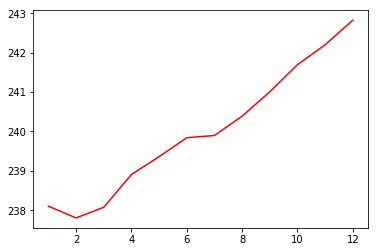
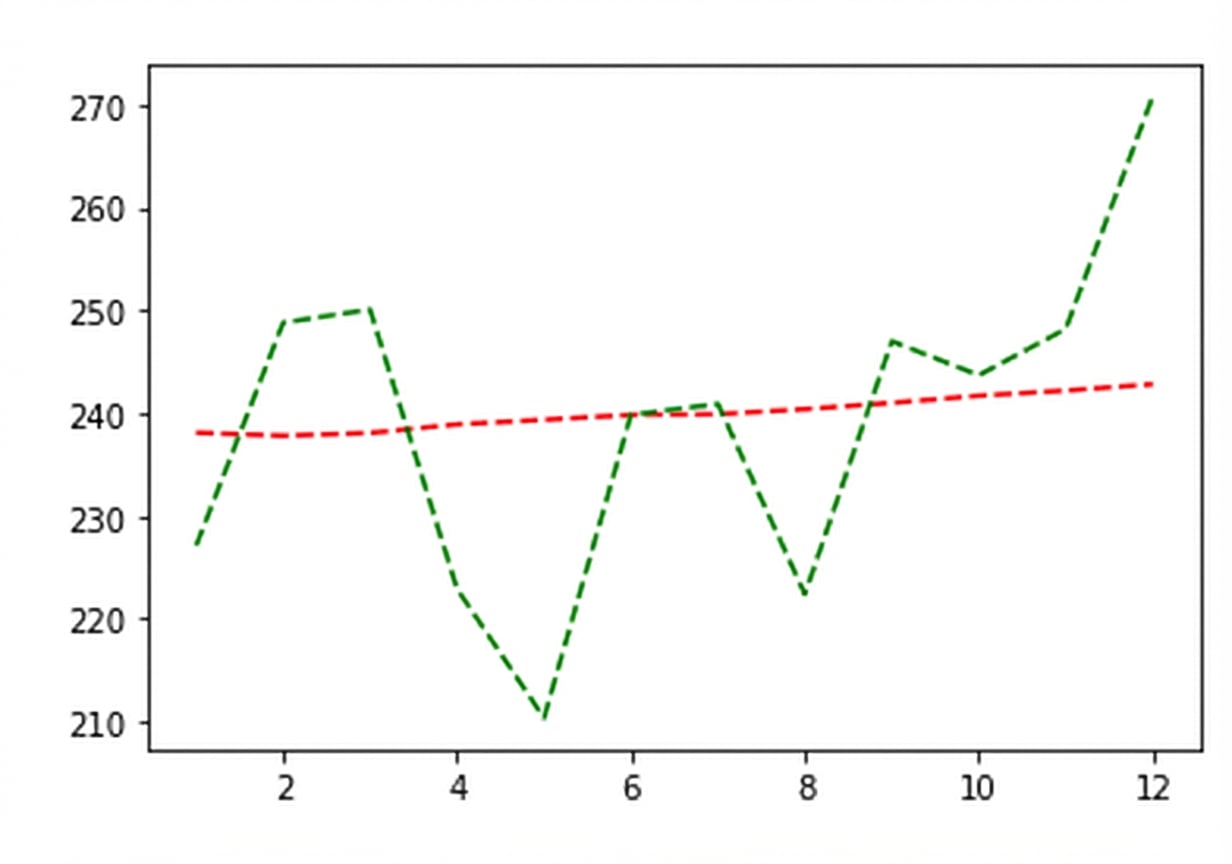
Grafik sonucu
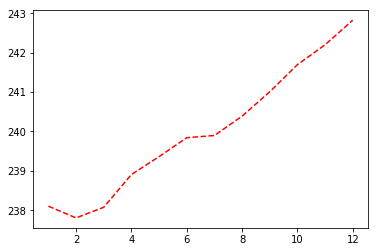
Grafik sonucu
Grafik sonucu
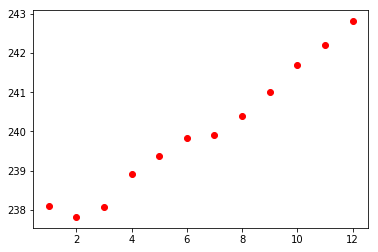
Saçılım grafiği sonucu
Finans için Python’a Giriş
Adina Howe
Professor
Matplotlib galerisine bu bağlantıdan bakın.

