R'da Regresyona Giriş
Richie Cotton
Data Evangelist at DataCamp
library(dplyr)
swedish_motor_insurance %>%
  summarize_all(mean)
# A tibble: 1 x 2
  n_claims total_payment_sek
     <dbl>             <dbl>
1     22.9              98.2
swedish_motor_insurance %>%
  summarize(
    correlation = cor(n_claims, total_payment_sek)
  )
# A tibble: 1 x 1
  correlation
        <dbl>
1       0.881
Tahmin etmek istediğiniz değişken.
Yanıt değişkeninin nasıl değişeceğini açıklayan değişkenler.
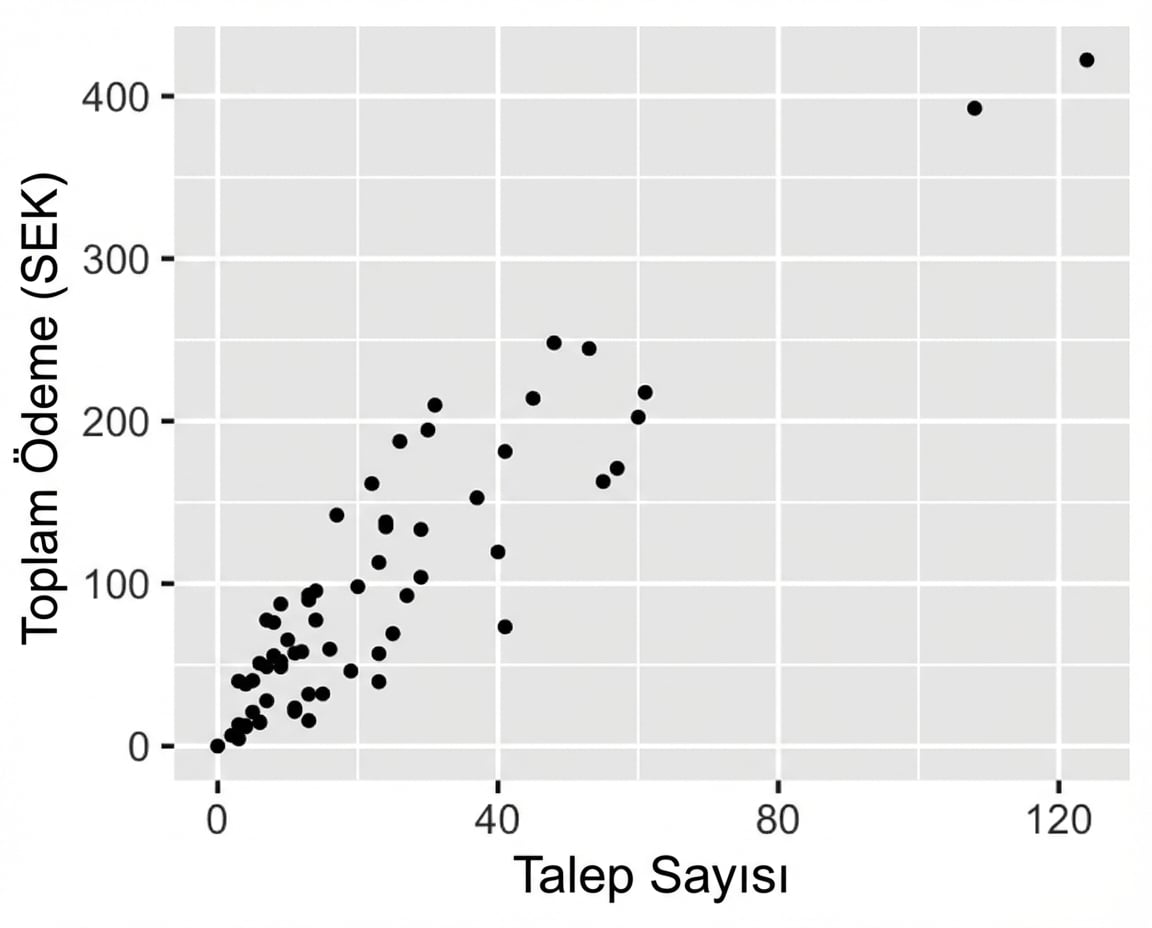
library(ggplot2)

ggplot(
  swedish_motor_insurance,
  aes(n_claims, total_payment_sek)
) +
  geom_point()
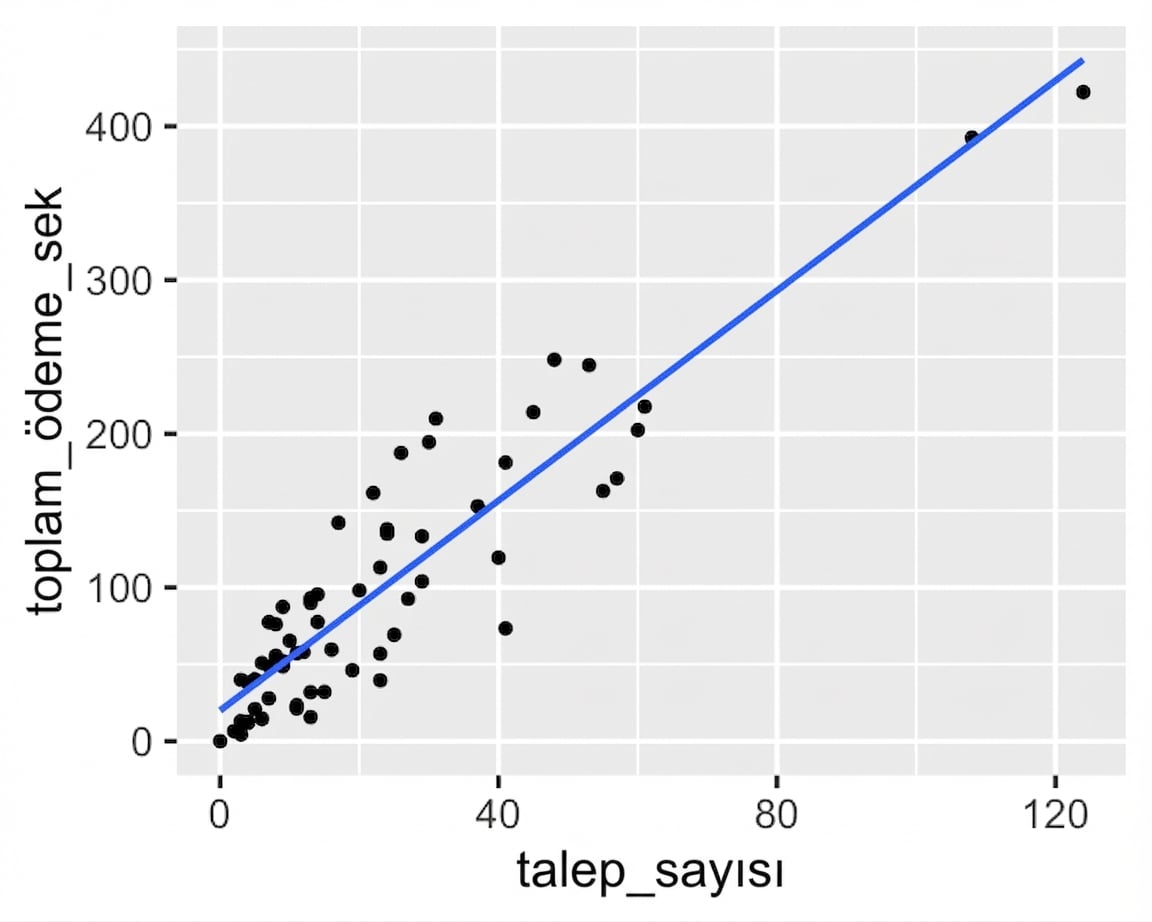
library(ggplot2)

ggplot(
  swedish_motor_insurance,
  aes(n_claims, total_payment_sek)
) +
  geom_point() +
  geom_smooth(
    method = "lm",
    se = FALSE
  )
Doğrusal regresyon modellerini görselleştirme ve uydurma.
Doğrusal regresyonla tahmin yapma ve katsayıları anlama.
Doğrusal regresyon modelinin kalitesini değerlendirme.
Aynısı, ancak lojistik regresyon ile.