İki değişkenin öyküsü
Python ile statsmodels kullanarak Regresyona Giriş

Maarten Van den Broeck
Content Developer at DataCamp
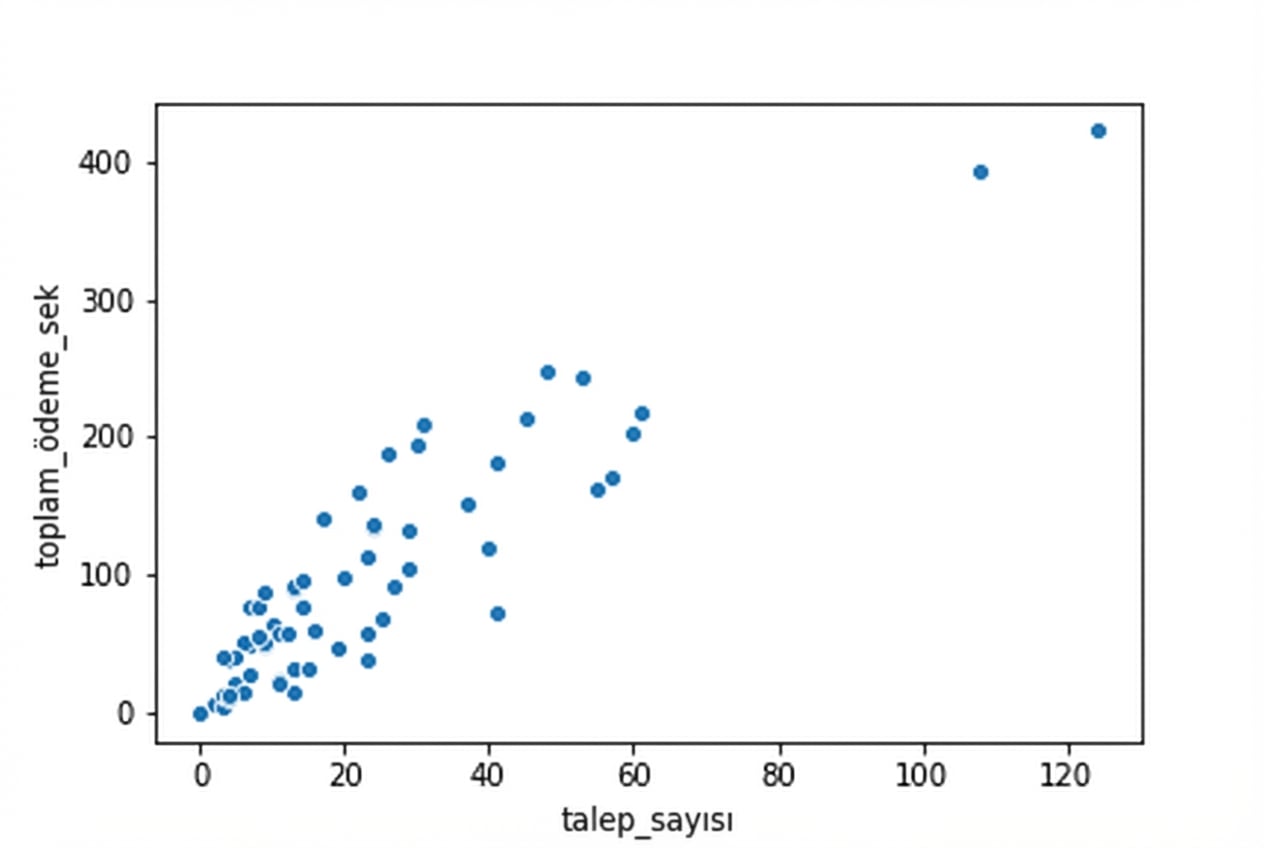
Değişken çiftlerini görselleştirme
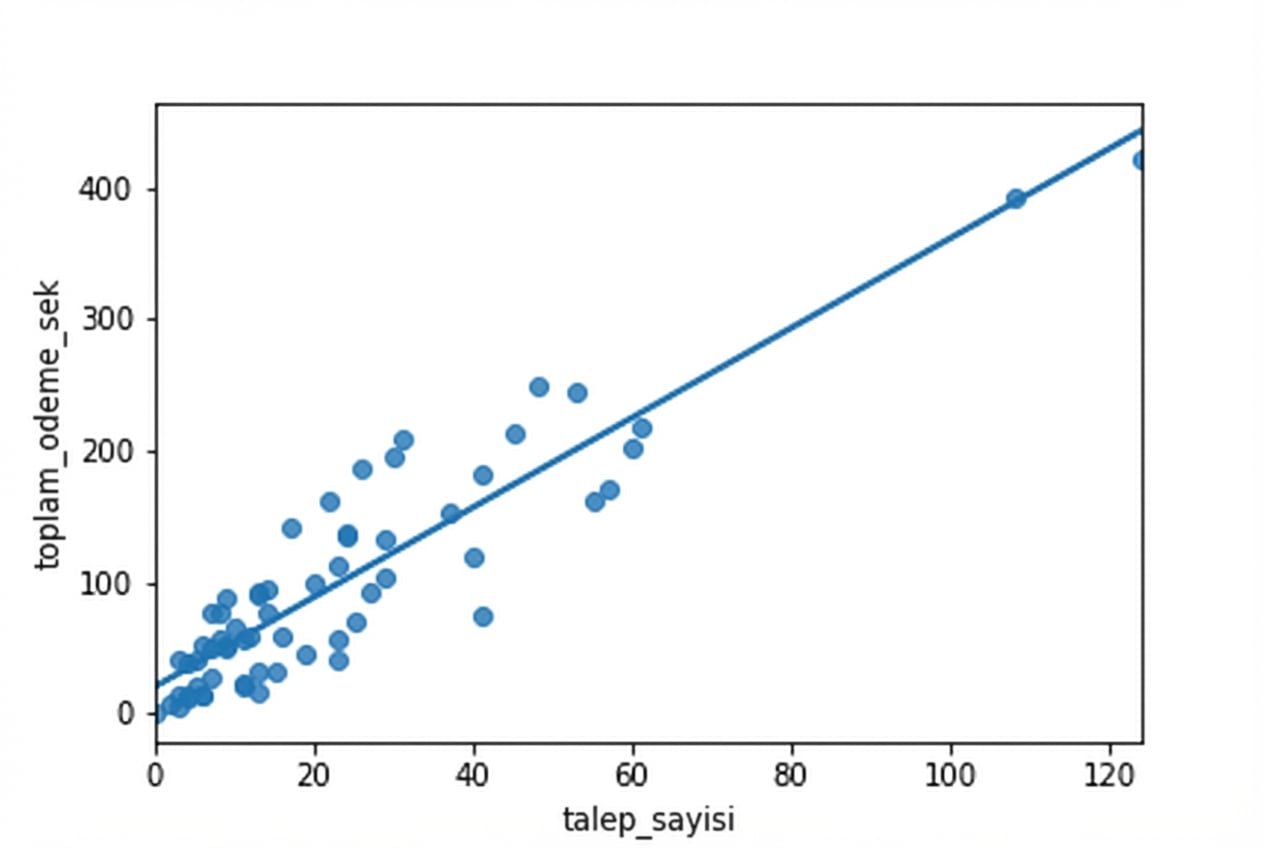
Doğrusal trend çizgisi ekleme
Python ile statsmodels kullanarak Regresyona Giriş
Maarten Van den Broeck
Content Developer at DataCamp

