Aykırı değerler, kaldıraç ve etki
Python ile statsmodels kullanarak Regresyona Giriş

Maarten Van den Broeck
Content Developer at DataCamp
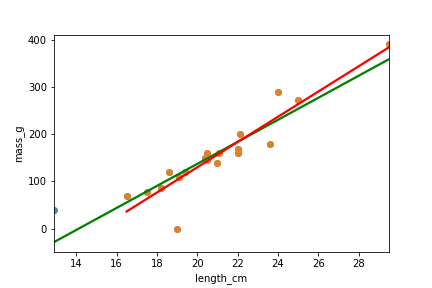
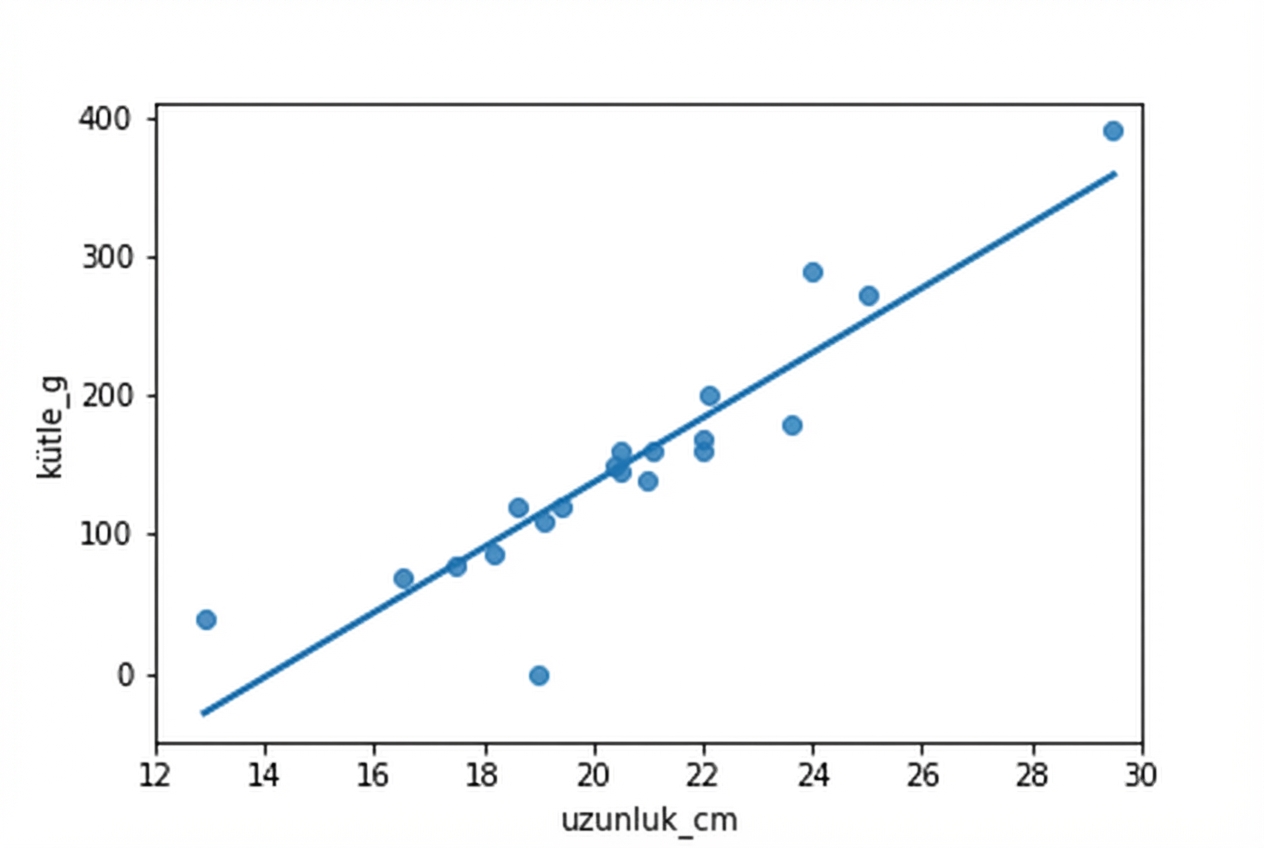
Hamamböceği veri kümesi

Hangi noktalar aykırı?
Uç açıklayıcı değerler
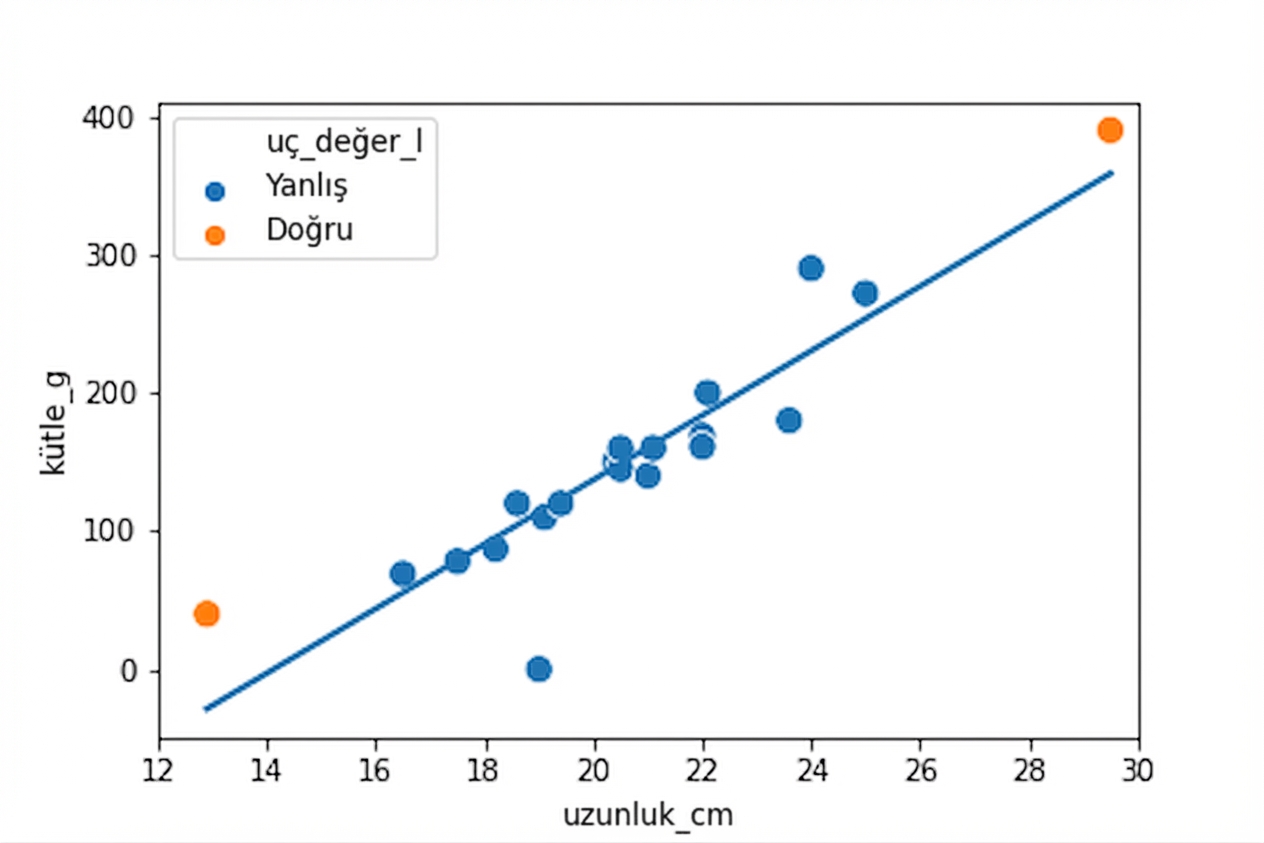
Regresyon çizgisinden uzak tepki değerleri
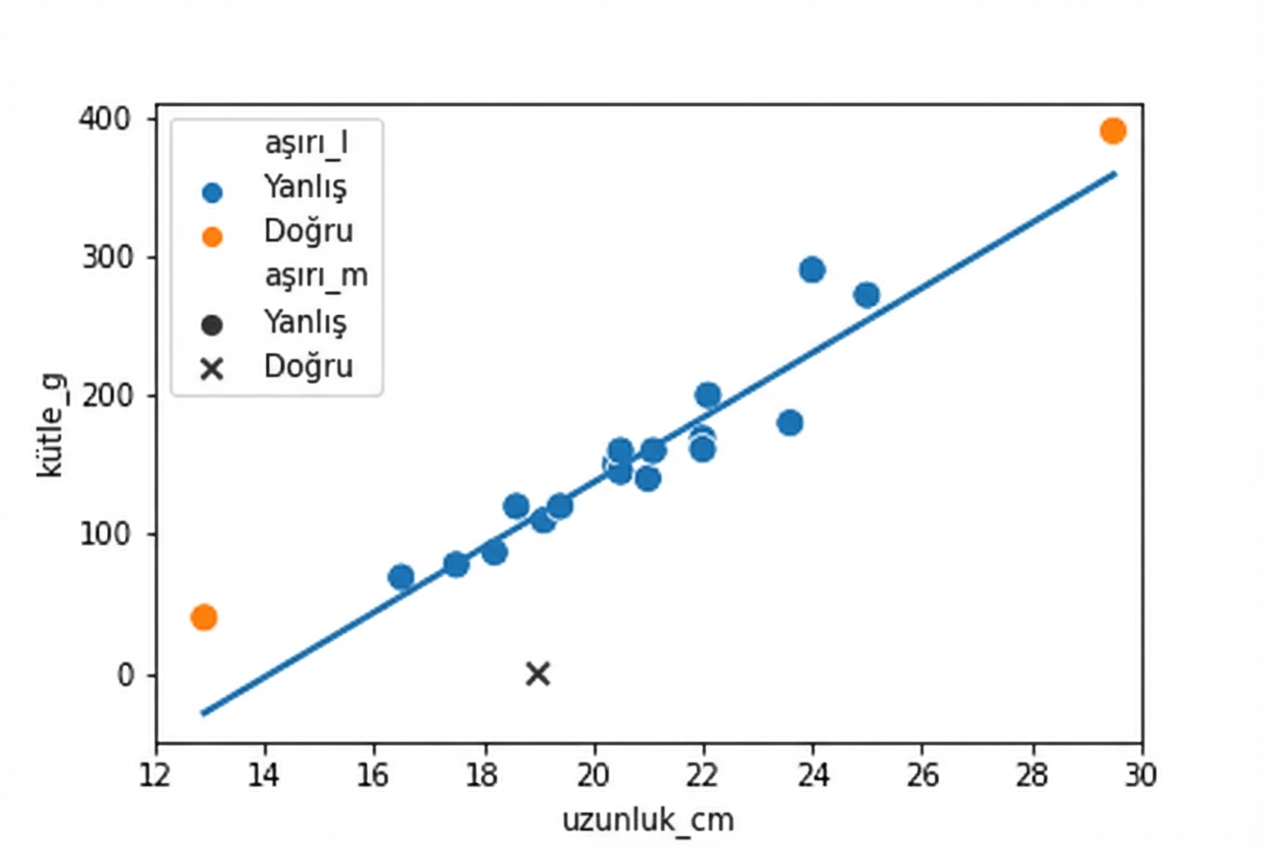
Kaldıraç ve etki
Kaldıraç, açıklayıcı değişken değerlerinin ne kadar uçta olduğunu ölçer.
Etki, modelleme sırasında gözlemi veri setinden çıkarsanız modelin ne kadar değişeceğini ölçer.

En etkili hamamböceğini kaldırma