Yeniden örnekleme (bootstrapping) giriş
Python'da Örnekleme

James Chapman
Curriculum Manager, DataCamp
Yerine koyarak ya da koymadan
Yerine koymadan örnekleme:

Yerine koyarak örnekleme ("yeniden örnekleme"):

Yerine koymadan basit rastgele örnekleme
Evren:

Örneklem:

Yerine koyarak basit rastgele örnekleme
Evren:
Yeniden örnek:

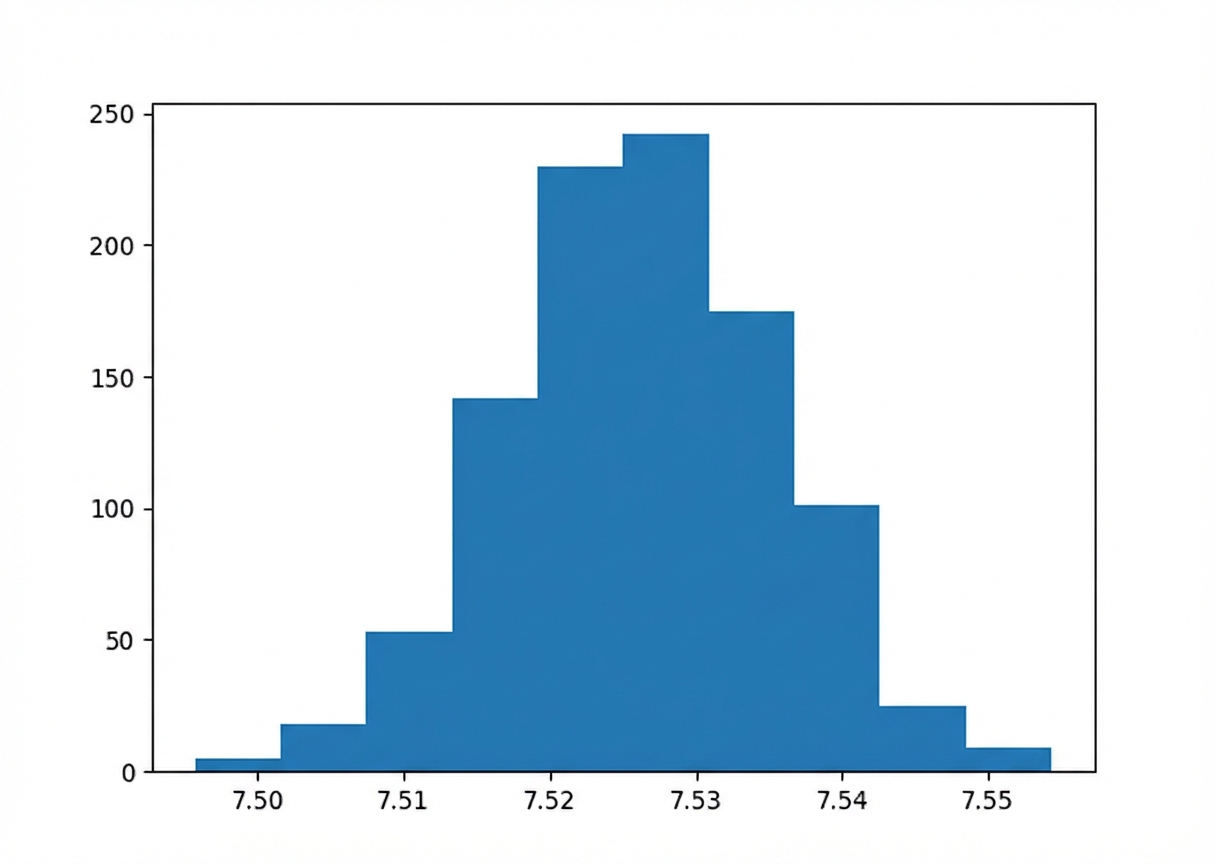
Bootstrapping
Bootstrap dağılımı histogramı