Eşleştirilmiş t-testleri
Python'da Hipotez Testi

James Chapman
Curriculum Manager, DataCamp
ABD Cumhuriyetçi başkan oyları veri seti
         state       county  repub_percent_08  repub_percent_12
0      Alabama         Hale         38.957877         37.139882
1     Arkansas       Nevada         56.726272         58.983452
2   California         Lake         38.896719         39.331367
3   California      Ventura         42.923190         45.250693
..         ...          ...               ...               ...
96   Wisconsin    La Crosse         37.490904         40.577038
97   Wisconsin    Lafayette         38.104967         41.675050
98     Wyoming       Weston         76.684241         83.983328
99      Alaska  District 34         77.063259         40.789626

[100 rows x 4 columns]
100 satır; her satır bir başkanlık seçiminde ilçe düzeyindeki oyları gösterir.
1 https://dataverse.harvard.edu/dataset.xhtml?persistentId=doi:10.7910/DVN/VOQCHQ
Hipotezler
Soru: Cumhuriyetçi aday oy yüzdesi 2008’de 2012’den daha düşük müydü?
$H_{0}$: $\mu_{2008} - \mu_{2012} = 0$
$H_{A}$: $\mu_{2008} - \mu_{2012} < 0$
$\alpha = 0.05$ anlamlılık düzeyi.
- Veri eşleştirilmiş → her oy yüzdesi aynı ilçeye ait
- Oylama örüntülerini modelde yakalamak istiyoruz
İki örnekten tek örneğe
sample_data = repub_votes_potus_08_12
sample_data['diff'] = sample_data['repub_percent_08'] - sample_data['repub_percent_12']
import matplotlib.pyplot as plt
sample_data['diff'].hist(bins=20)
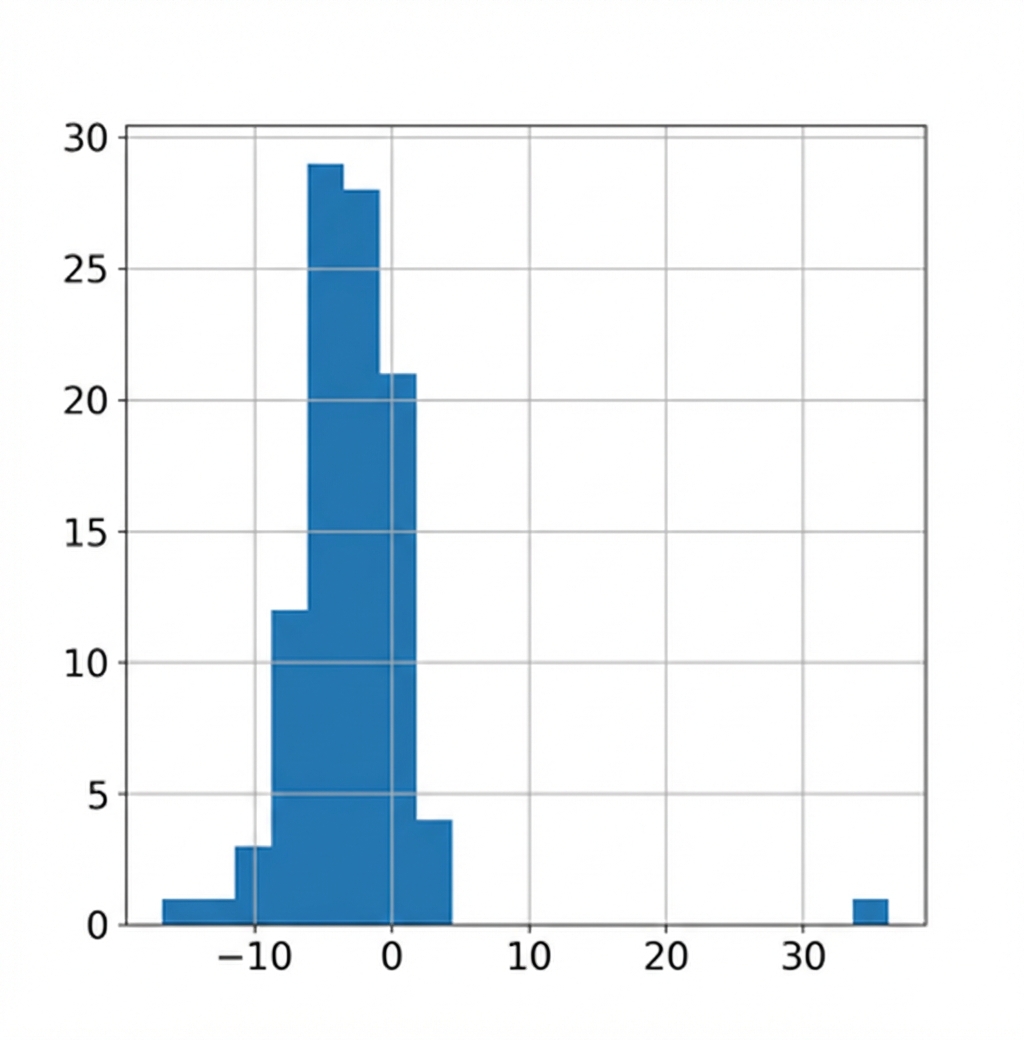
Farkın örnek istatistiklerini hesapla
xbar_diff = sample_data['diff'].mean()
-2.877109041242944
Gözden geçirilmiş hipotezler
Eski hipotezler:
$H_{0}$: $\mu_{2008} - \mu_{2012} = 0$
$H_{A}$: $\mu_{2008} - \mu_{2012} < 0$
Yeni hipotezler:
$H_{0}$: $\mu_{\text{diff}} = 0$
$H_{A}$: $ \mu_{\text{diff}} < 0$
$t = \dfrac{\bar{x}_{\text{diff}} - \mu_{\text{diff}}}{\sqrt{\dfrac{s_{diff}^2}{n_{\text{diff}}}}}$
$df = n_{diff} - 1$
p-değerinin hesaplanması
n_diff = len(sample_data)
100
s_diff = sample_data['diff'].std()
t_stat = (xbar_diff-0) / np.sqrt(s_diff**2/n_diff)
-5.601043121928489
degrees_of_freedom = n_diff - 1
99
$t = \dfrac{\bar{x}_{\text{diff}} - \mu_{\text{diff}}}{\sqrt{\dfrac{s_{\text{diff}}^2}{n_{\text{diff}}}}}$
$df = n_{\text{diff}} - 1$
from scipy.stats import t
p_value = t.cdf(t_stat, df=n_diff-1)
9.572537285272411e-08
ttest() ile iki ortalama farkını test etme
import pingouinpingouin.ttest(x=sample_data['diff'],y=0,alternative="less")
               T  dof alternative         p-val          CI95%   cohen-d  \
T-test -5.601043   99        less  9.572537e-08  [-inf, -2.02]  0.560104

             BF10  power
T-test  1.323e+05    1.0
1 pingouin.ttest() dönüşleri hakkında ayrıntılar için pingouin API belgelerine bakın: https://pingouin-stats.org/generated/pingouin.ttest.html#pingouin.ttest.
paired=True ile ttest()
pingouin.ttest(x=sample_data['repub_percent_08'],
               y=sample_data['repub_percent_12'],
               paired=True,
               alternative="less")
               T  dof alternative         p-val          CI95%   cohen-d  \
T-test -5.601043   99        less  9.572537e-08  [-inf, -2.02]  0.217364

             BF10     power
T-test  1.323e+05  0.696338
Eşleşmemiş ttest()
pingouin.ttest(x=sample_data['repub_percent_08'],
               y=sample_data['repub_percent_12'],
               paired=False, # Varsayılan
               alternative="less")
               T  dof alternative     p-val         CI95%   cohen-d   BF10  \
T-test -1.536997  198        less  0.062945  [-inf, 0.22]  0.217364  0.927

           power
T-test  0.454972
- Eşleştirilmiş veride eşleşmemiş t-testi, yanlış negatif olasılığını artırır
Ayo berlatih!
Python'da Hipotez Testi

