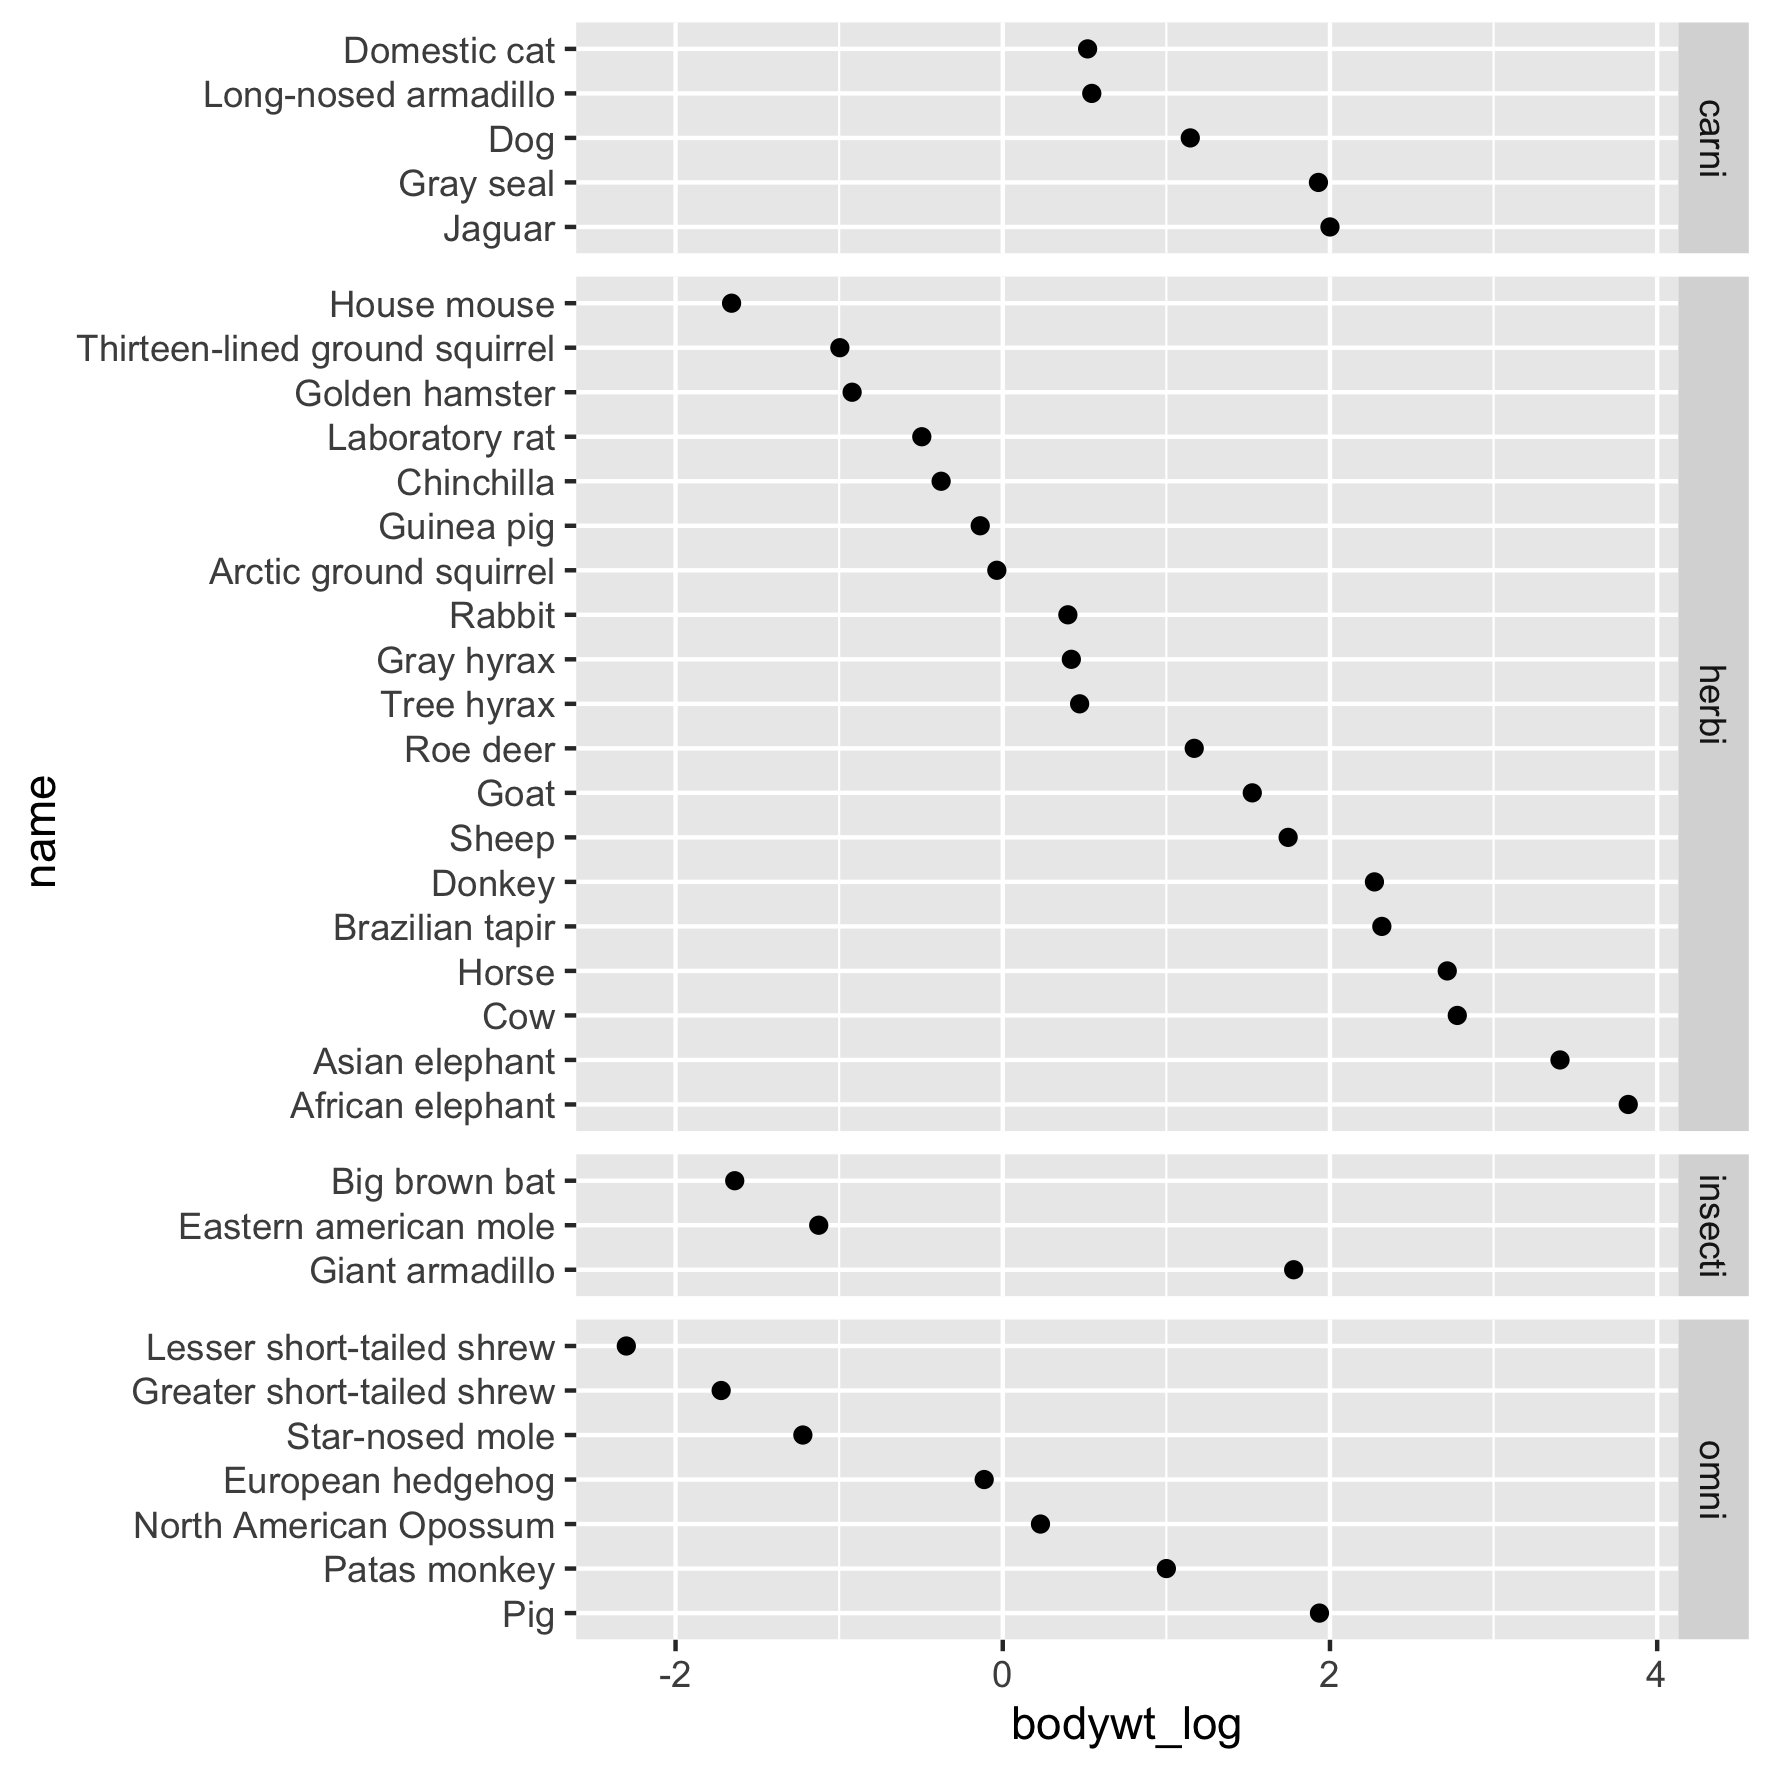
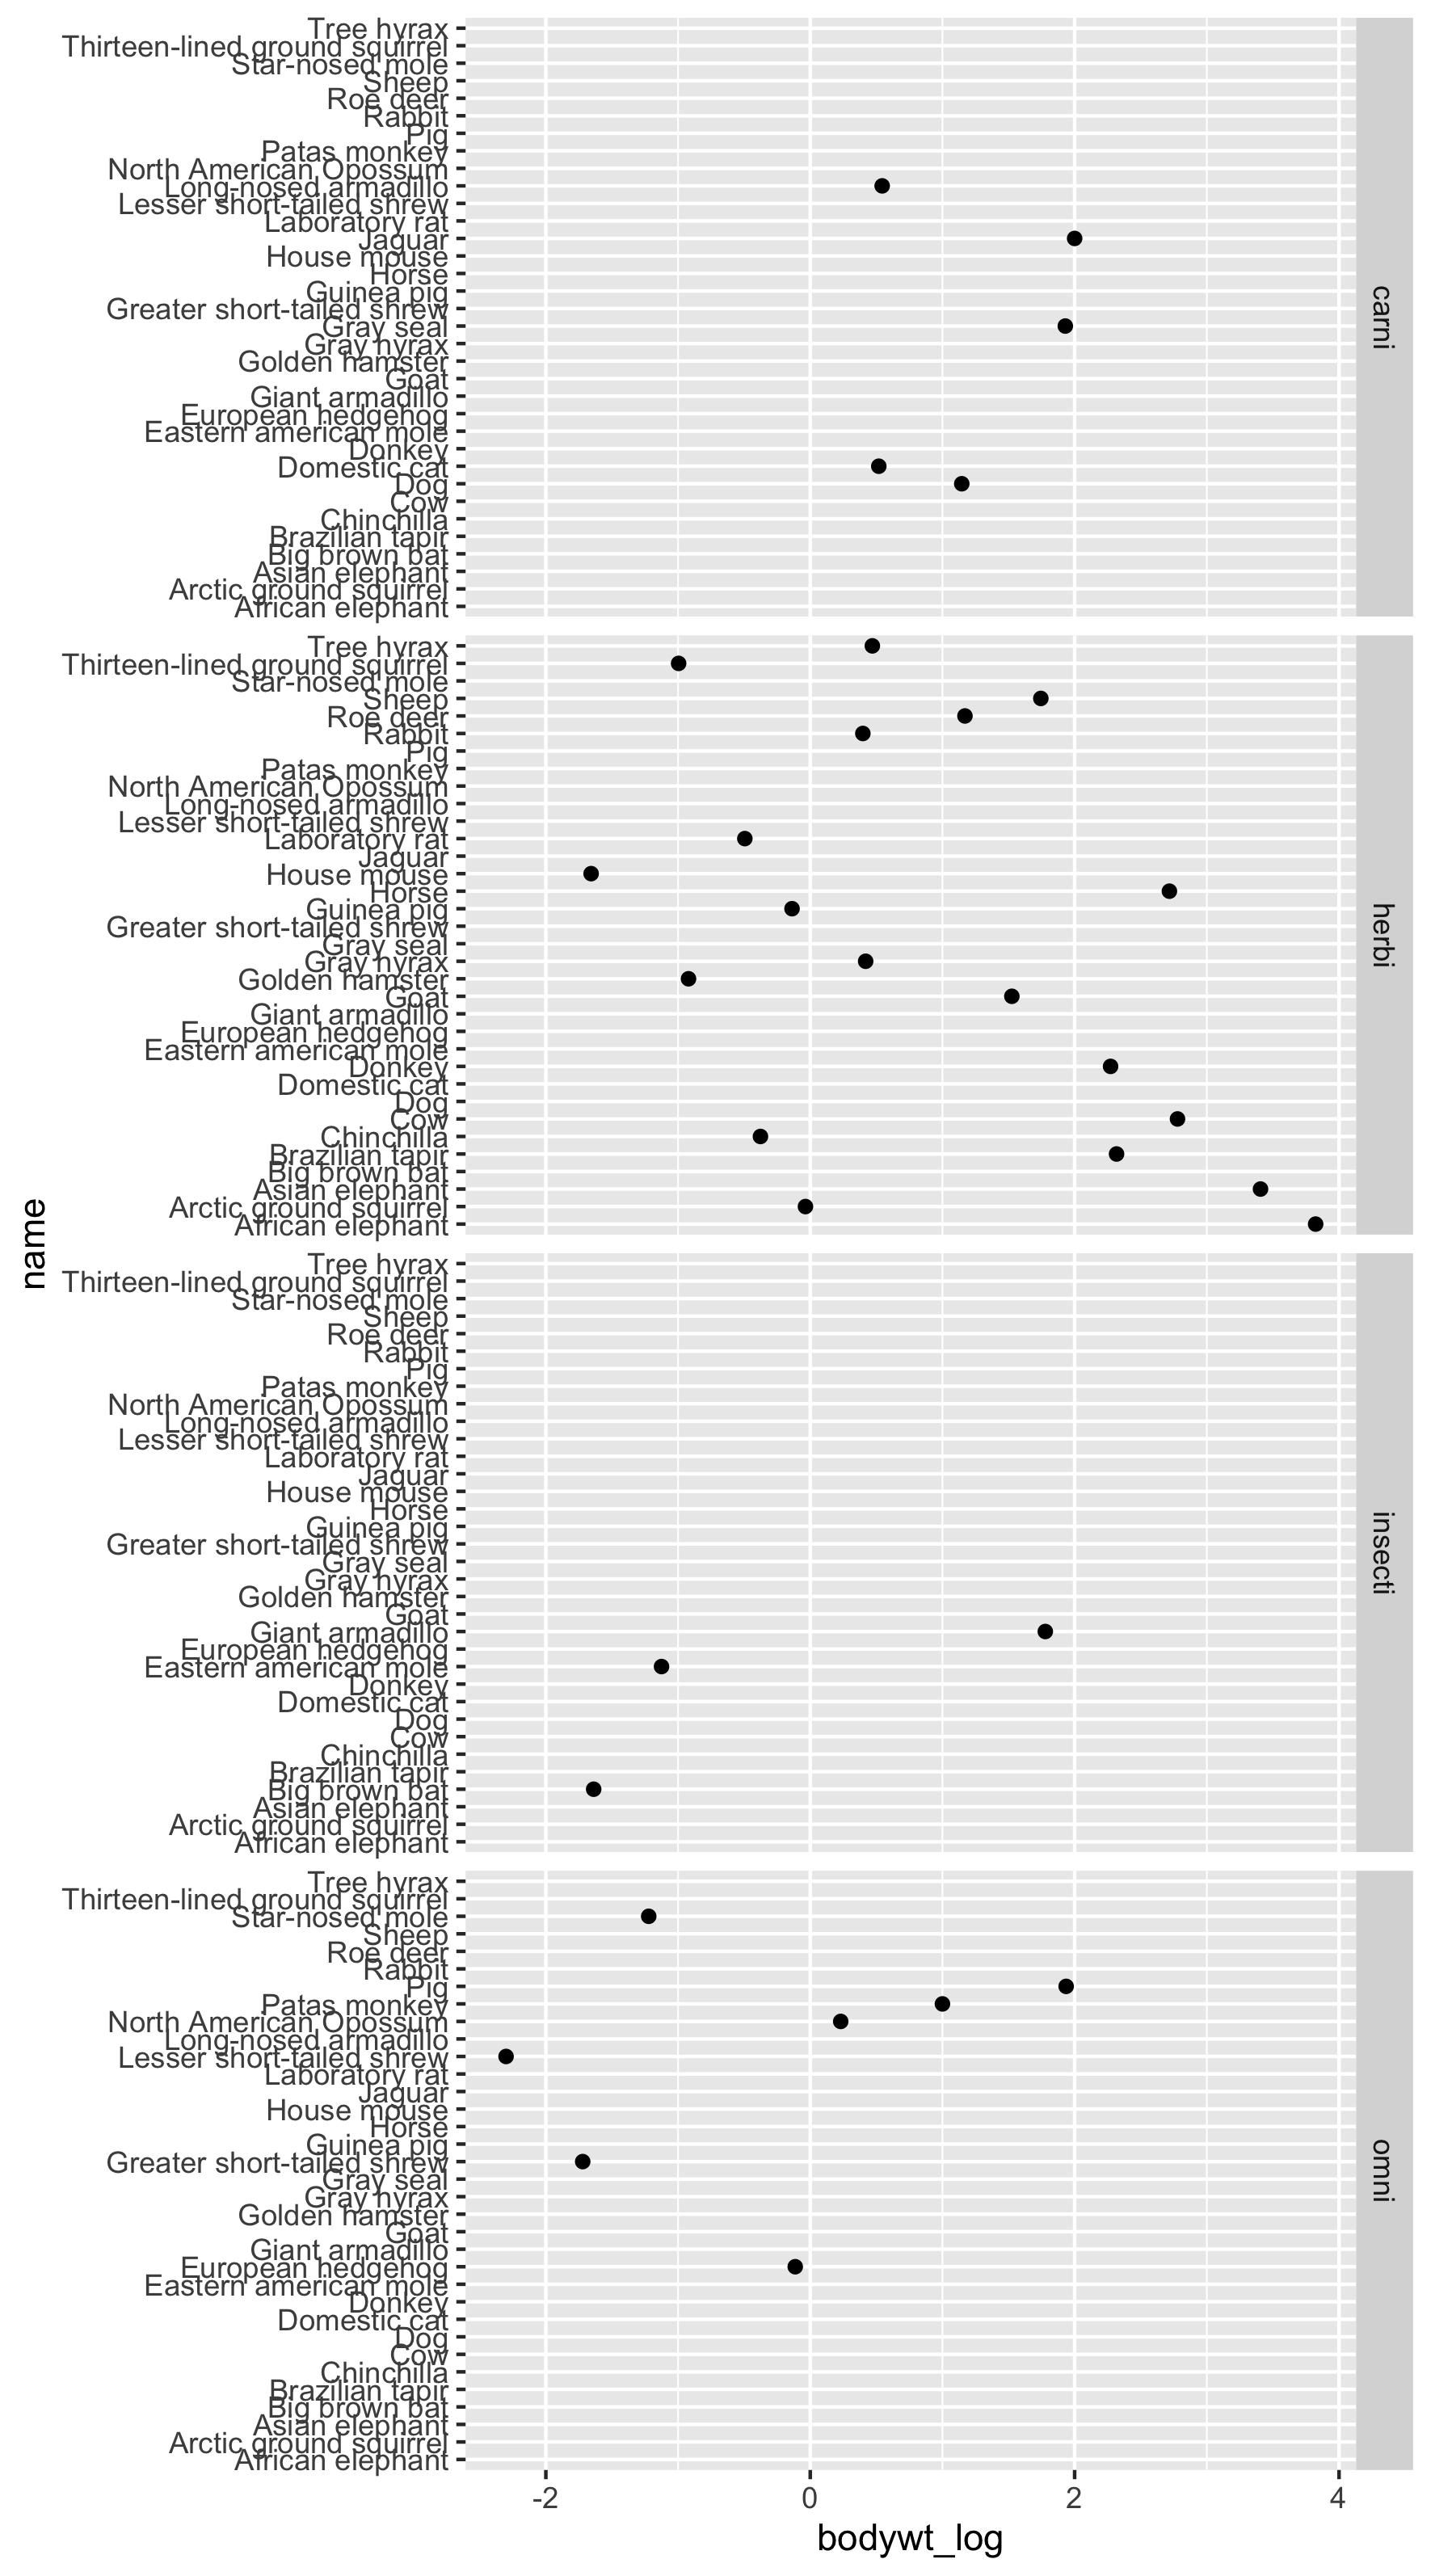
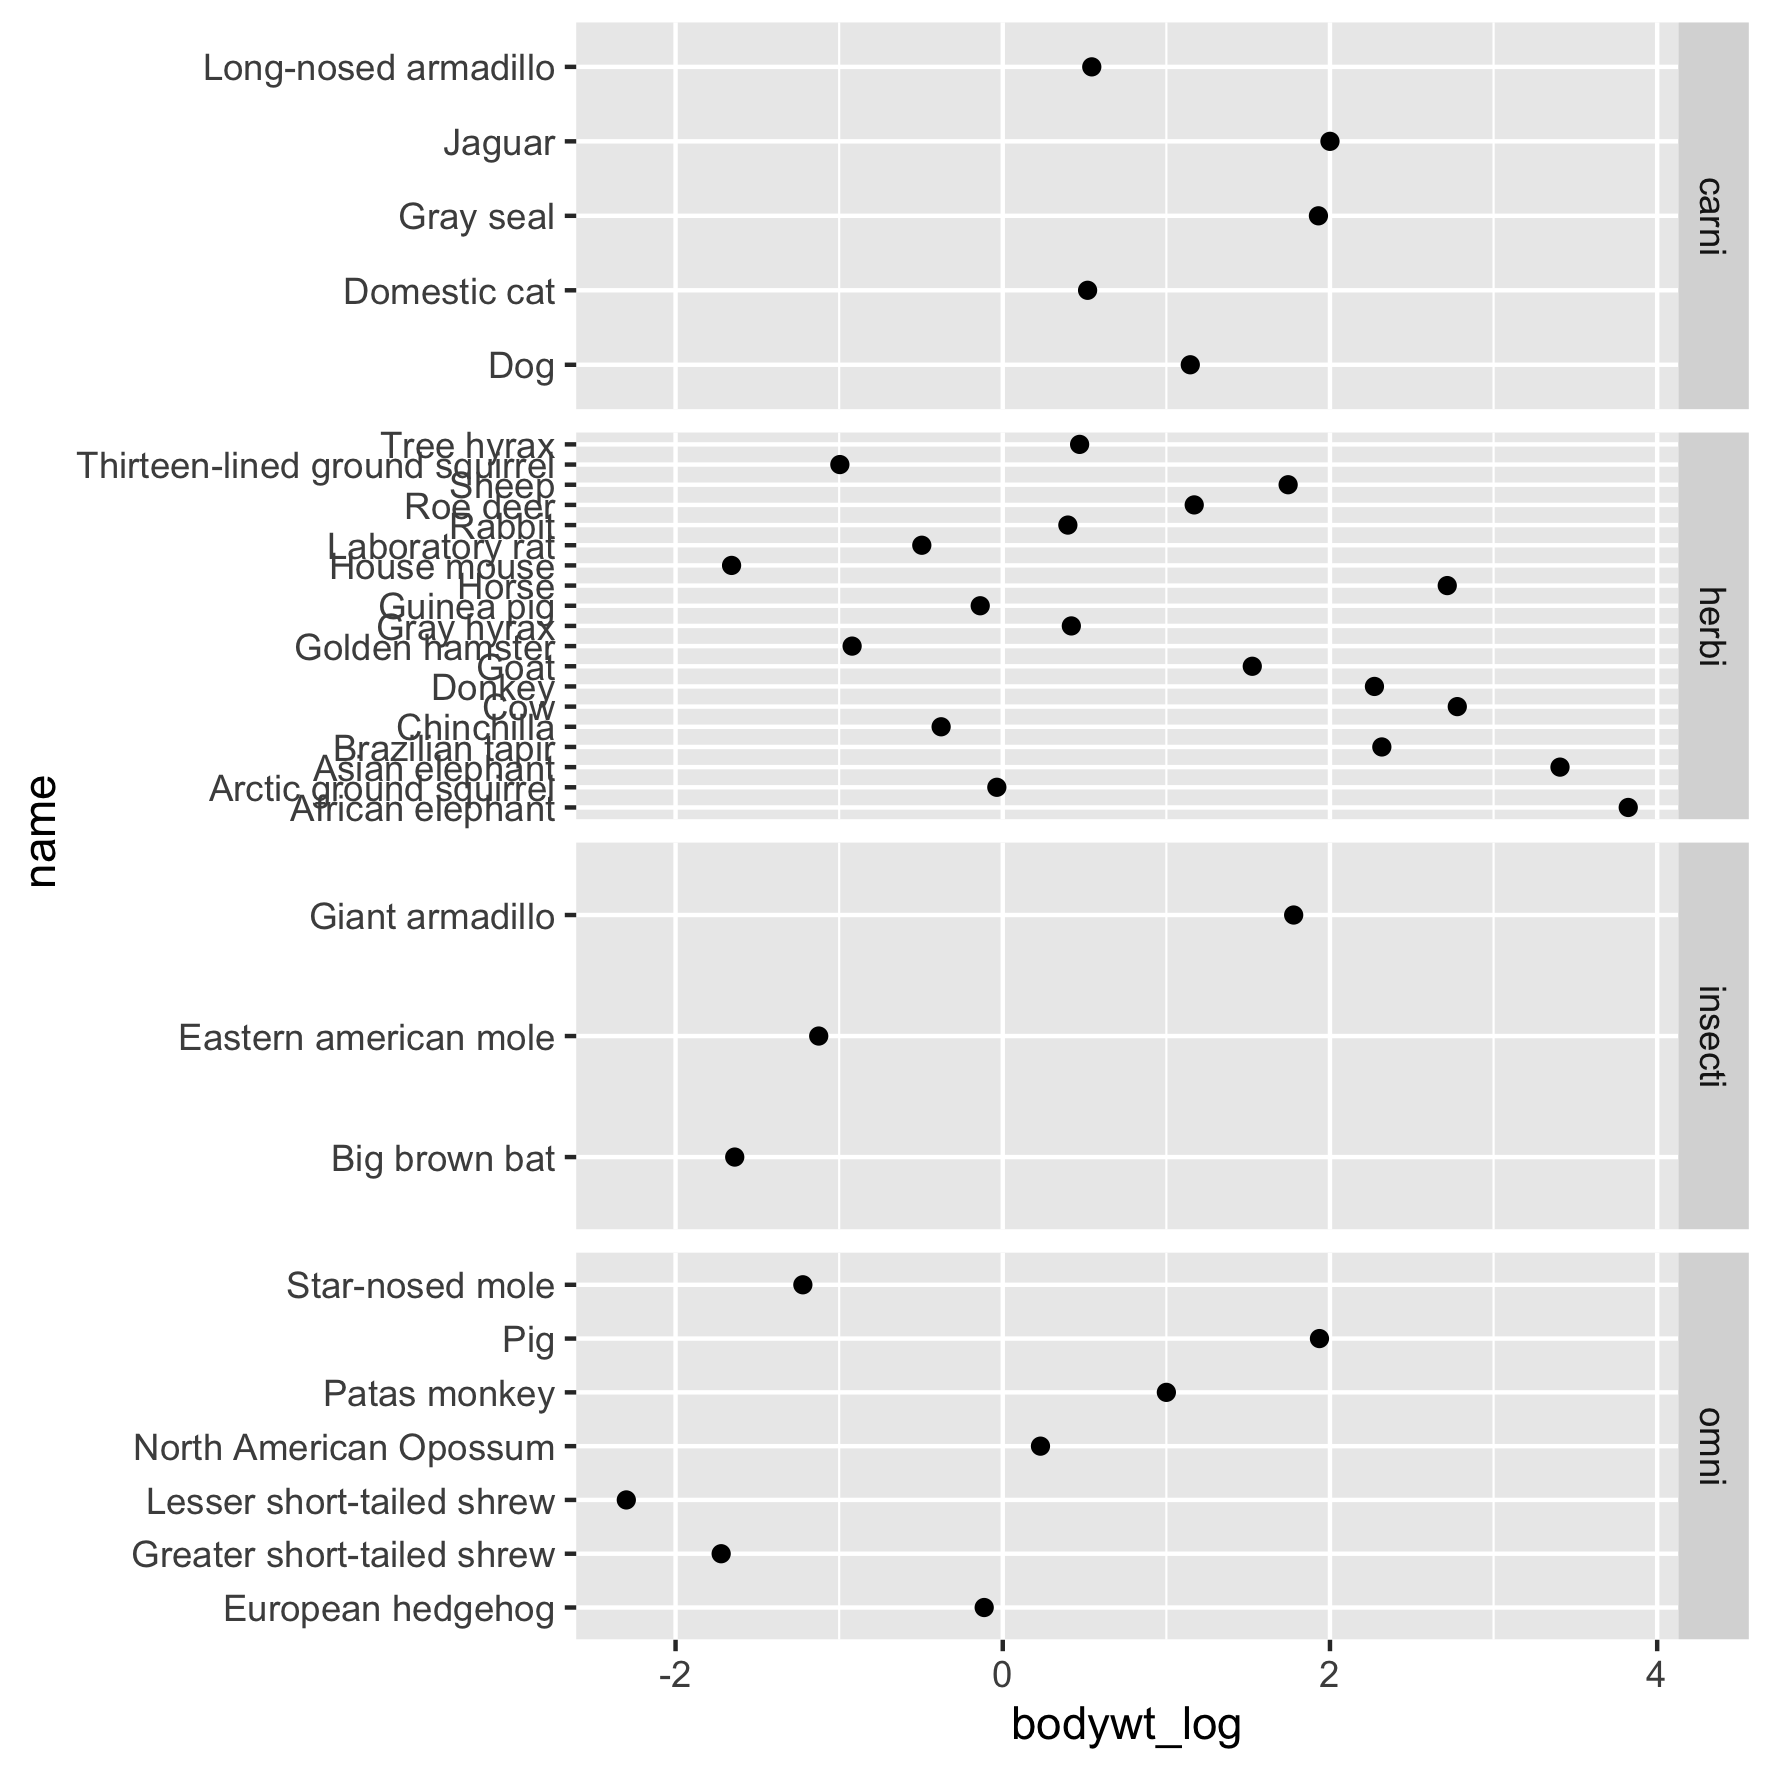
Faset çizim alanları
ggplot2 ile Orta Düzey Veri Görselleştirme

Rick Scavetta
Founder, Scavetta Academy
Çizim alanını ayarlama...
Çizim alanını ayarlama
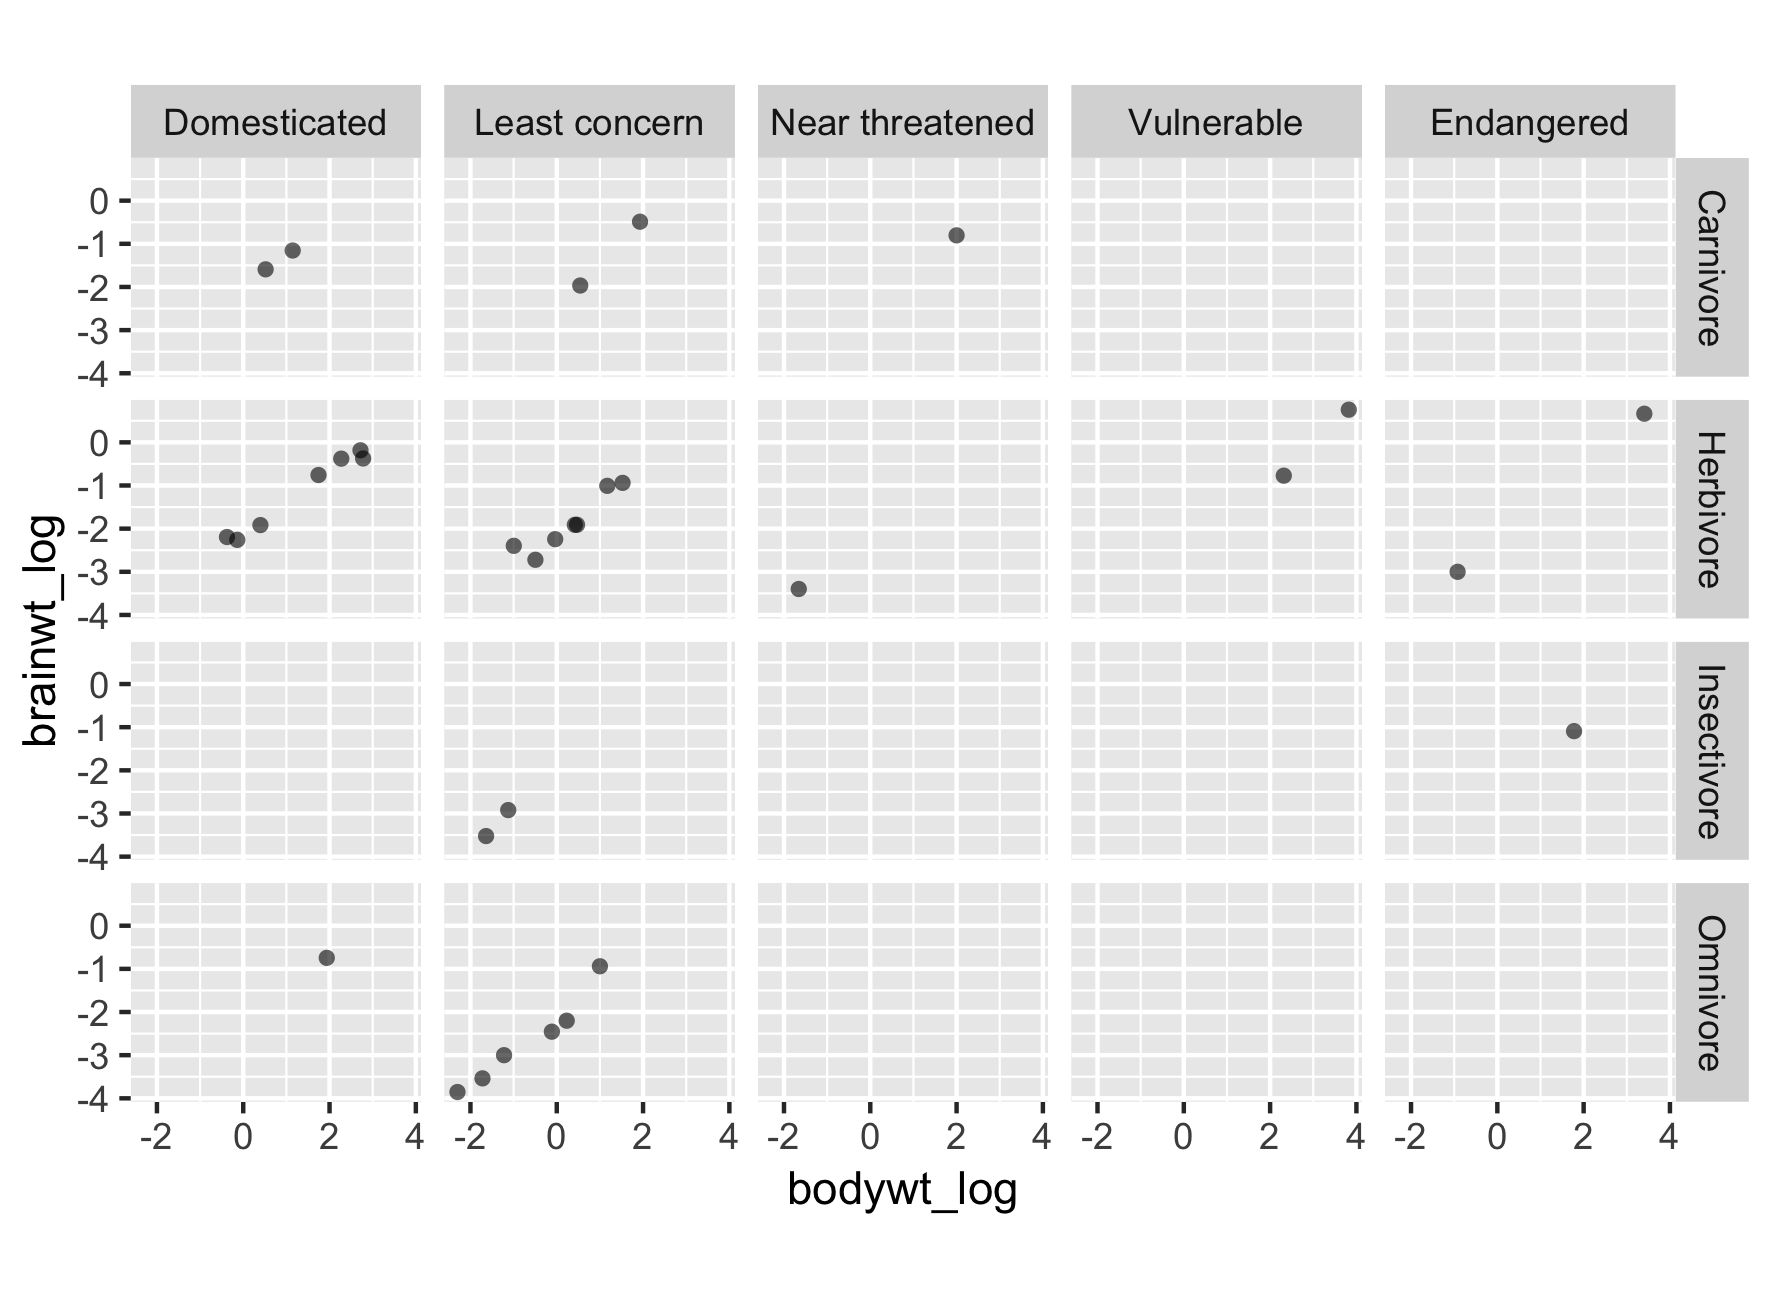
Çizim alanını ayarlama

Çizim alanını ayarlama
Çizim alanını ayarlama
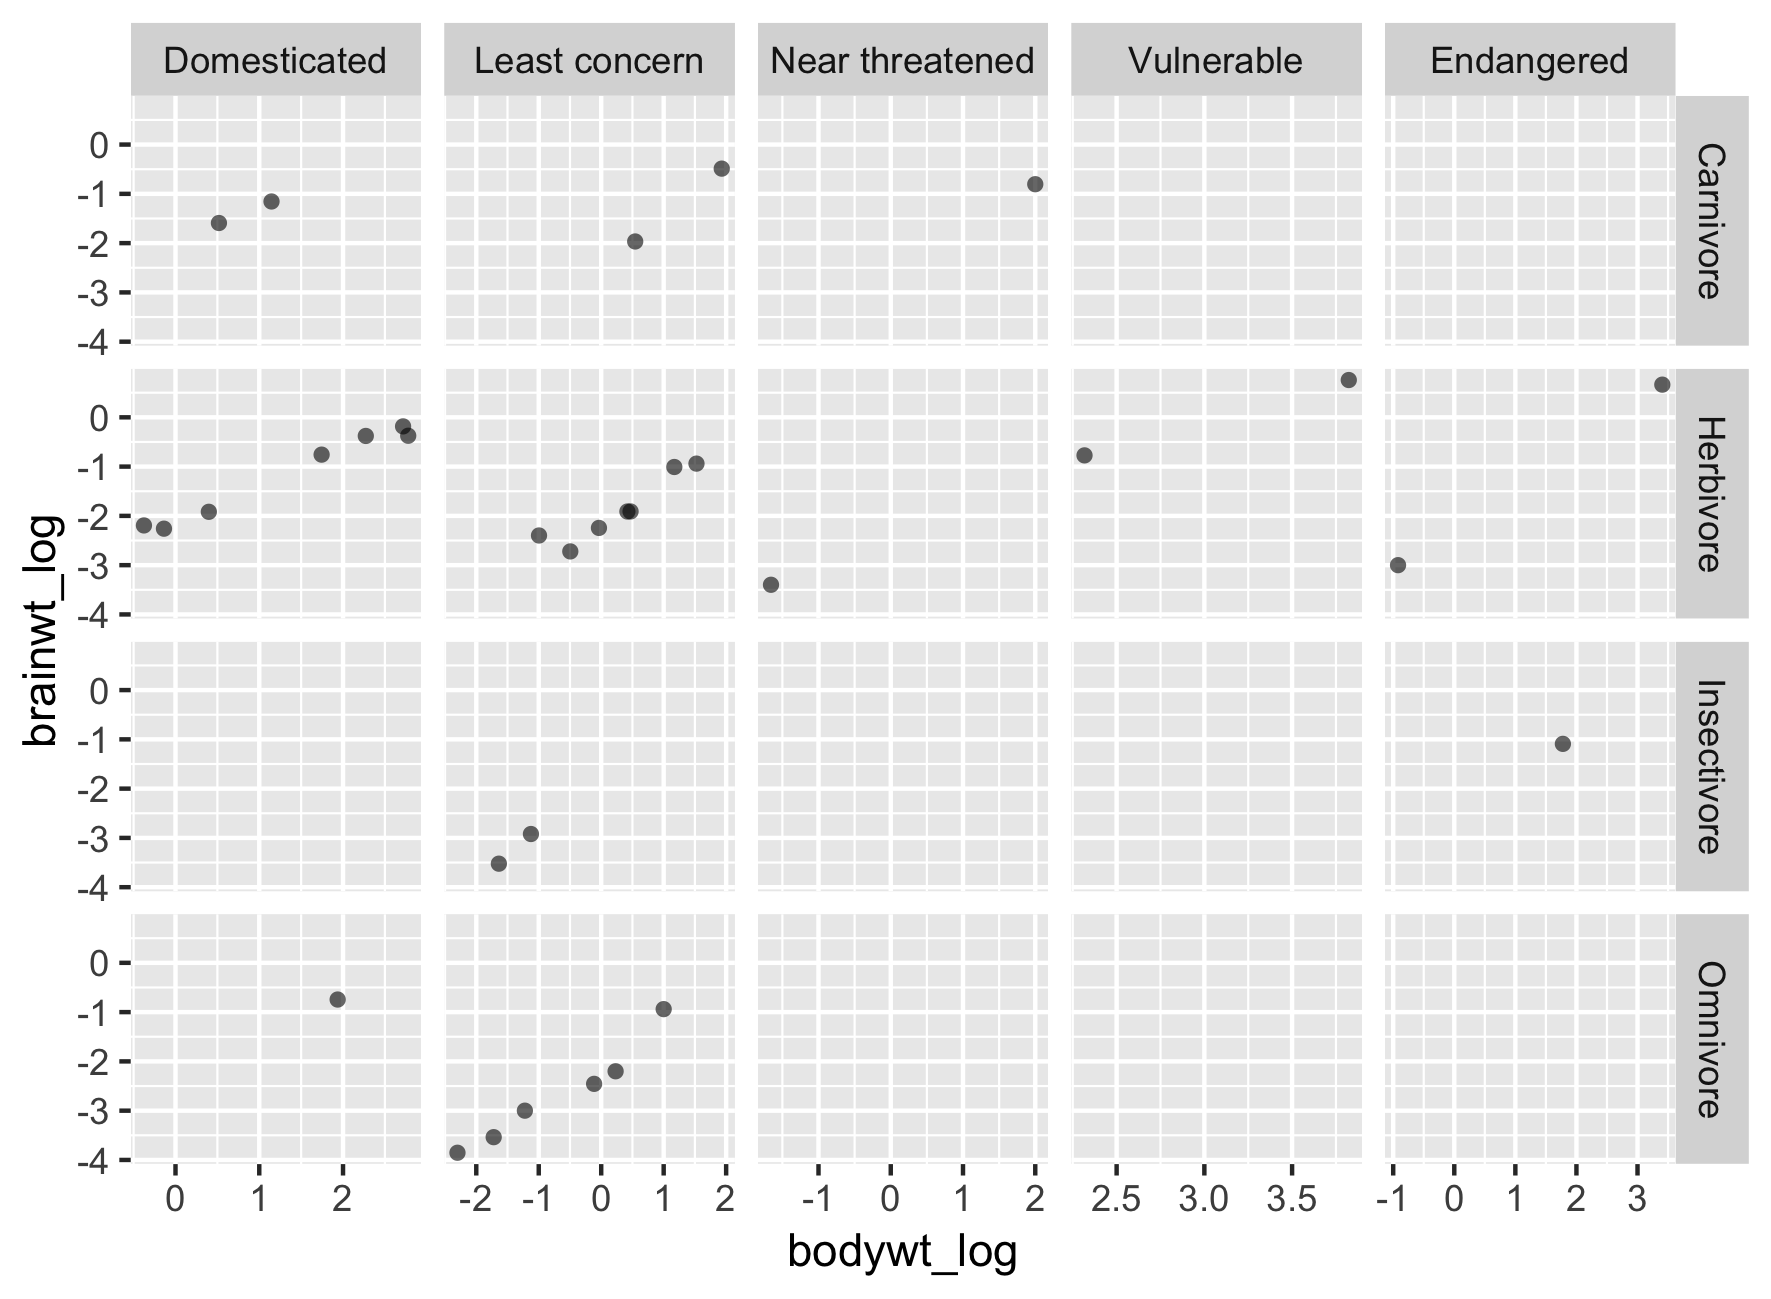
Çizim alanını ayarlama
Çizim alanını ayarlama
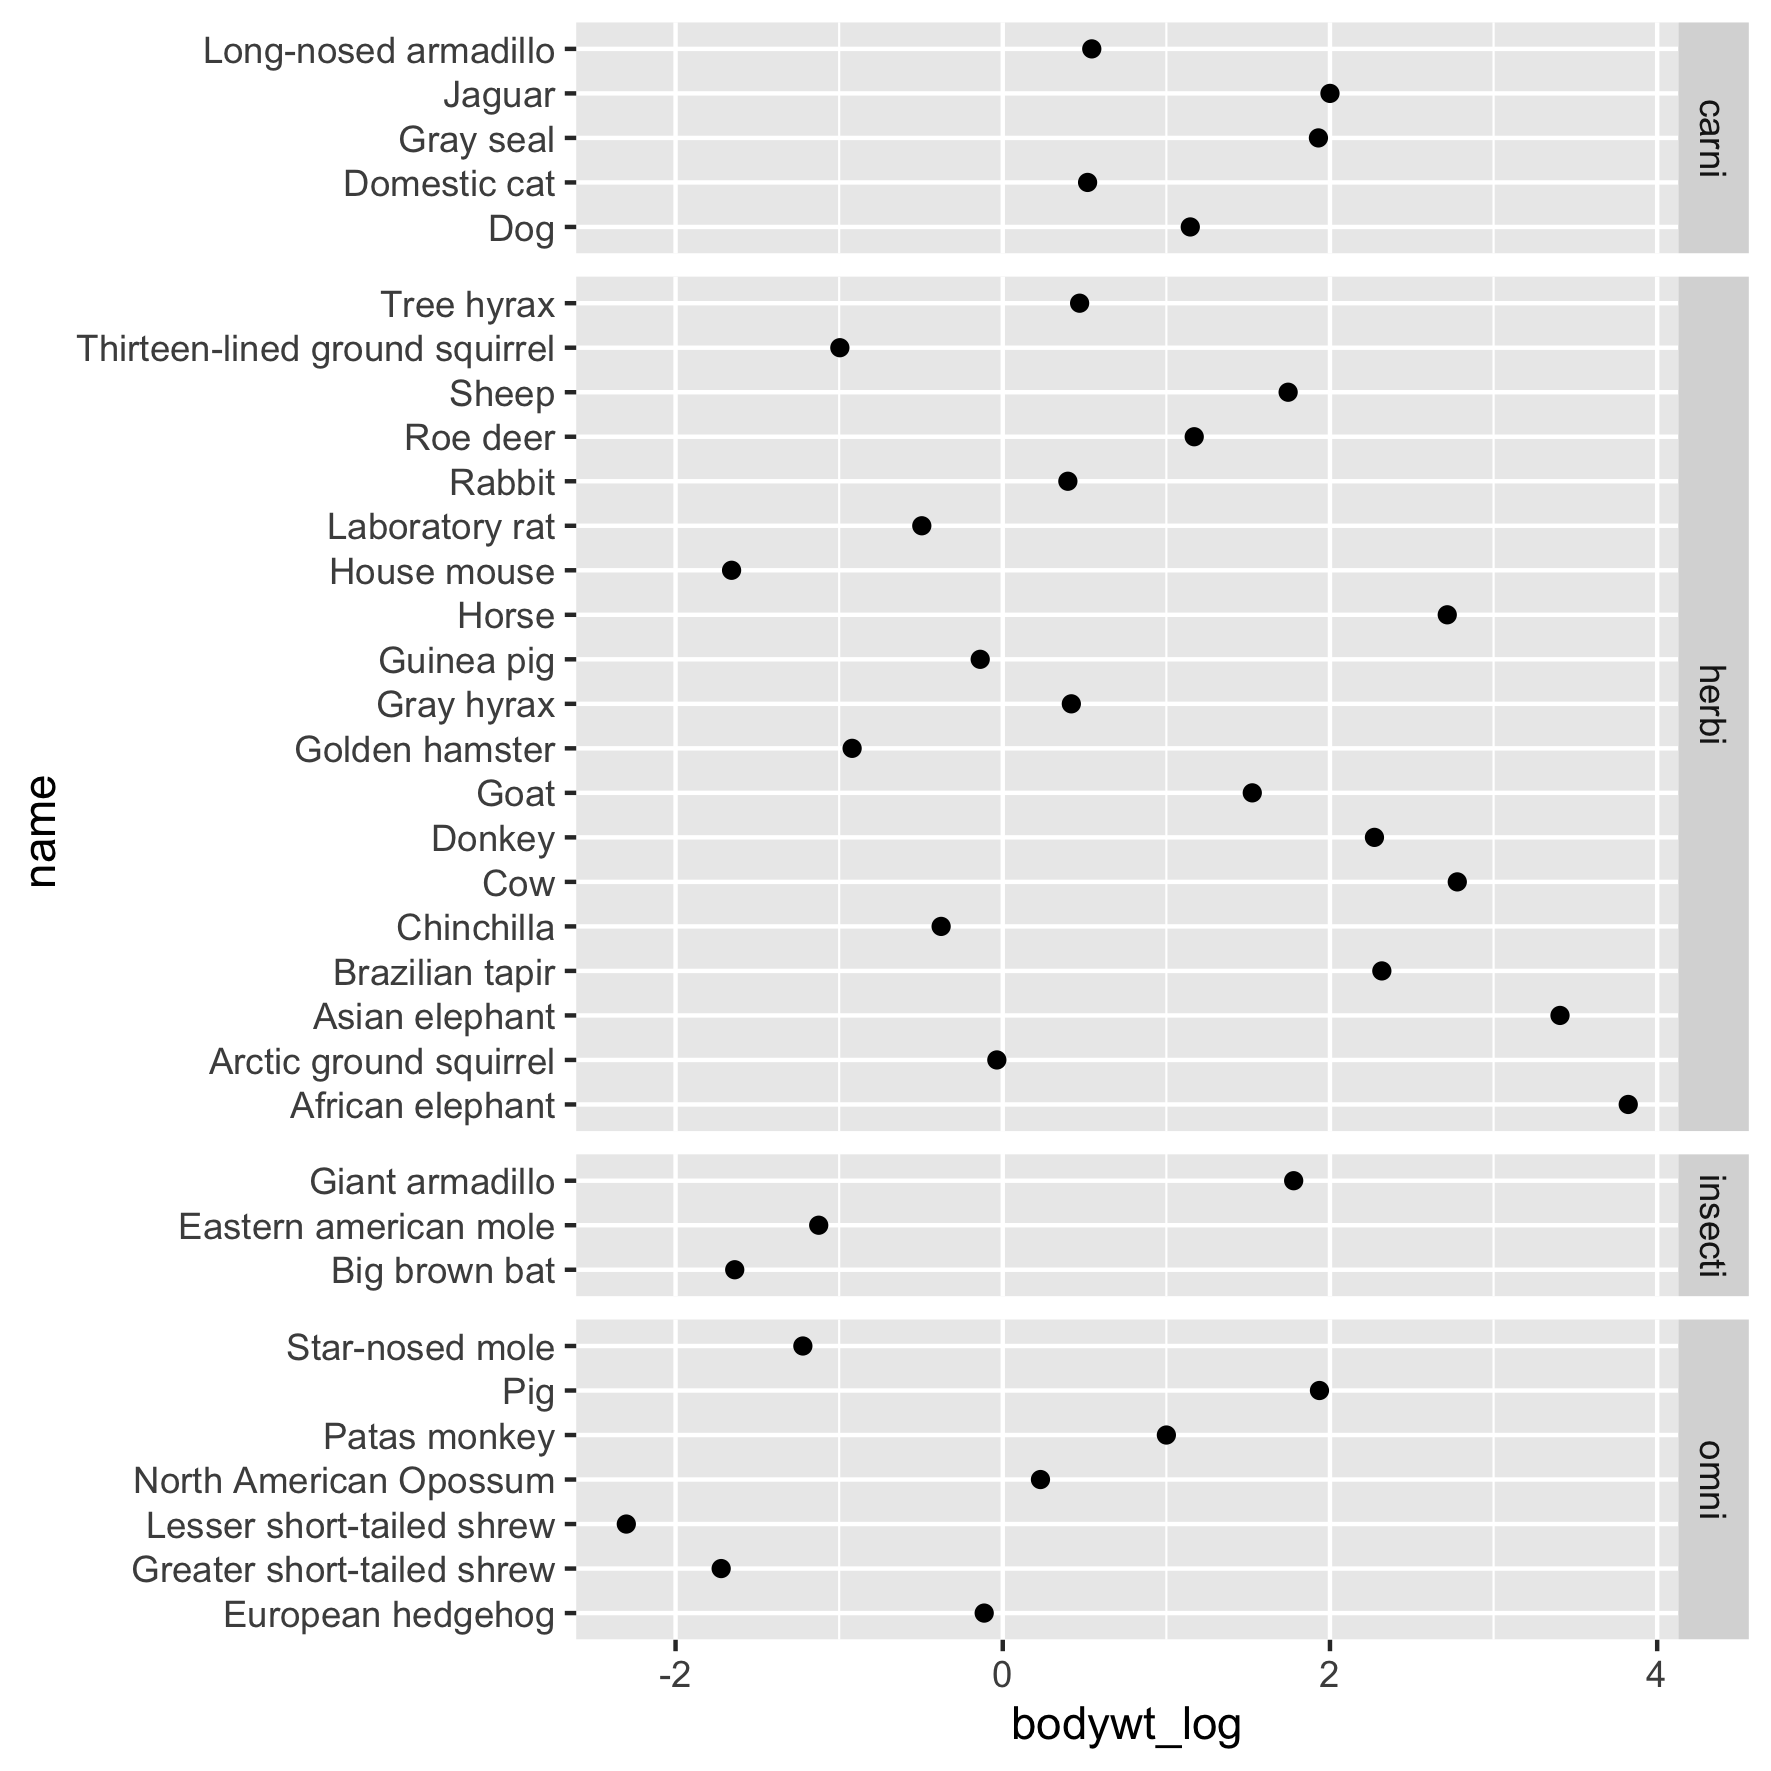
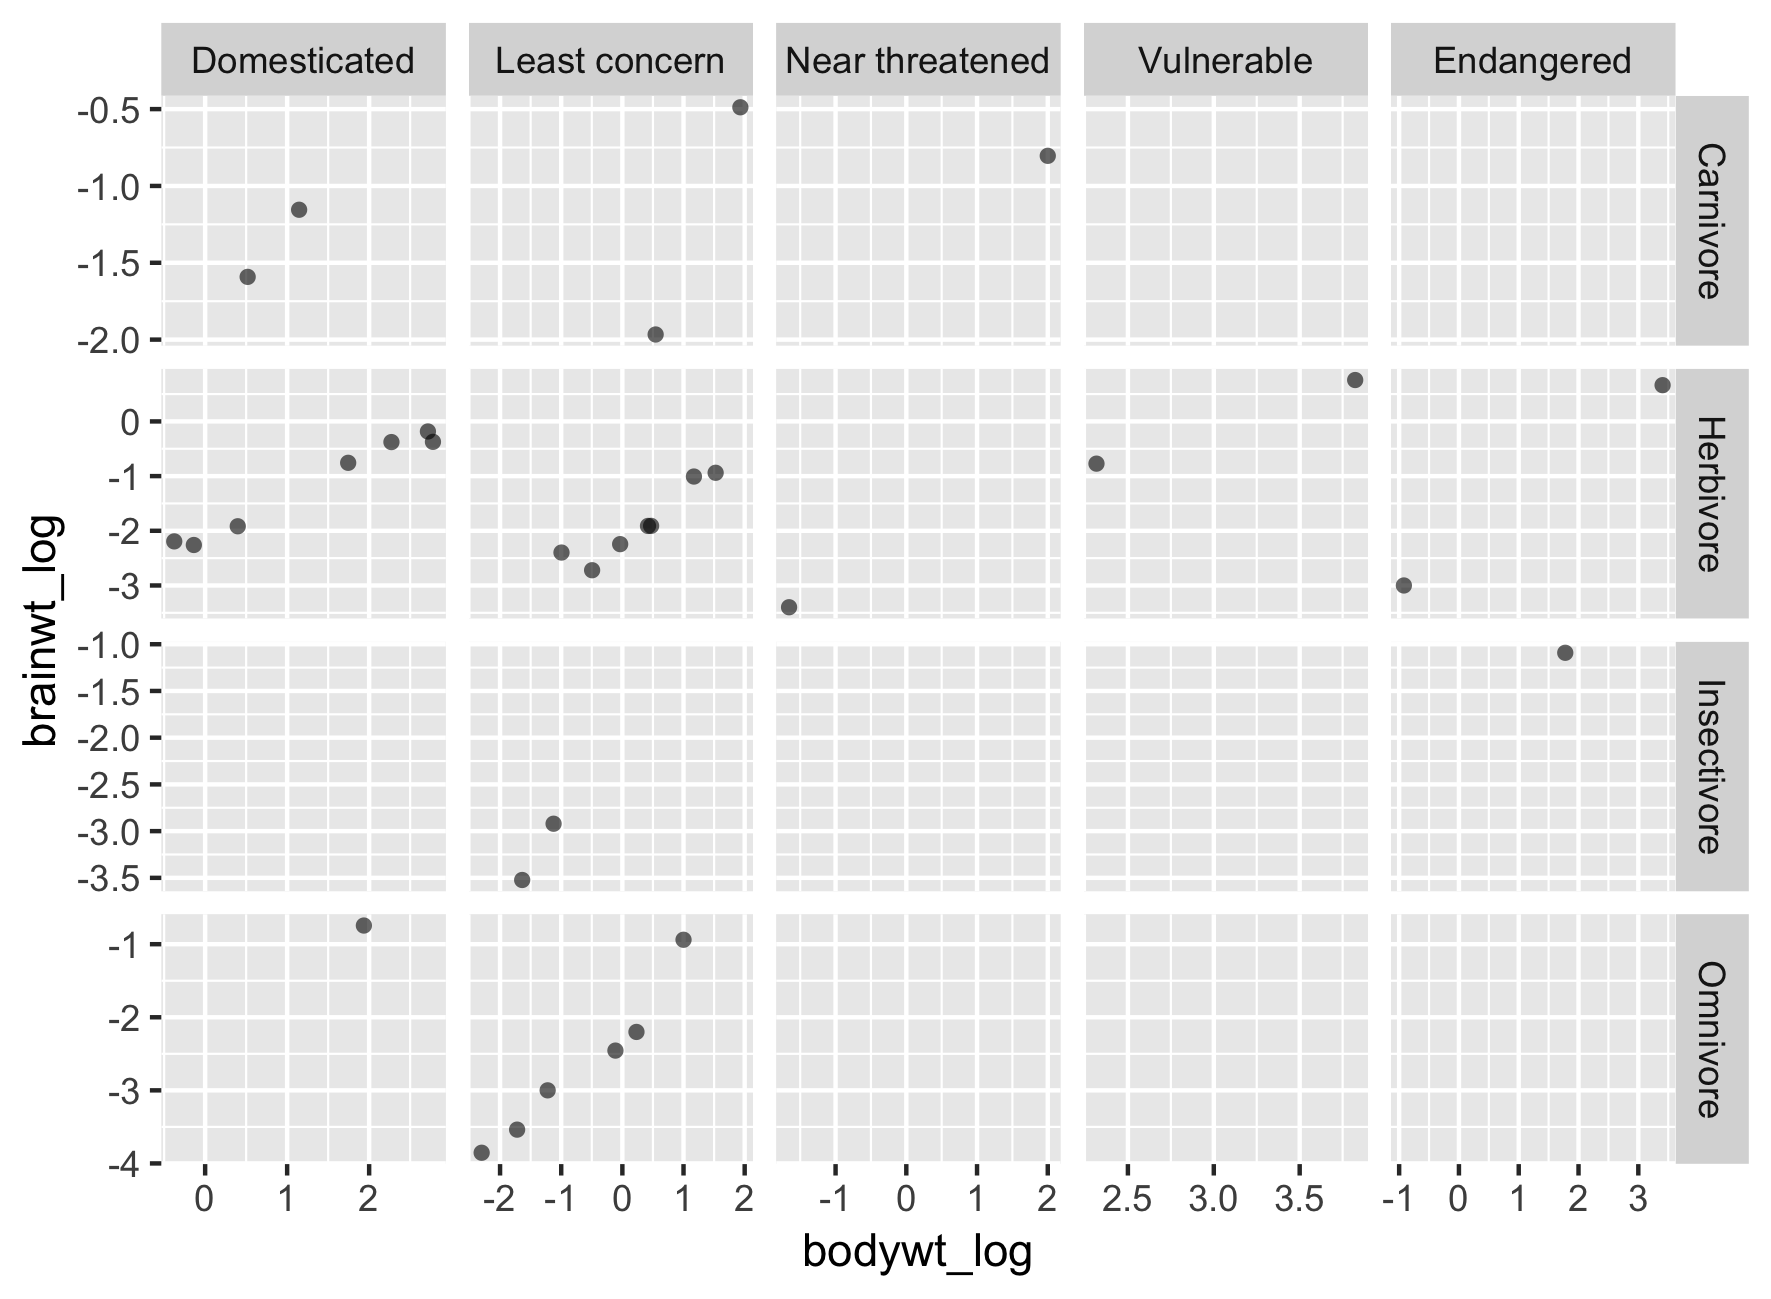
Son ayarlar