İstatistikler: sum ve quantile
ggplot2 ile Orta Düzey Veri Görselleştirme

Rick Scavetta
Founder, Scavetta Academy
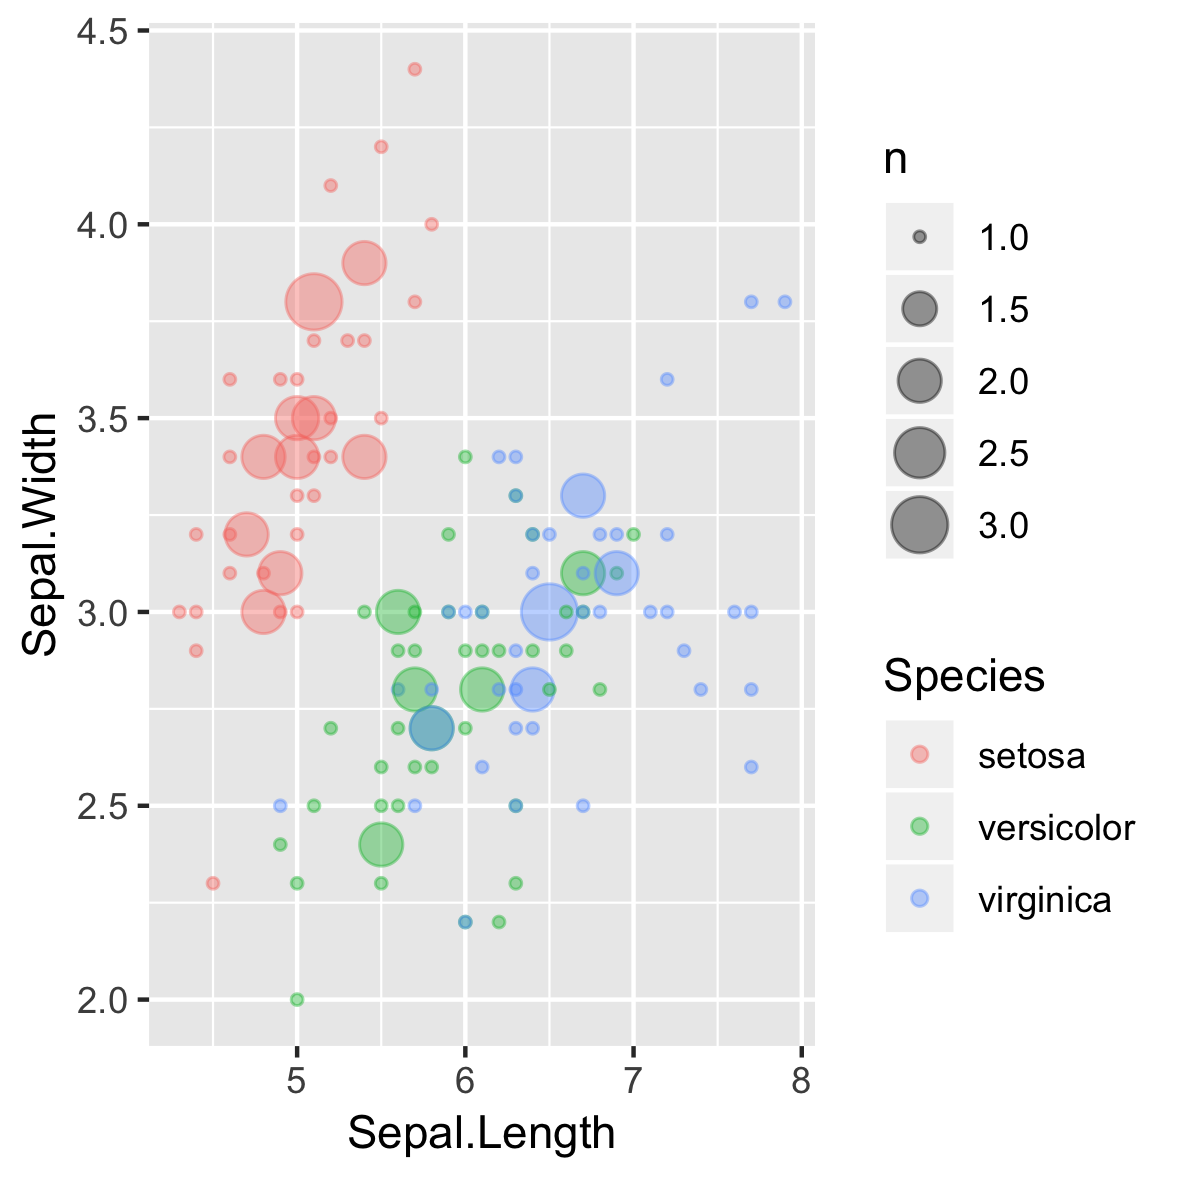
Düşük hassasiyet (ve tamsayı) veriler
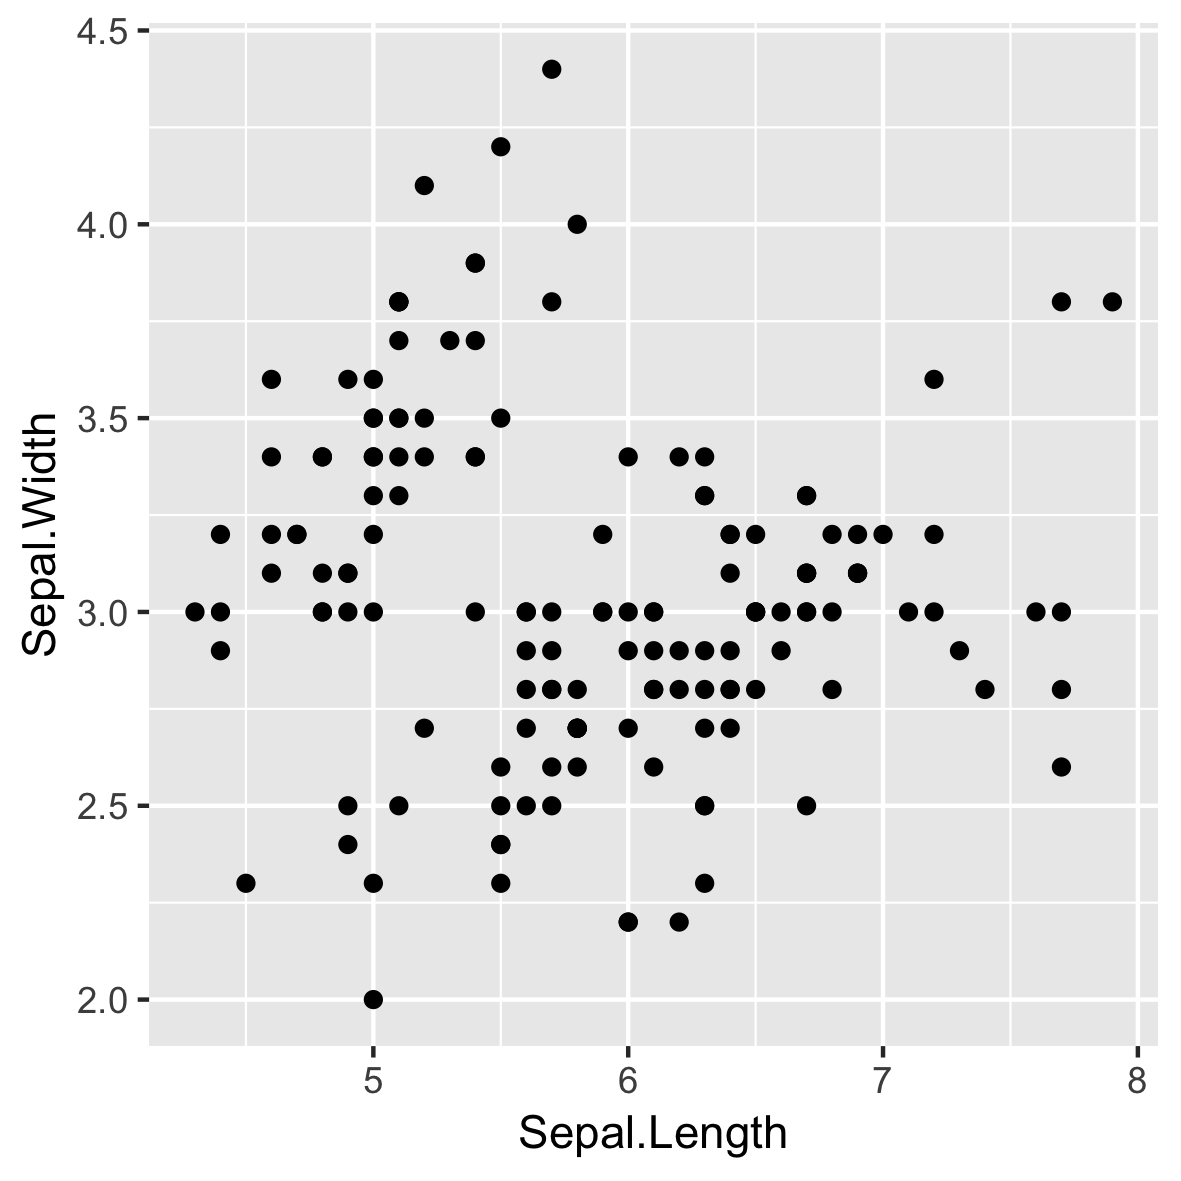
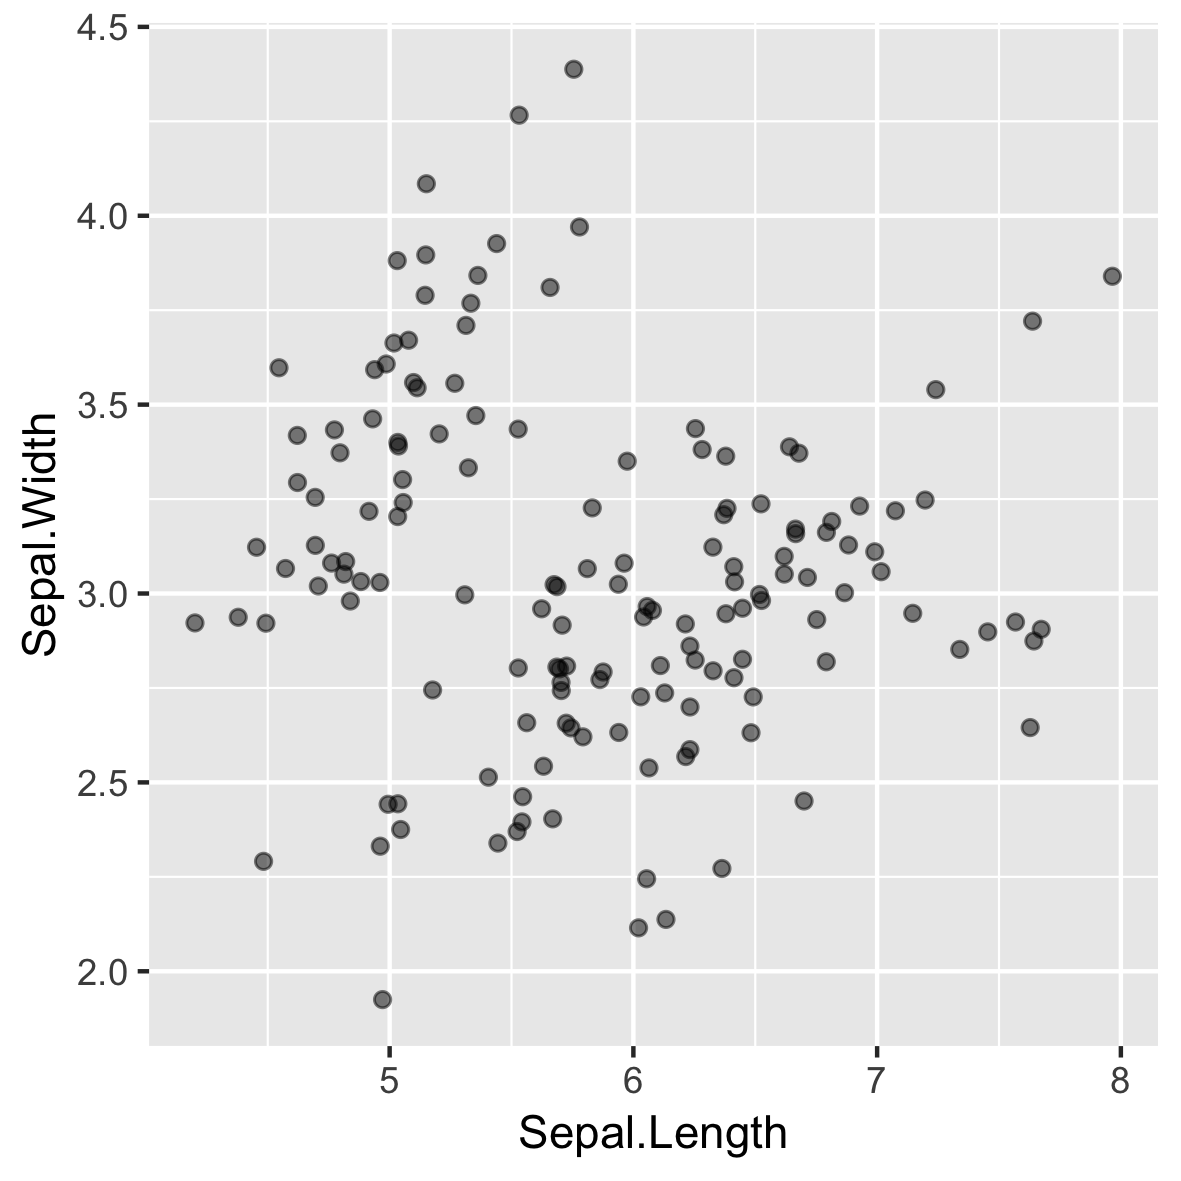
Jitter yanlış izlenim verebilir
geom_count()

stat_sum()
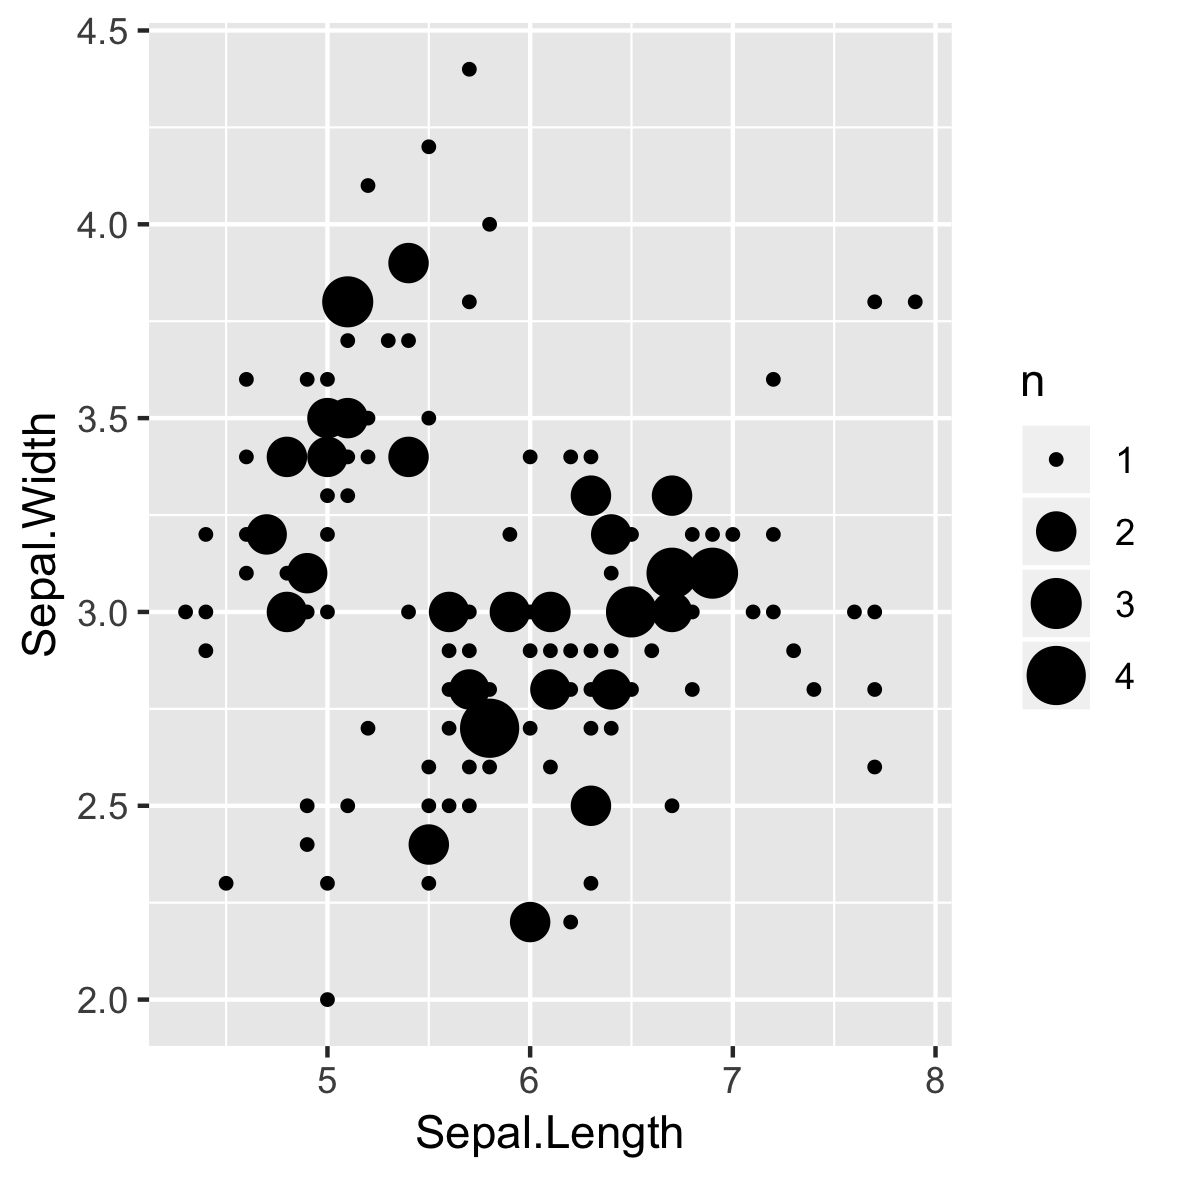
Aşırı üst üste binme hâlâ sorun olabilir!
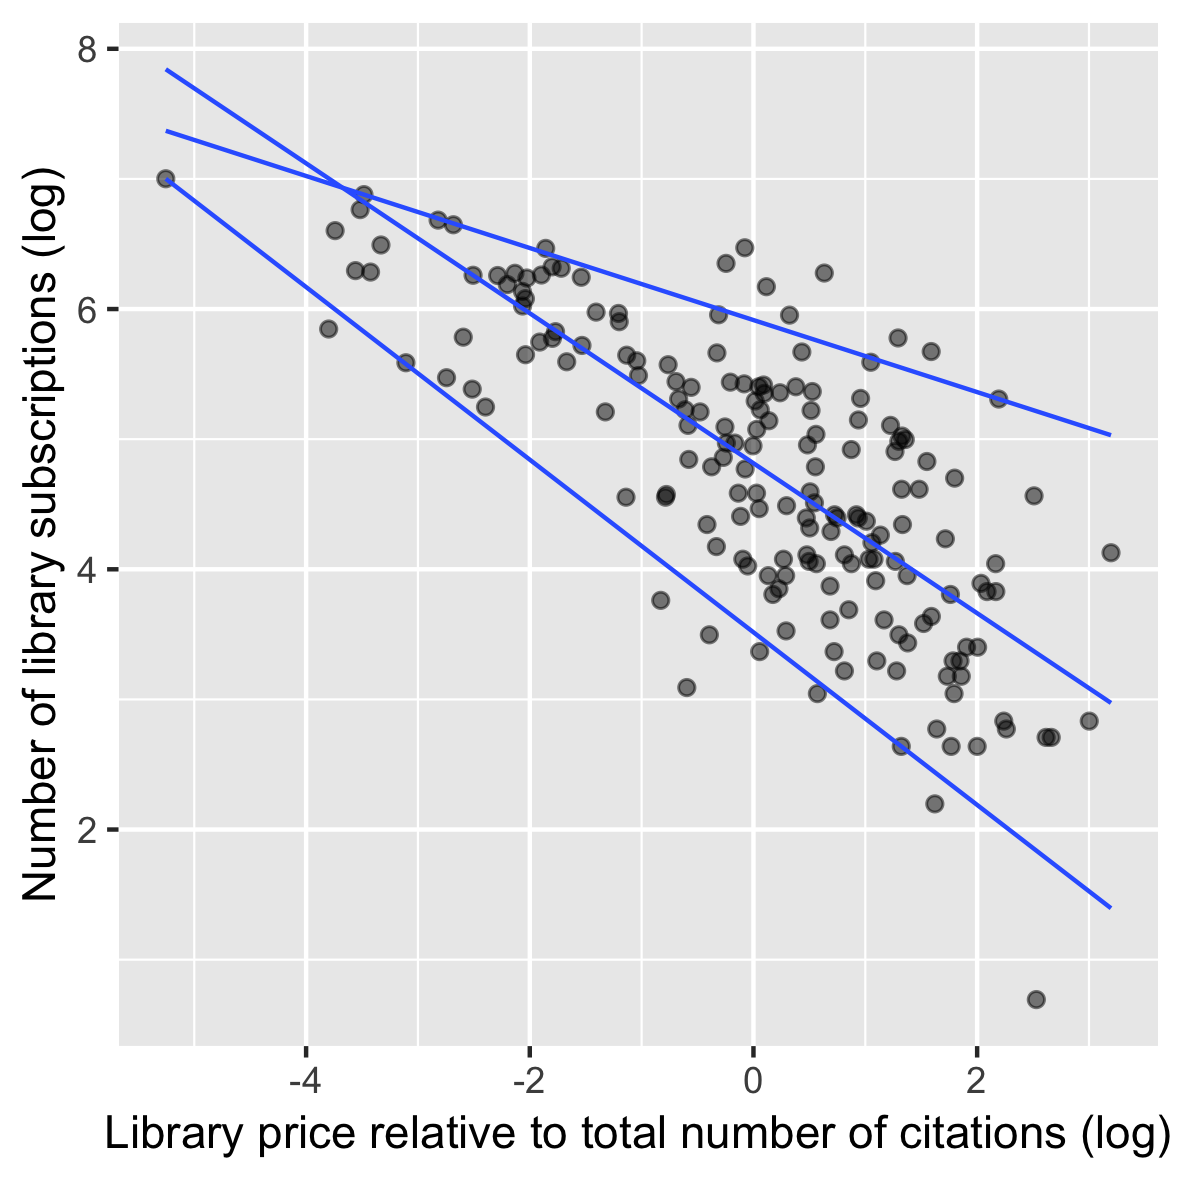
Değişen varyansla başa çıkma
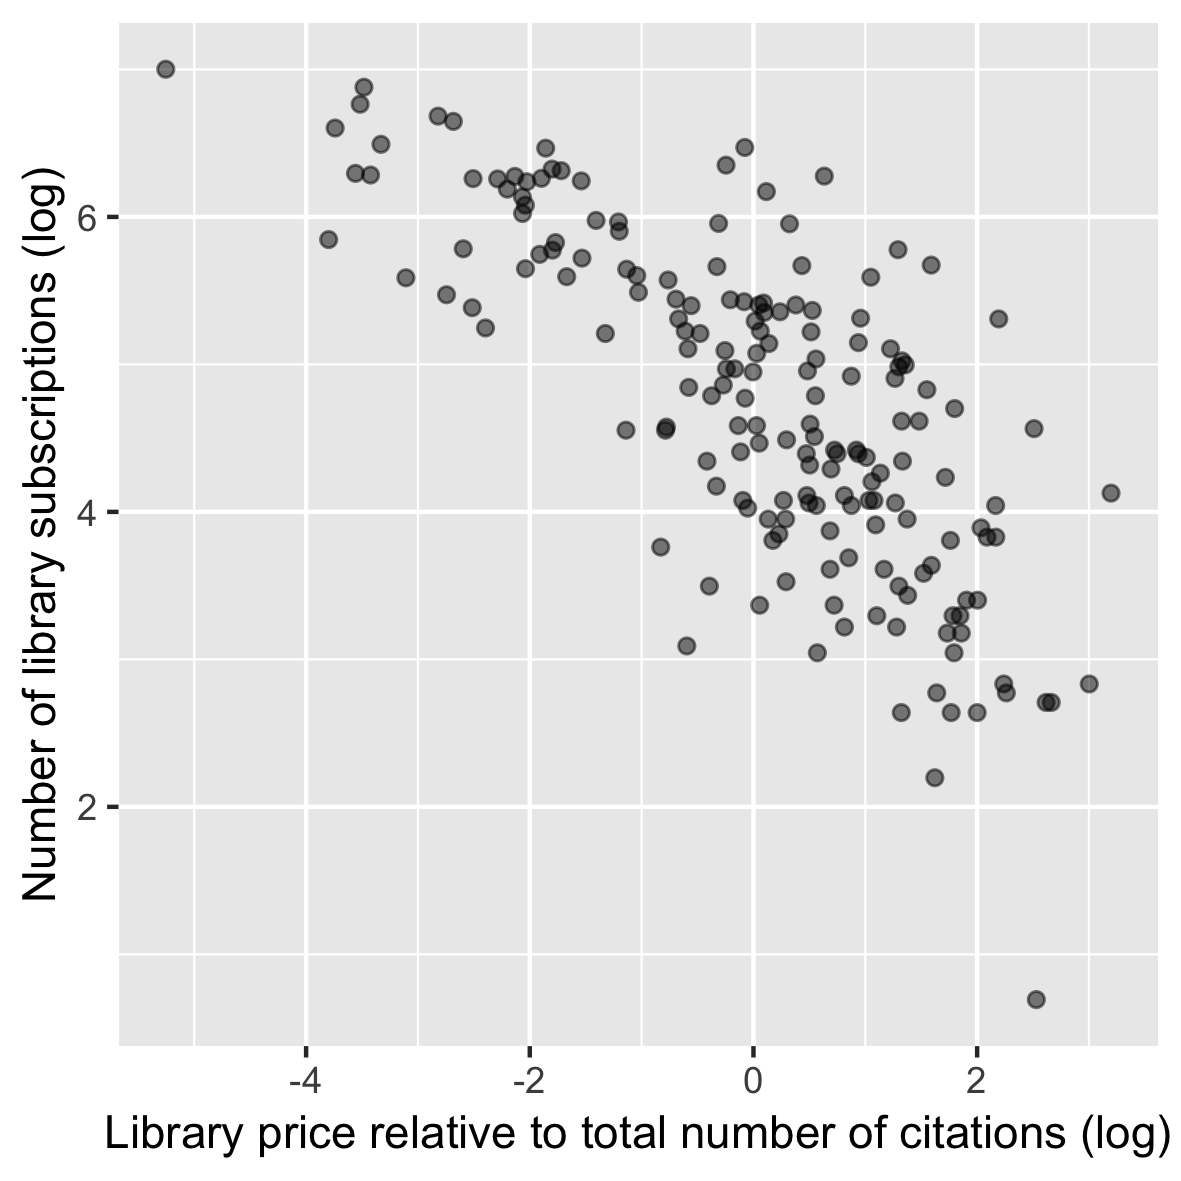
geom_quantile kullanımı