Geoms dışında istatistikler
ggplot2 ile Orta Düzey Veri Görselleştirme

Rick Scavetta
Founder, Scavetta Academy
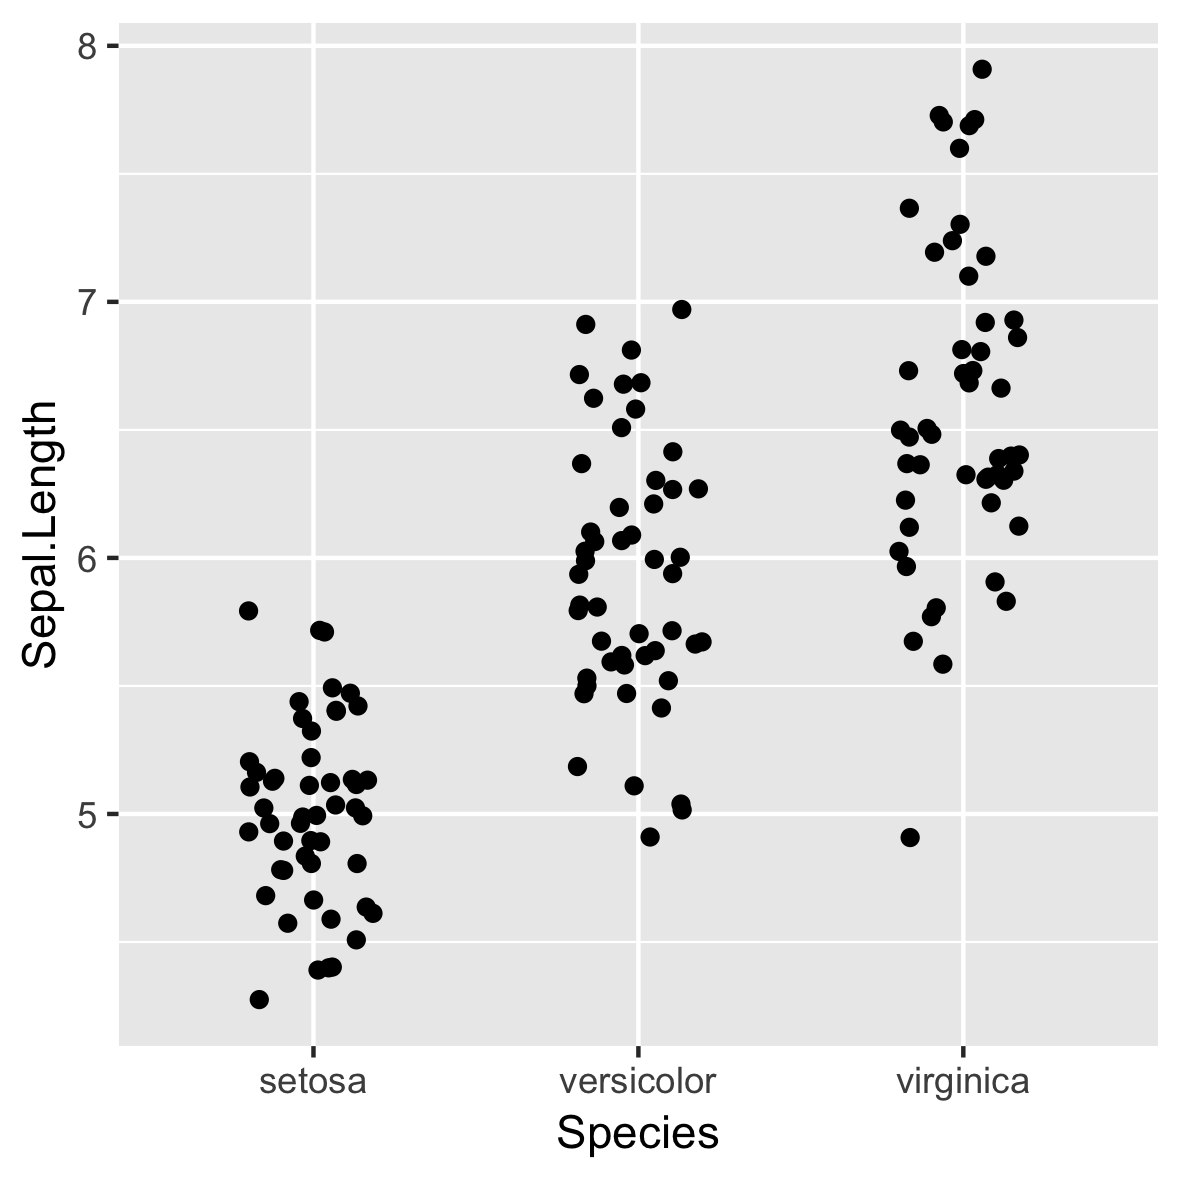
Temel grafik
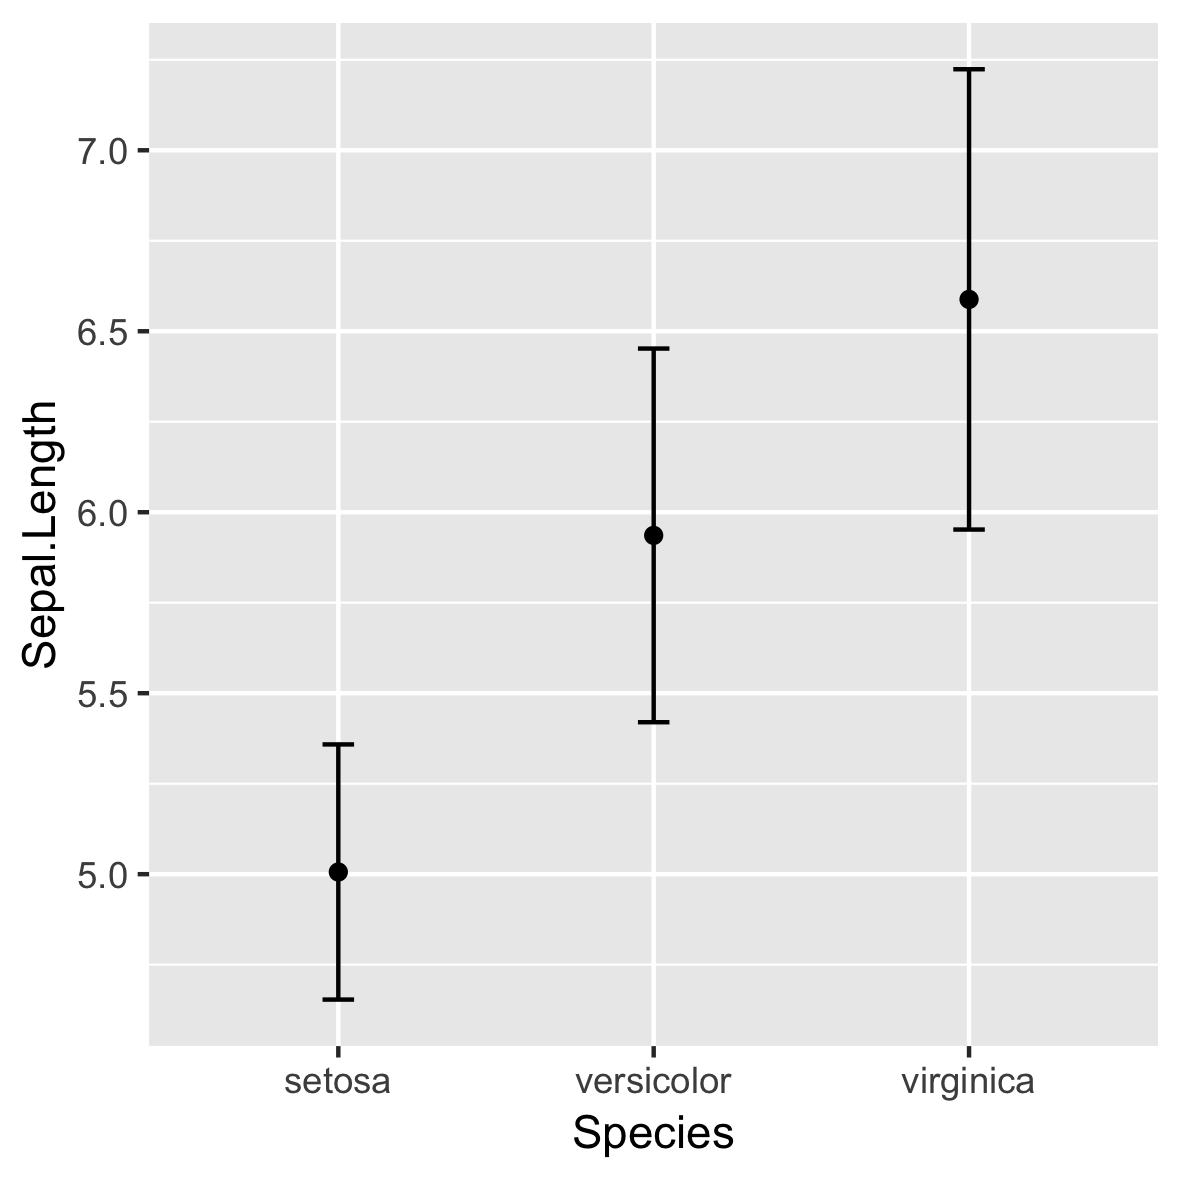
stat_summary()
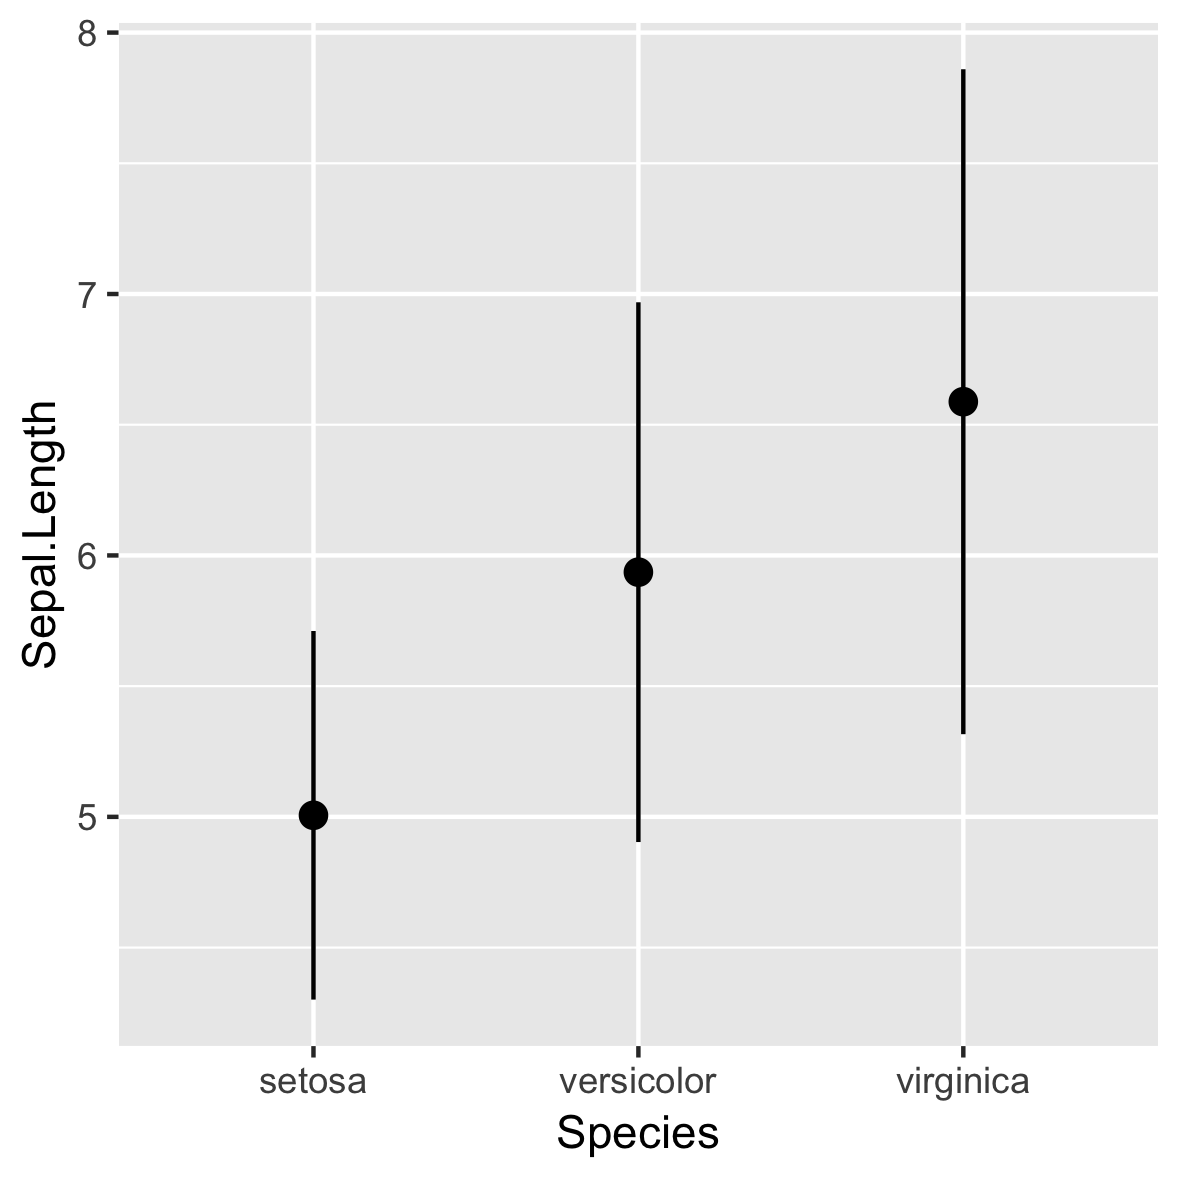
stat_summary()
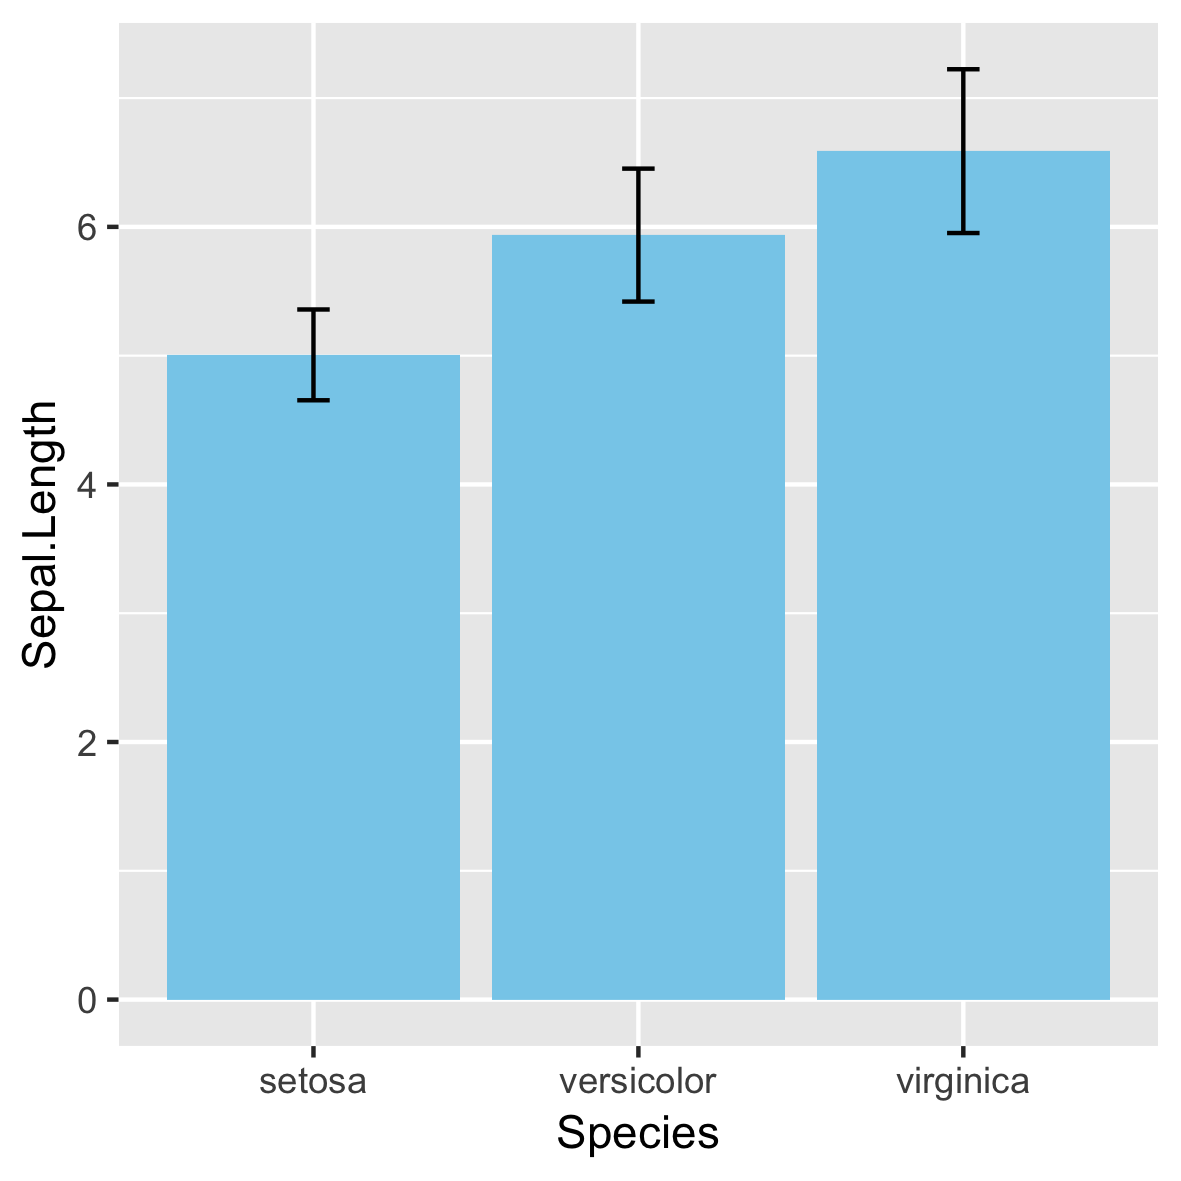
Önerilmez!
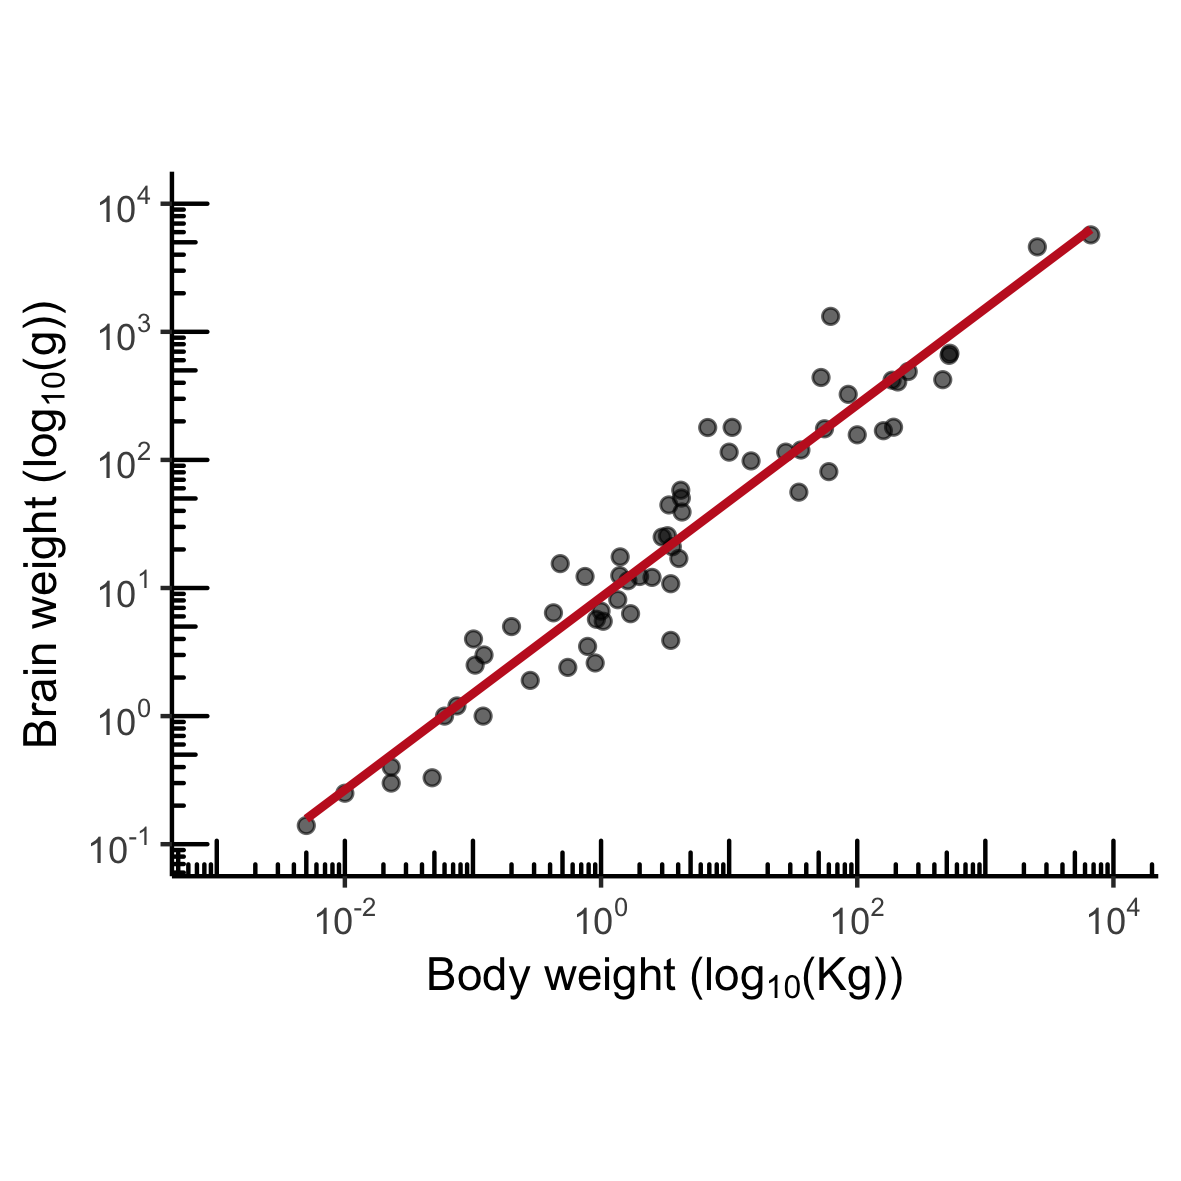
MASS::mammals
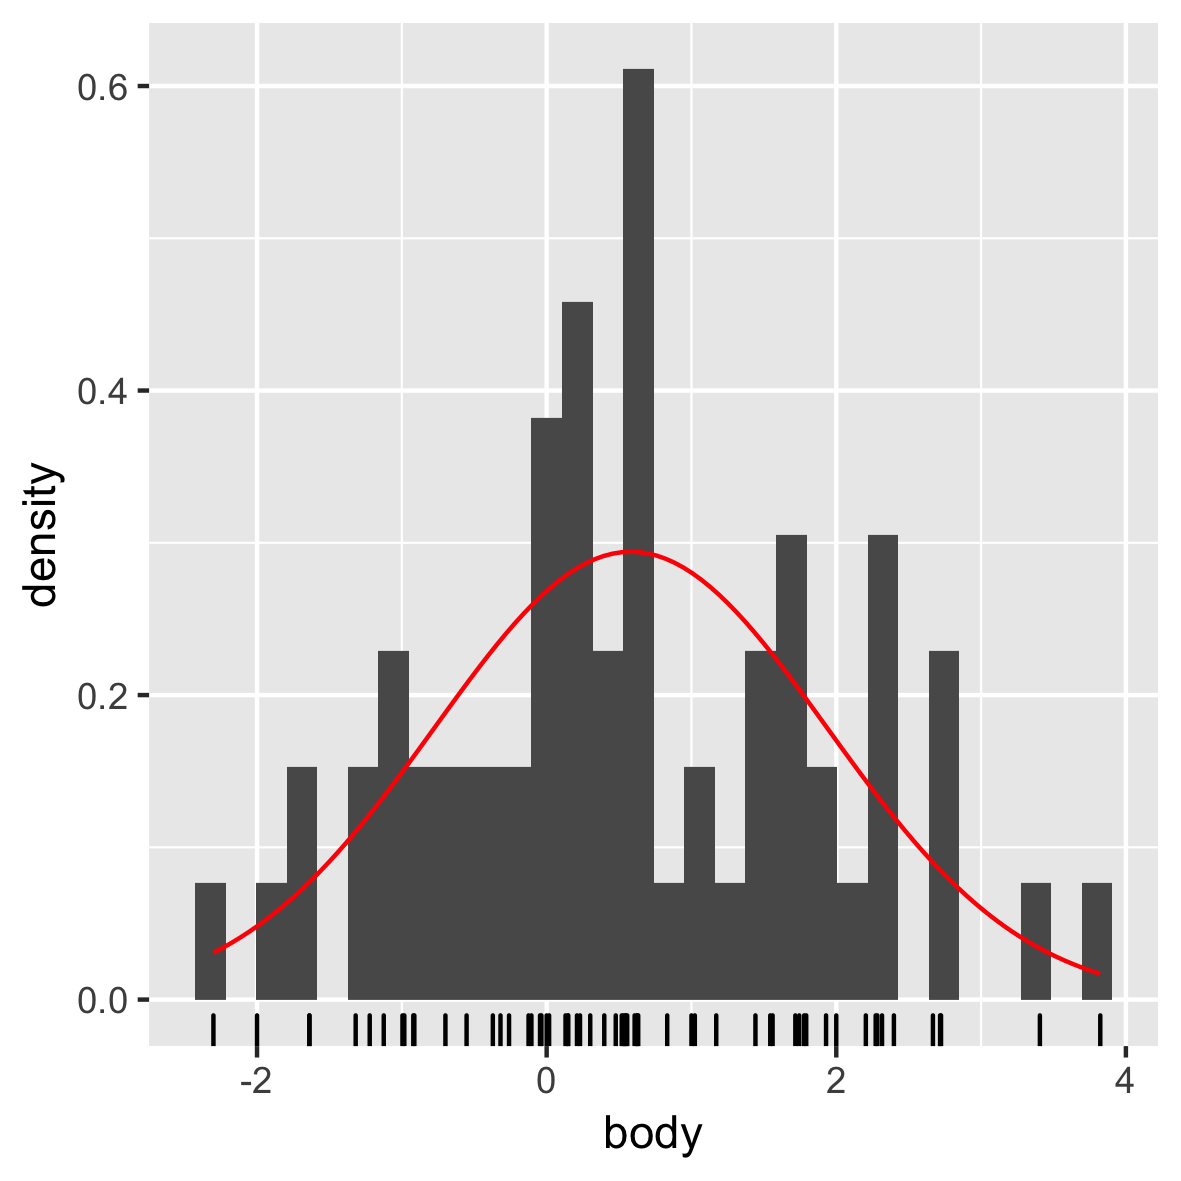
Normal dağılım
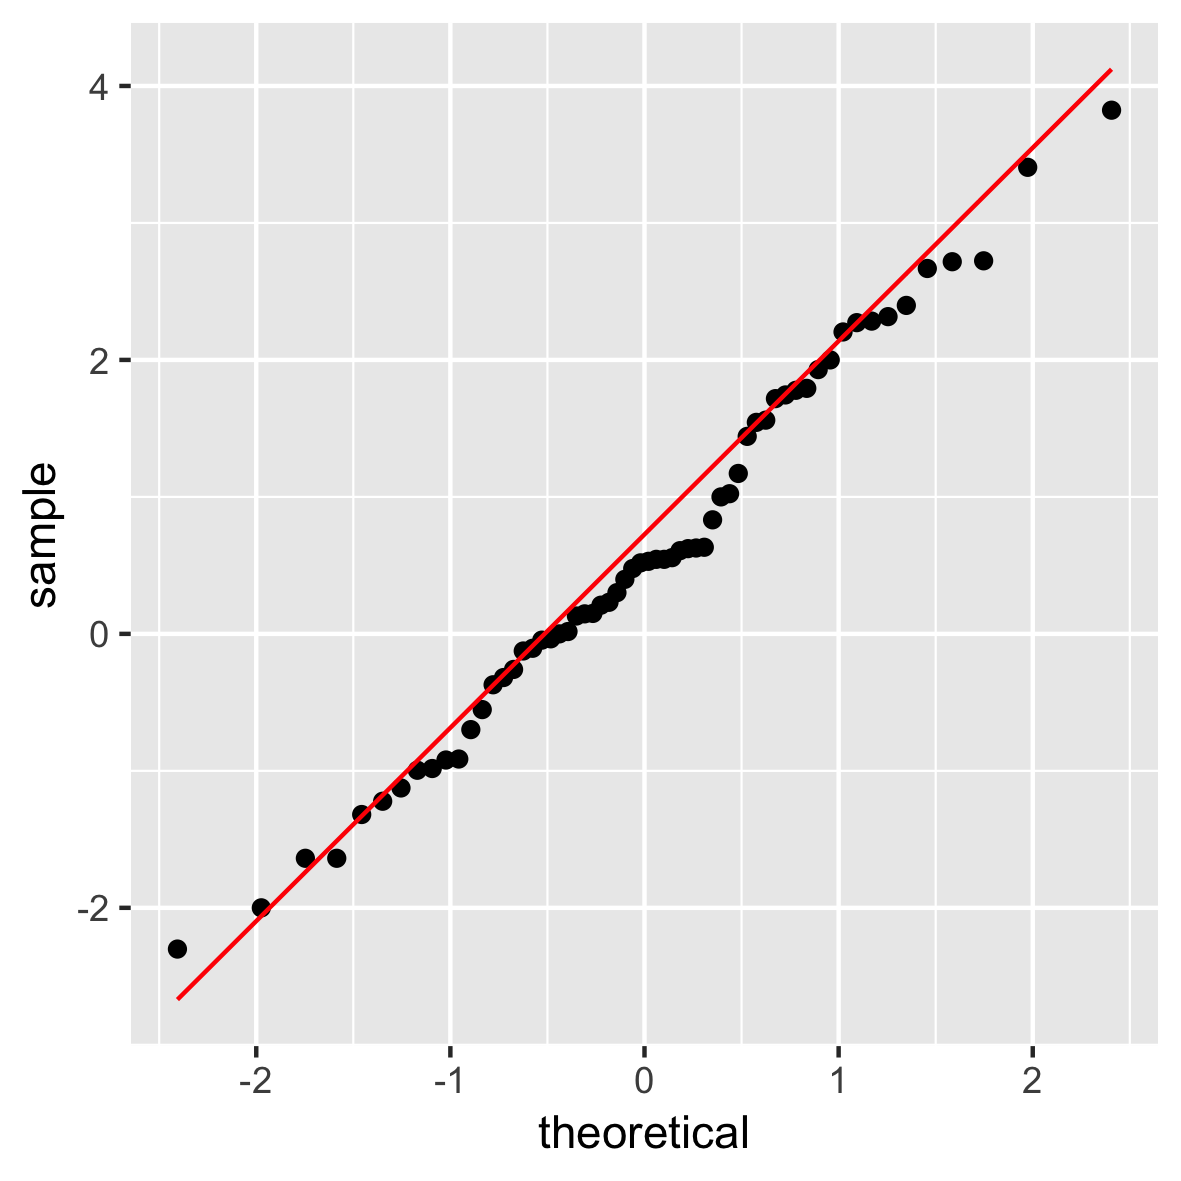
QQ grafiği
ggplot2 ile Orta Düzey Veri Görselleştirme
Rick Scavetta
Founder, Scavetta Academy
Önerilmez!

