facet_wrap ve kenar özetleri
ggplot2 ile Orta Düzey Veri Görselleştirme

Rick Scavetta
Founder, Scavetta Academy
Grafik alanını ayarlama
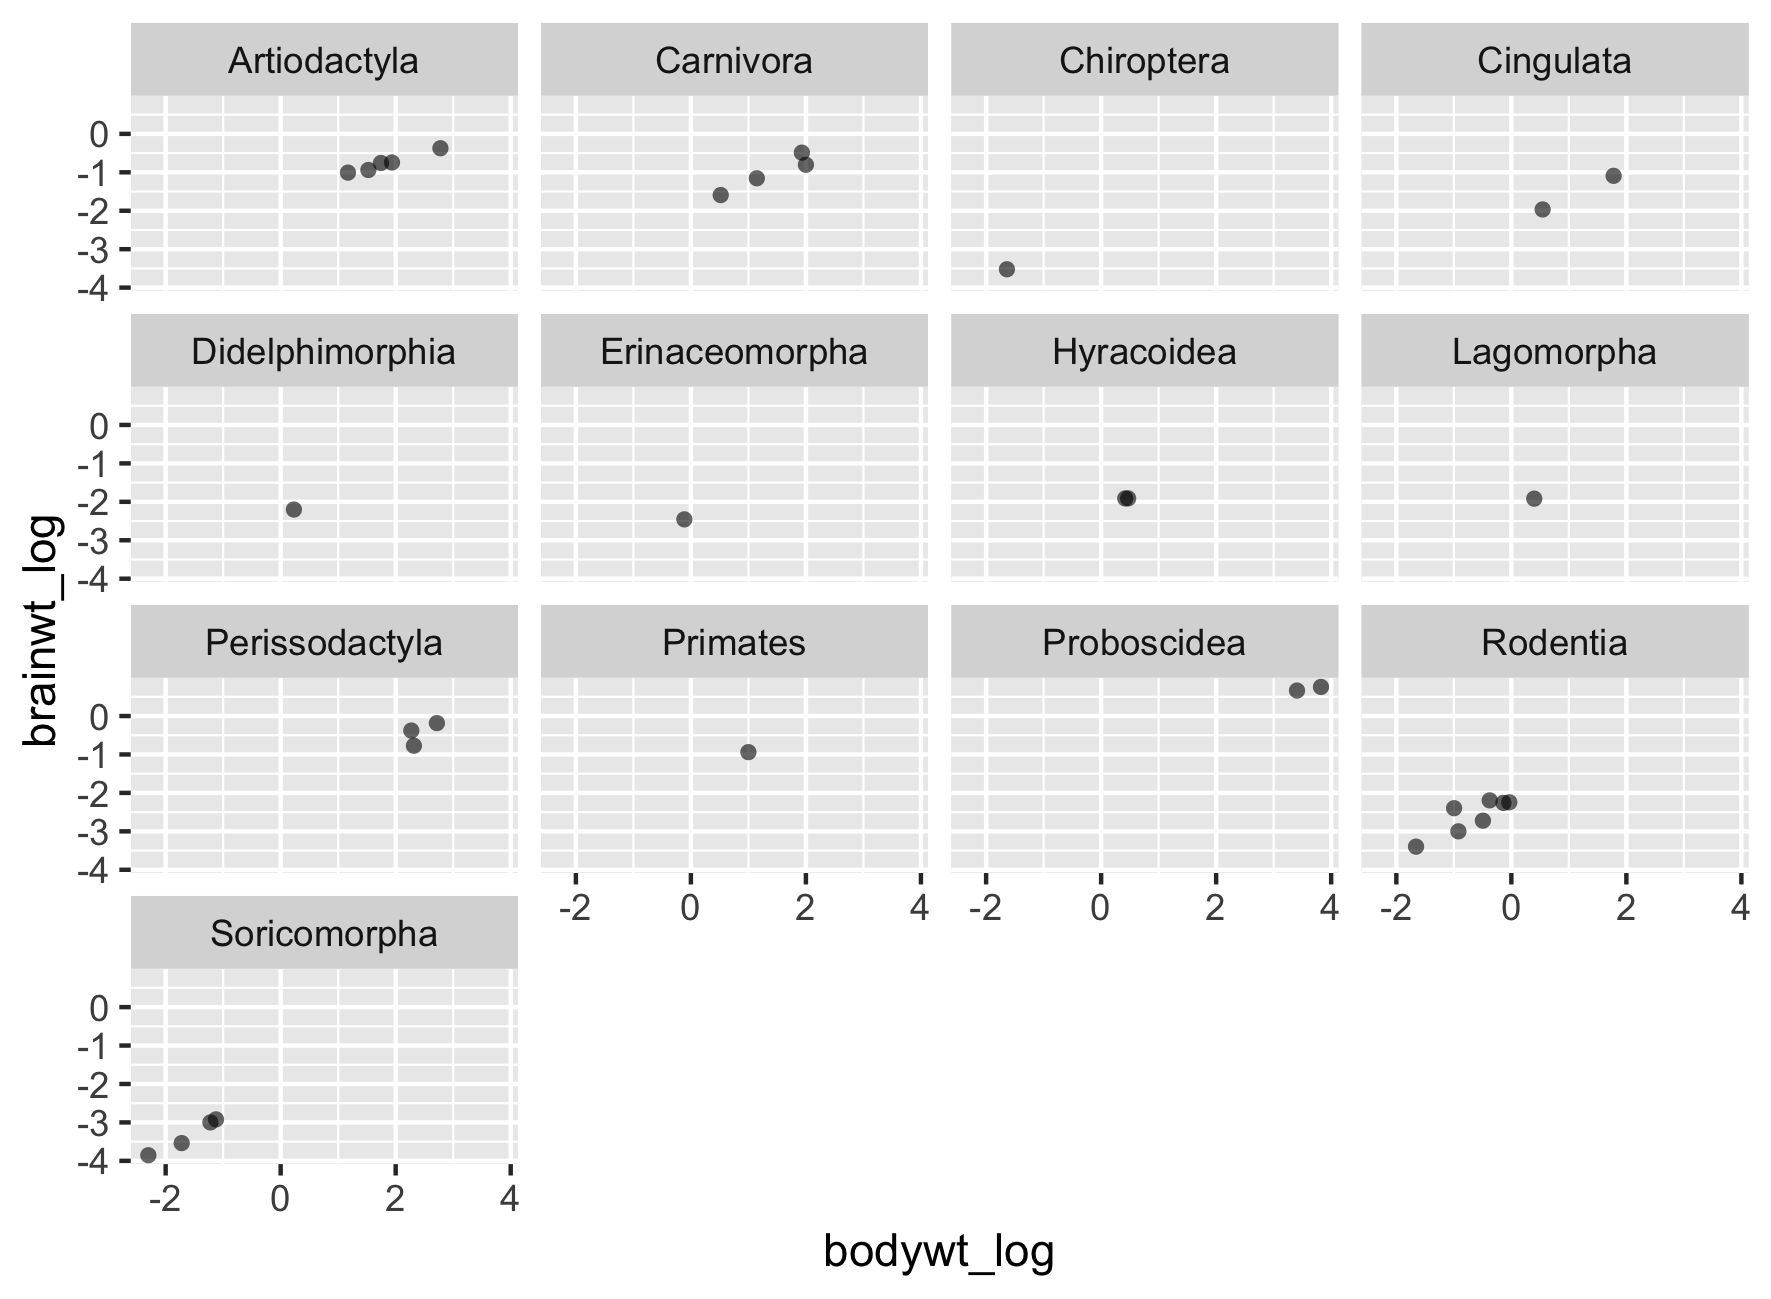
facet_wrap() kullanımı - Senaryo 1
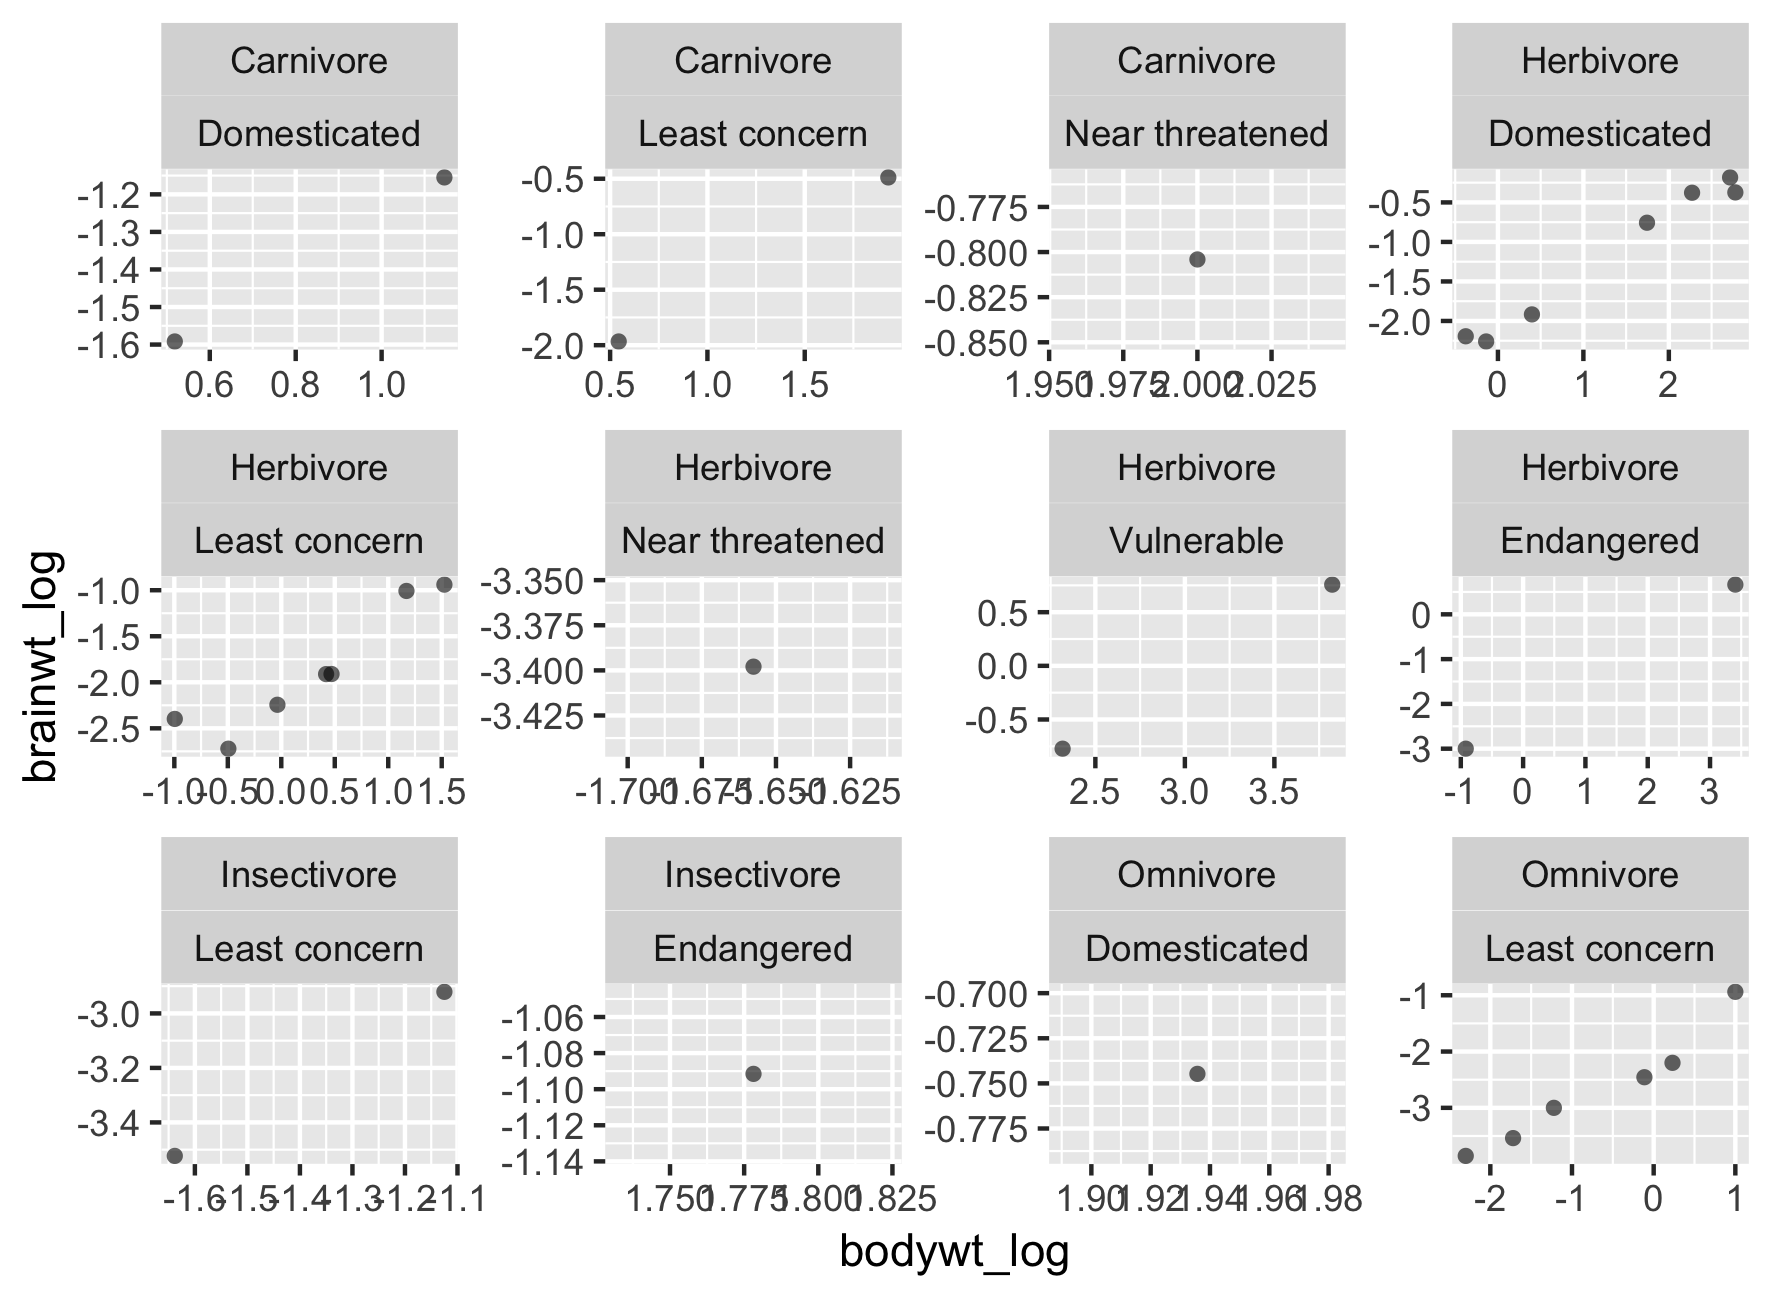
facet_wrap() kullanımı - Senaryo 2
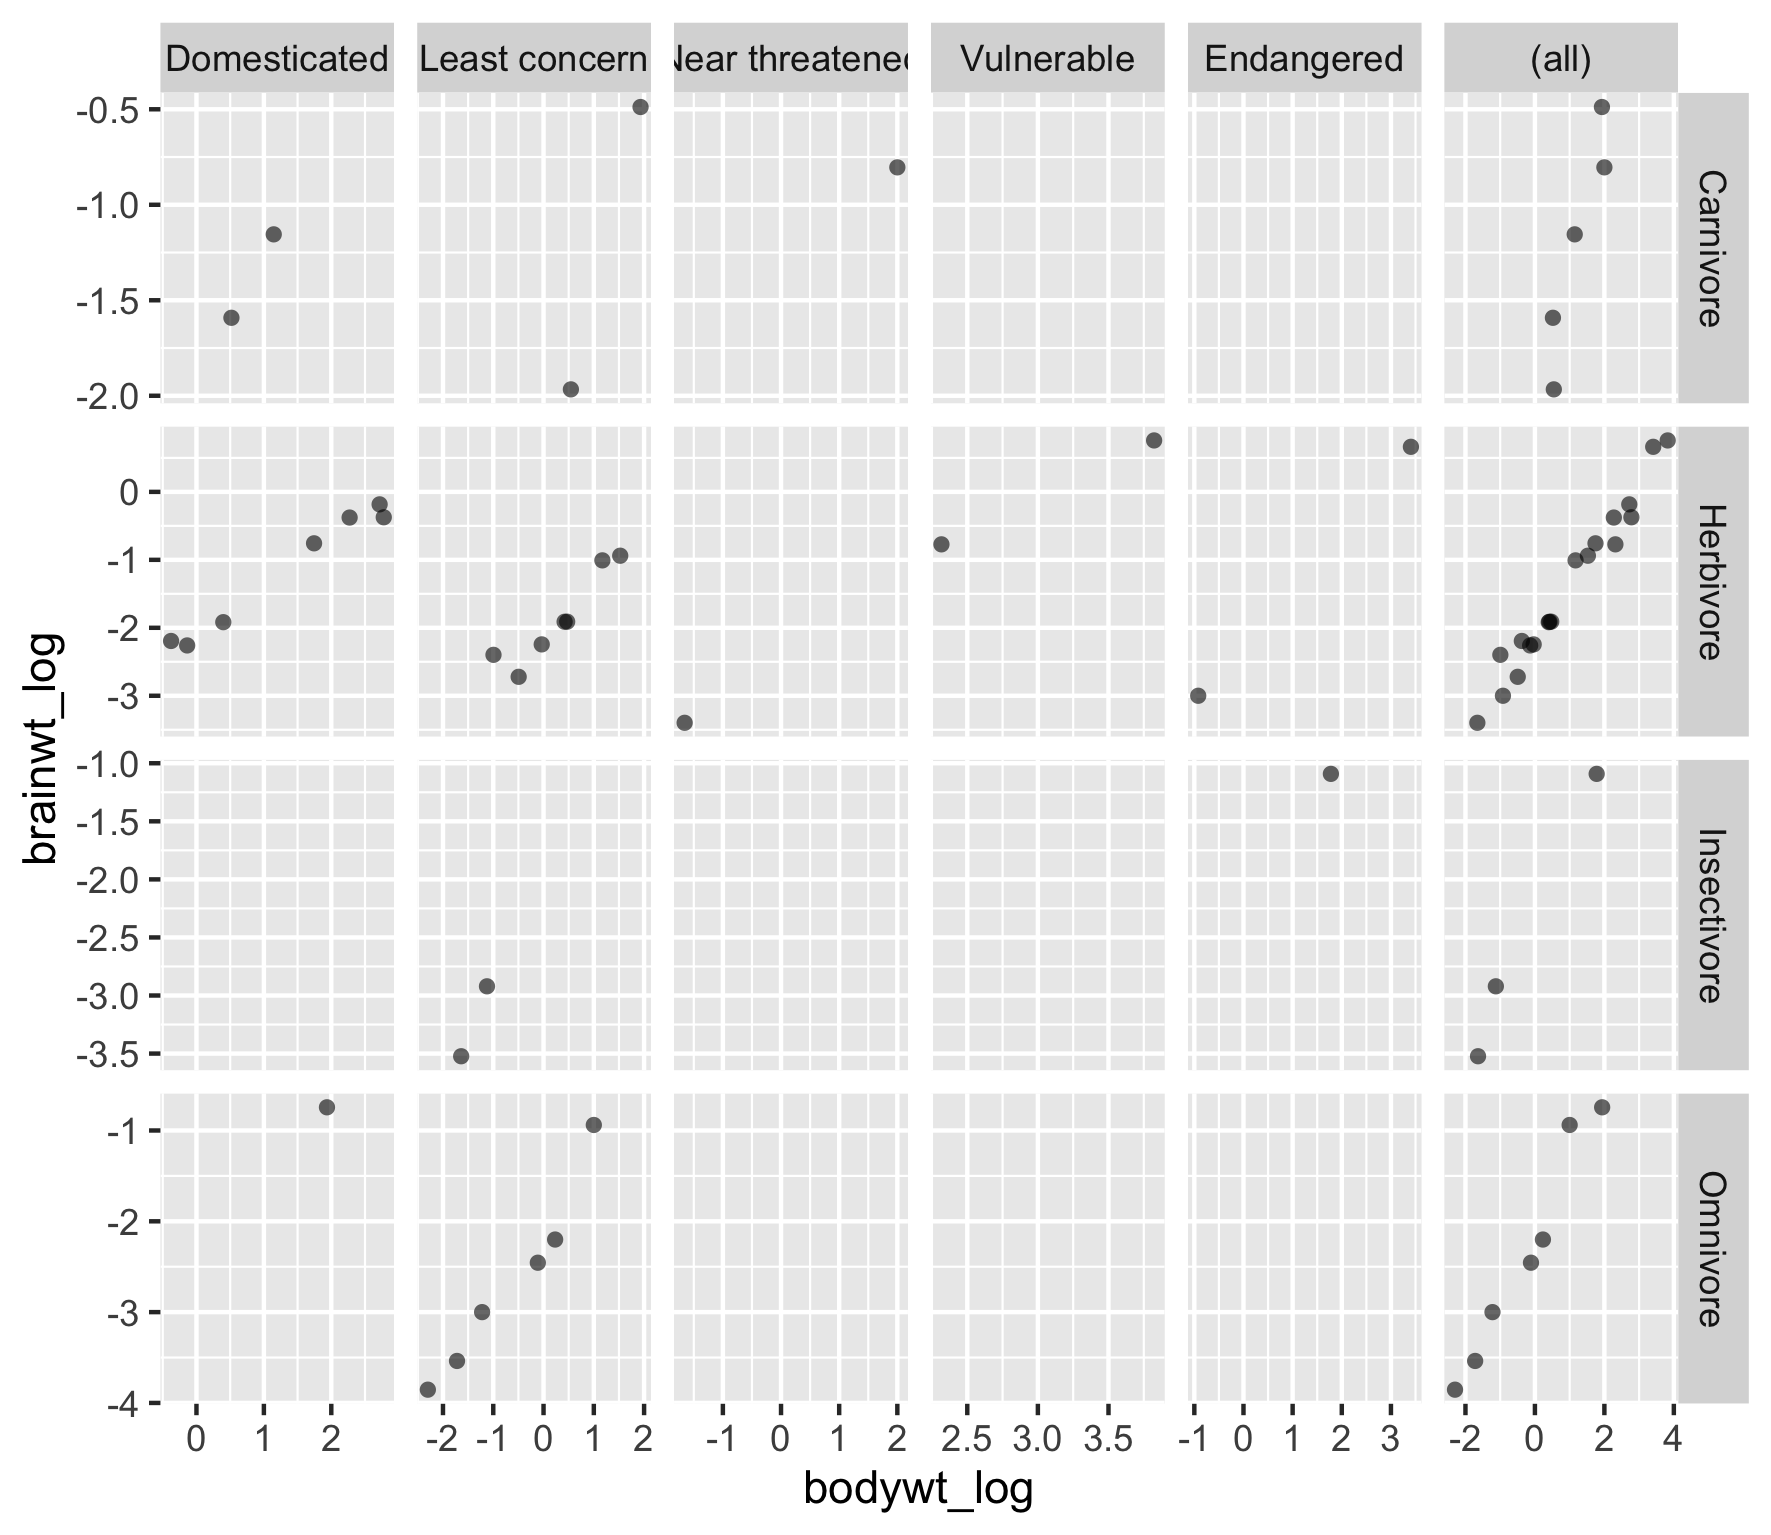
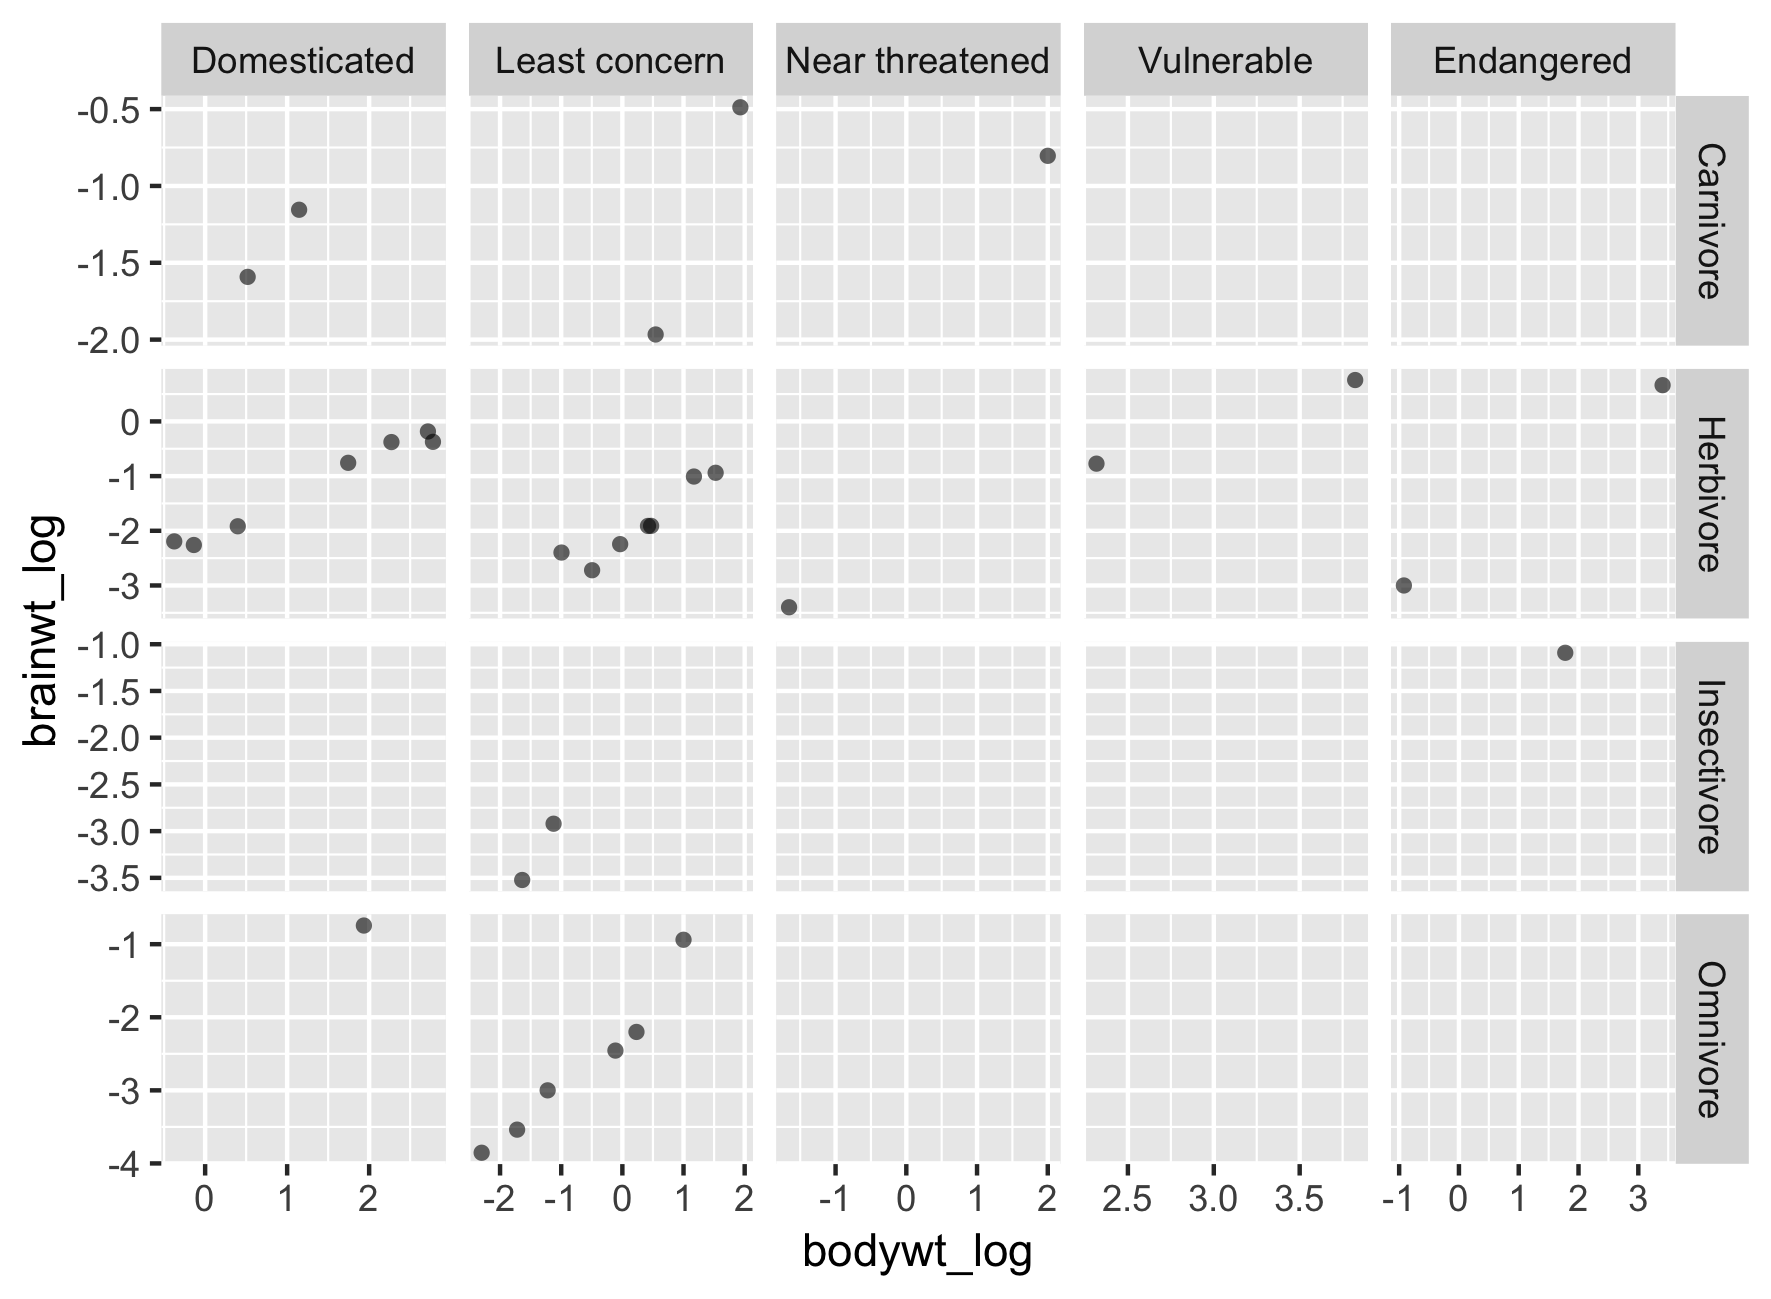
Kenar (margin) grafikleri kullanma
Kenar (margin) grafikleri kullanma
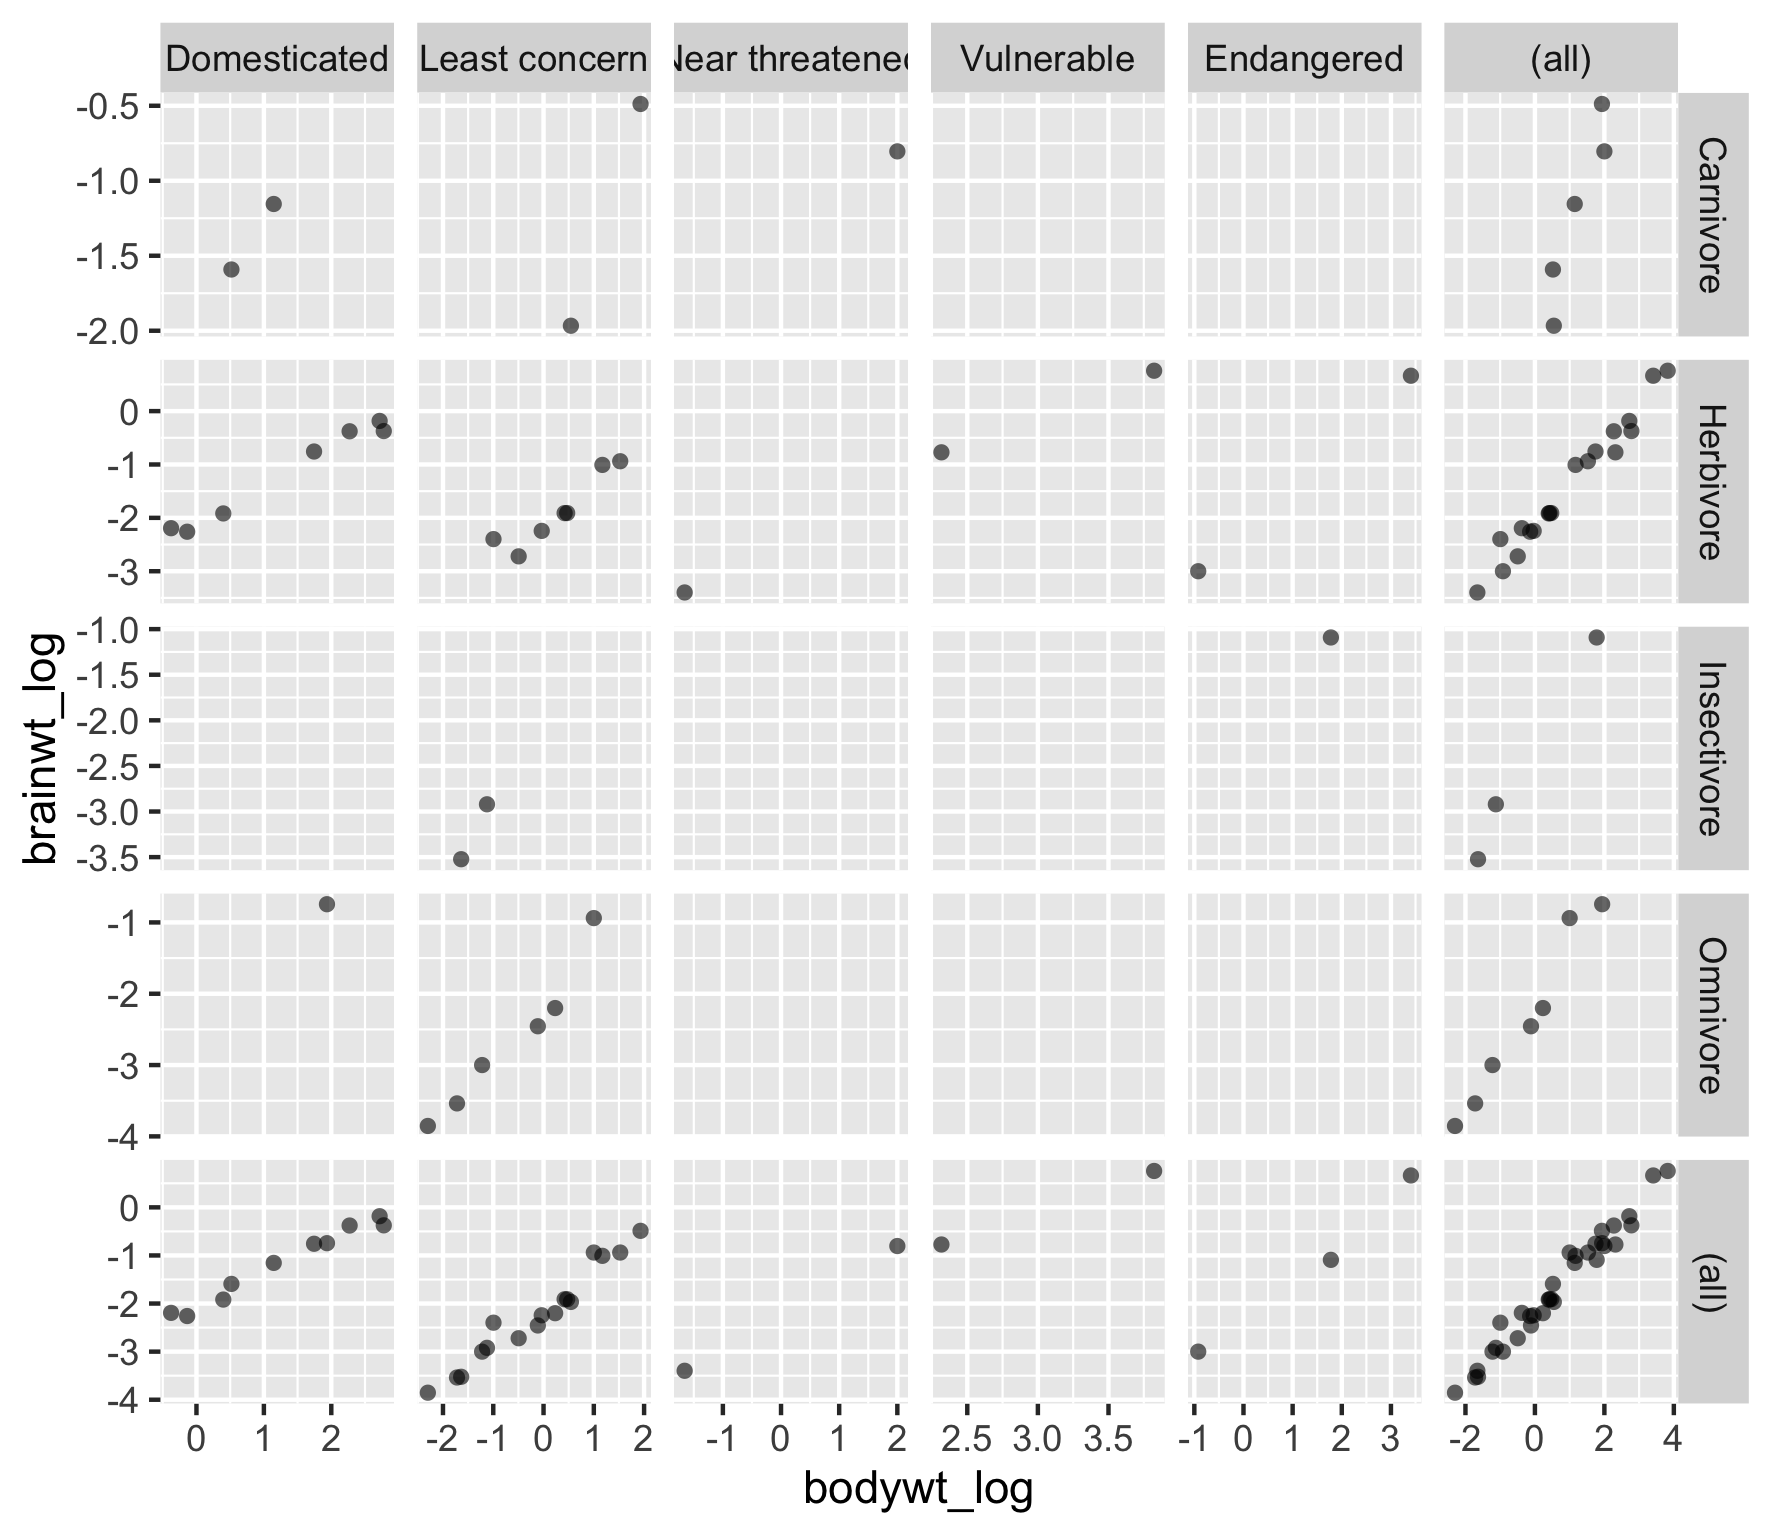
Kenar (margin) grafikleri kullanma