Yukarı örnekleme ve enterpolasyon: .resample() ile
Python ile Zaman Serisi Verilerini Manipüle Etme

Stefan Jansen
Founder & Lead Data Scientist at Applied Artificial Intelligence
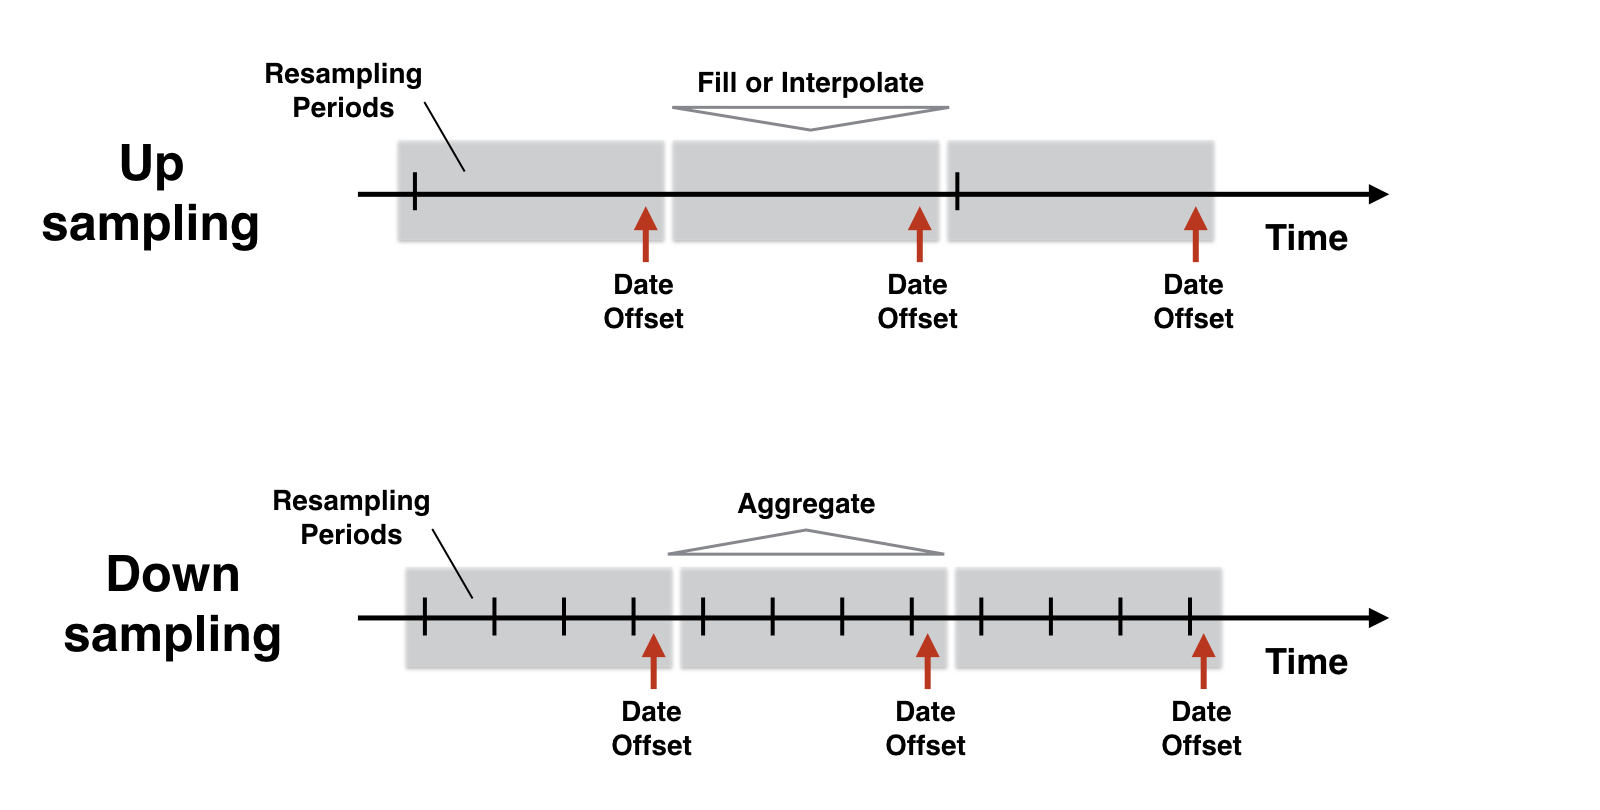
Yeniden örnekleme mantığı
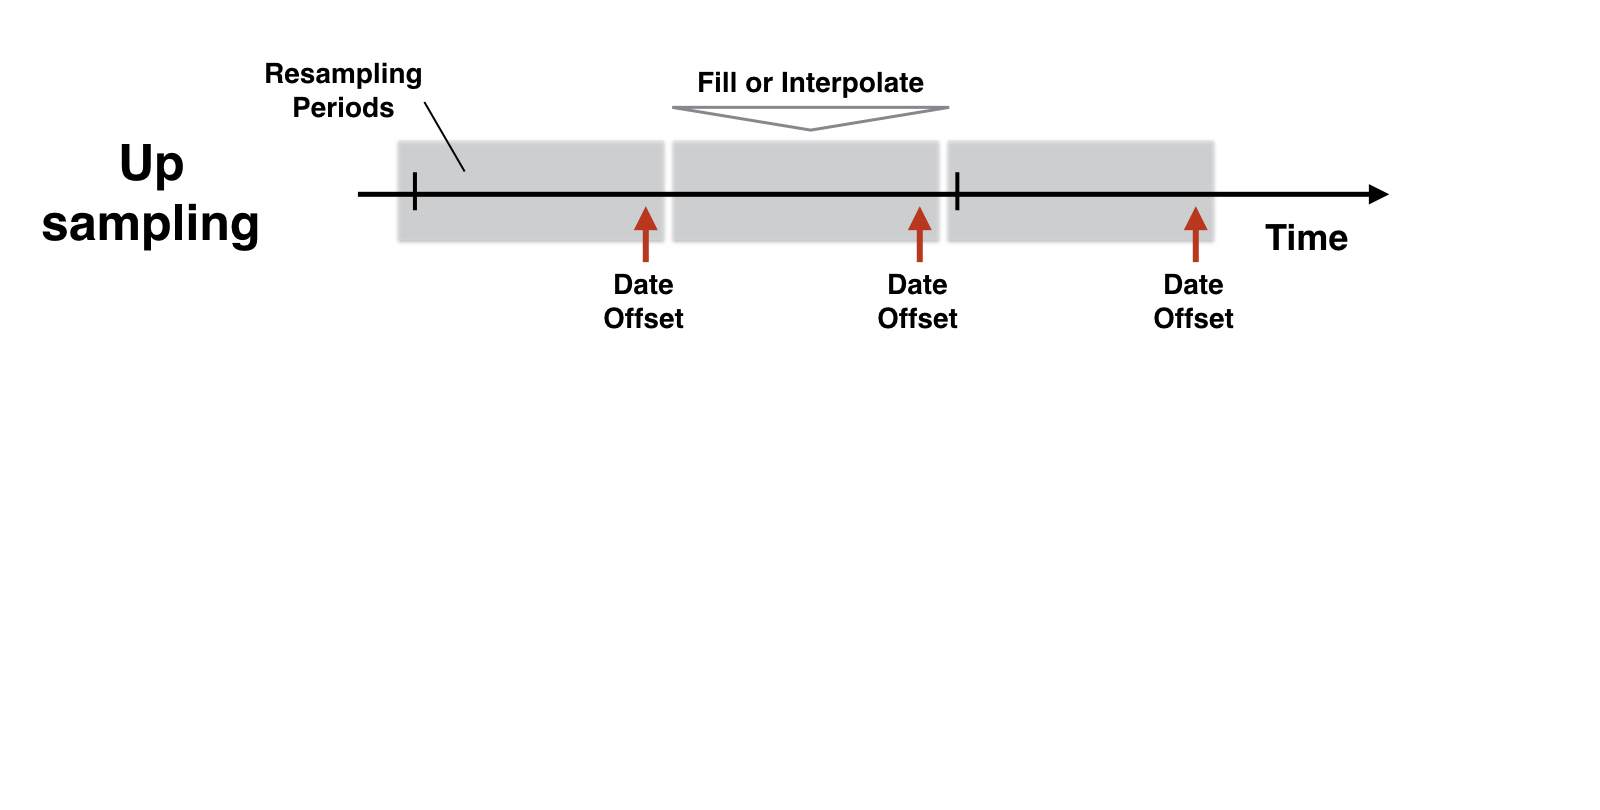
Yeniden örnekleme mantığı
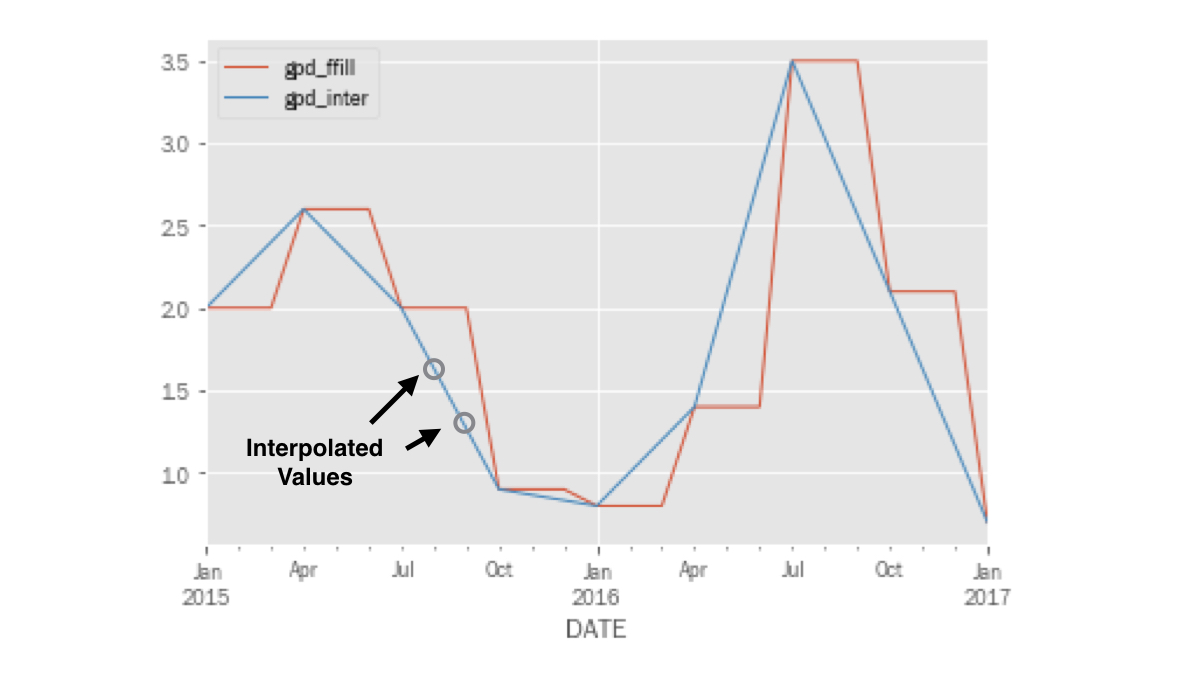
Enterpole edilmiş reel GSYİH büyümesini çizme
pd.concat([gdp_1, gdp_2], axis=1).loc['2015':].plot()
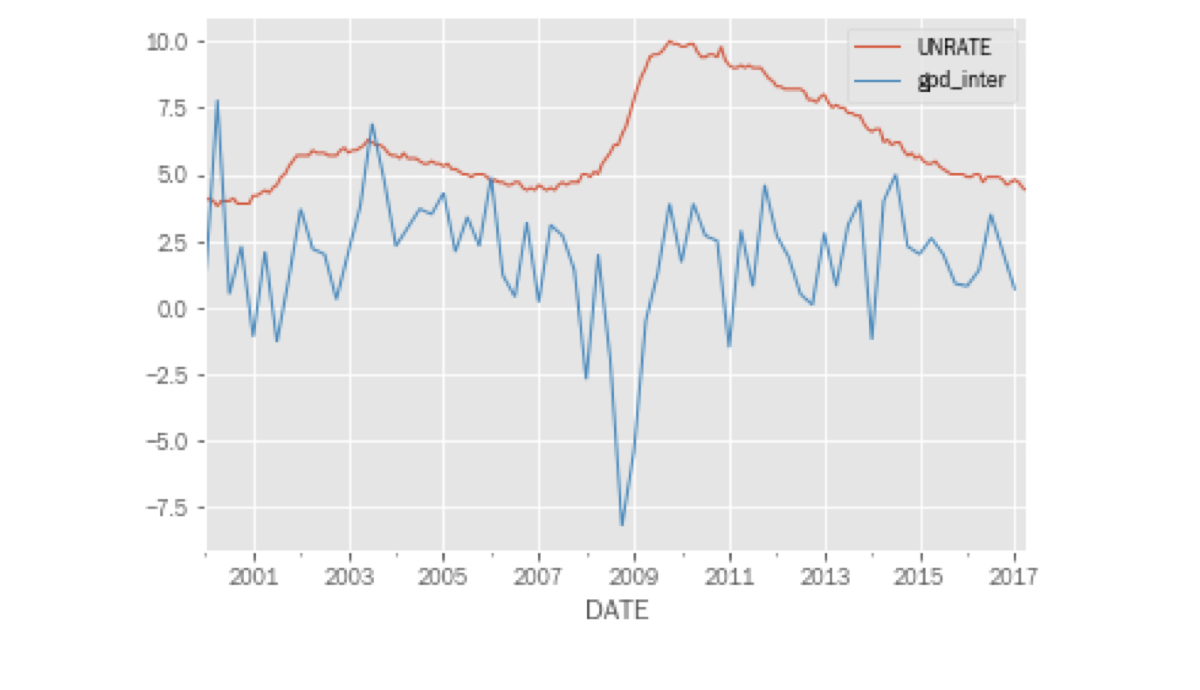
GSYİH büyümesi ve işsizliği birleştirme
pd.concat([unrate, gdp_inter], axis=1).plot();