ACF ve PACF’ye Giriş
Python'da ARIMA Modelleri

James Fulton
Climate informatics researcher
Güdüleme
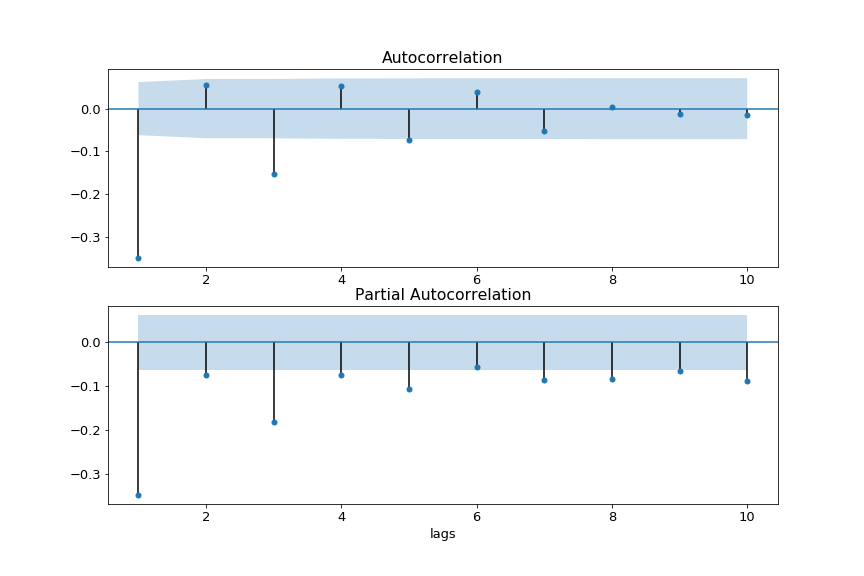
ACF nedir
PACF nedir
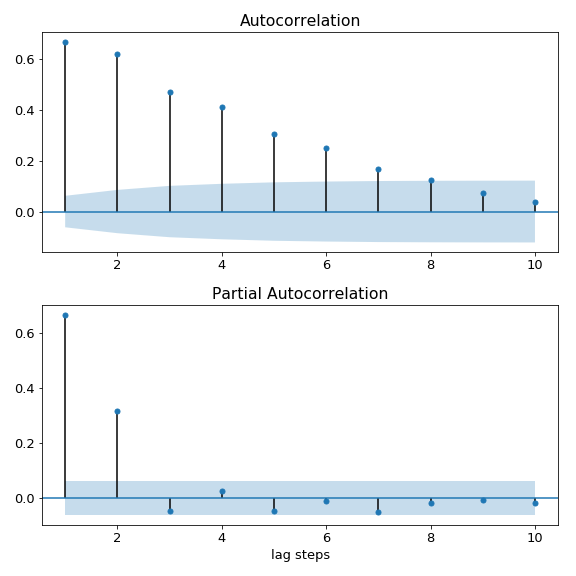
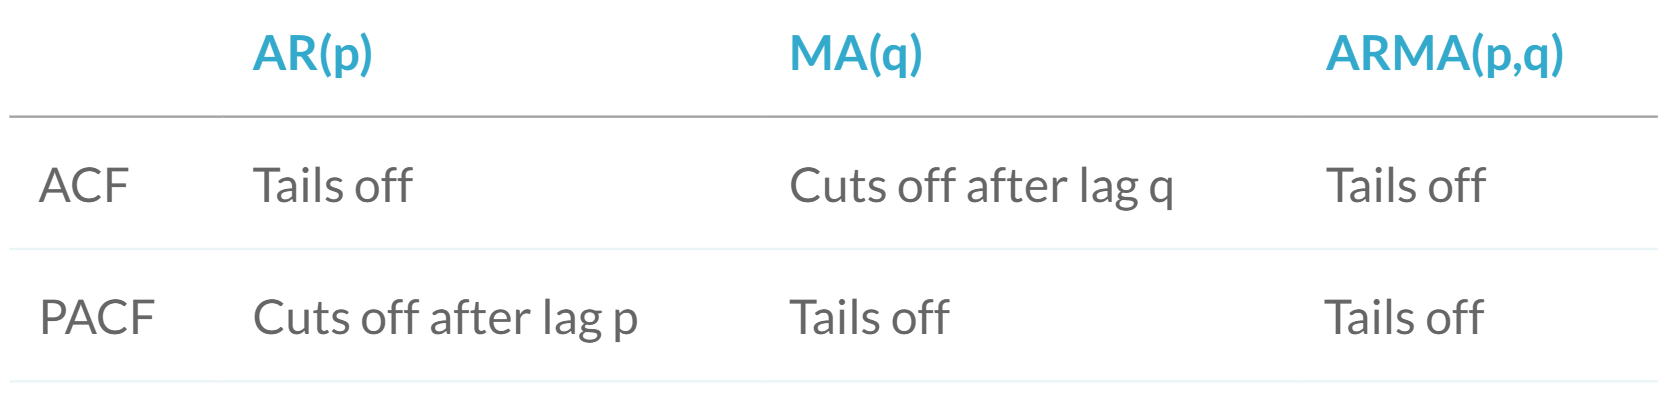
Model derecesini seçmek için ACF ve PACF kullanımı
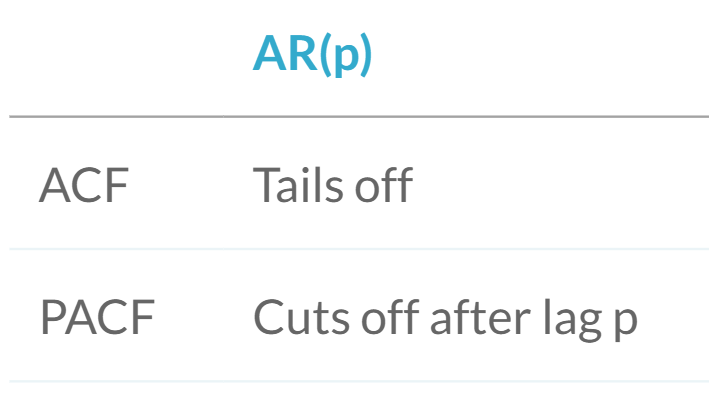
- AR(2) model $\rightarrow$
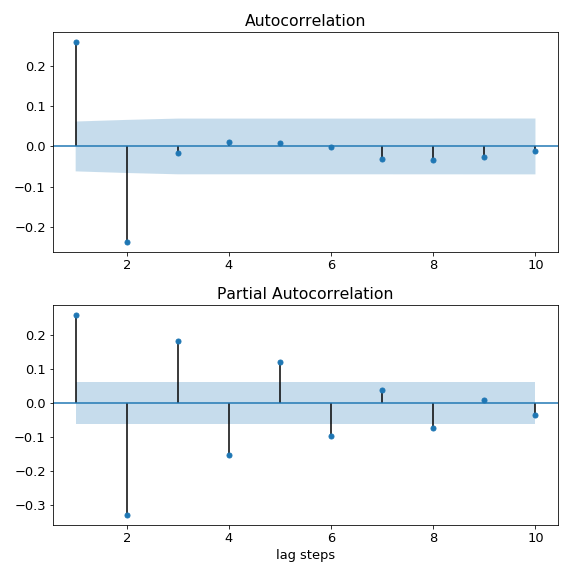
Model derecesini seçmek için ACF ve PACF kullanımı
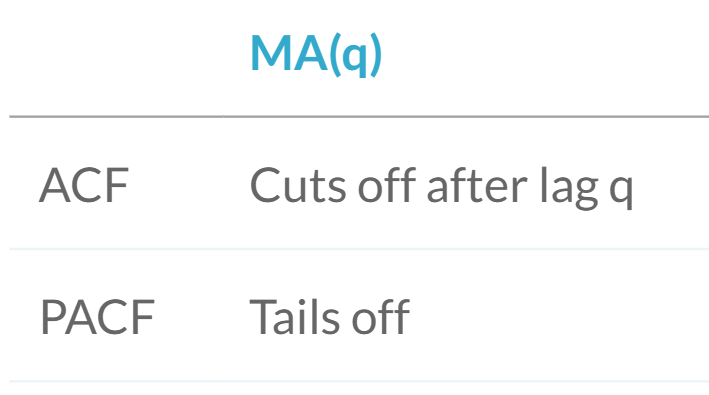
- MA(2) model $\rightarrow$
Model derecesini seçmek için ACF ve PACF kullanımı
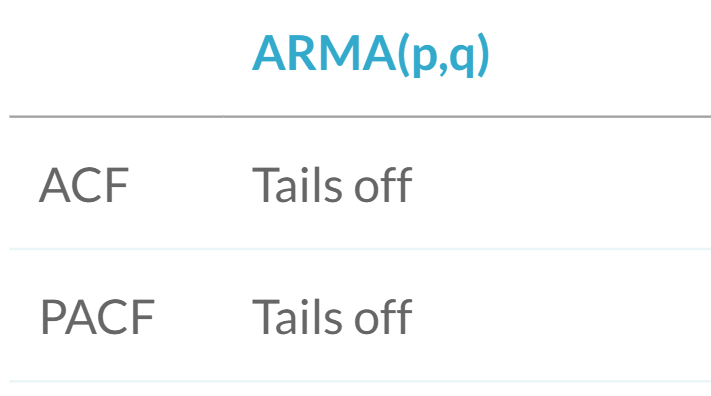
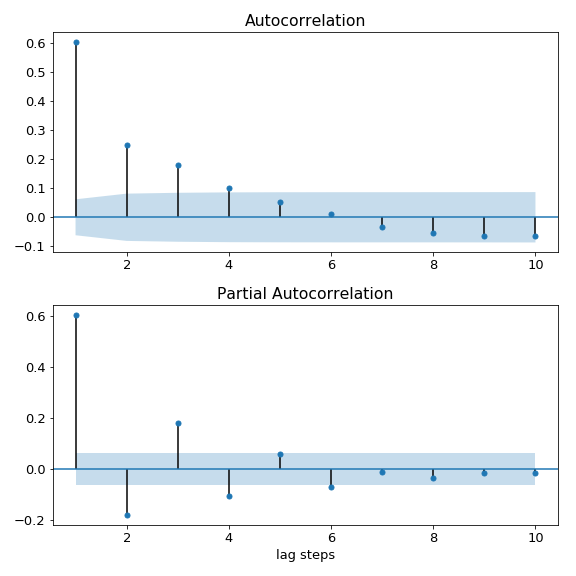
Model derecesini seçmek için ACF ve PACF kullanımı
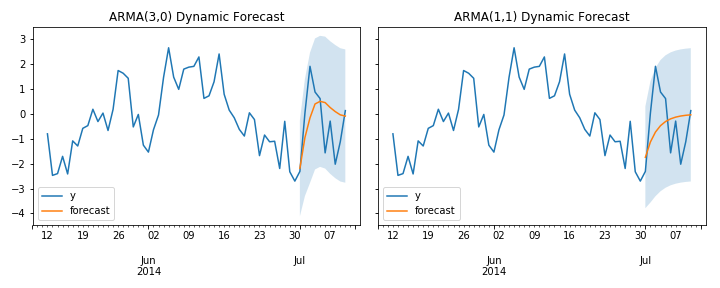
Python’da uygulama
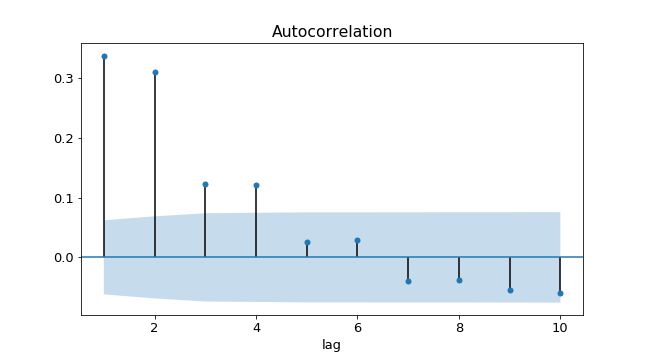
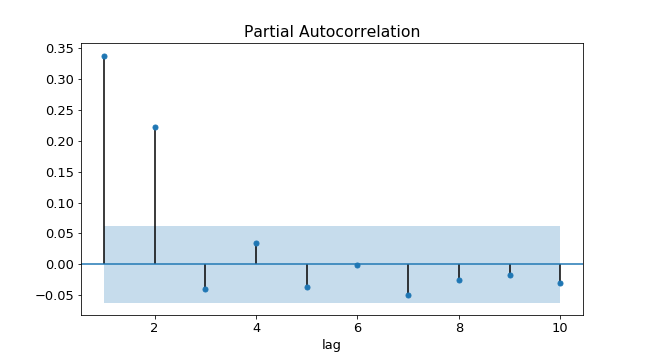
Aşırı/eksik fark alma ve ACF ile PACF
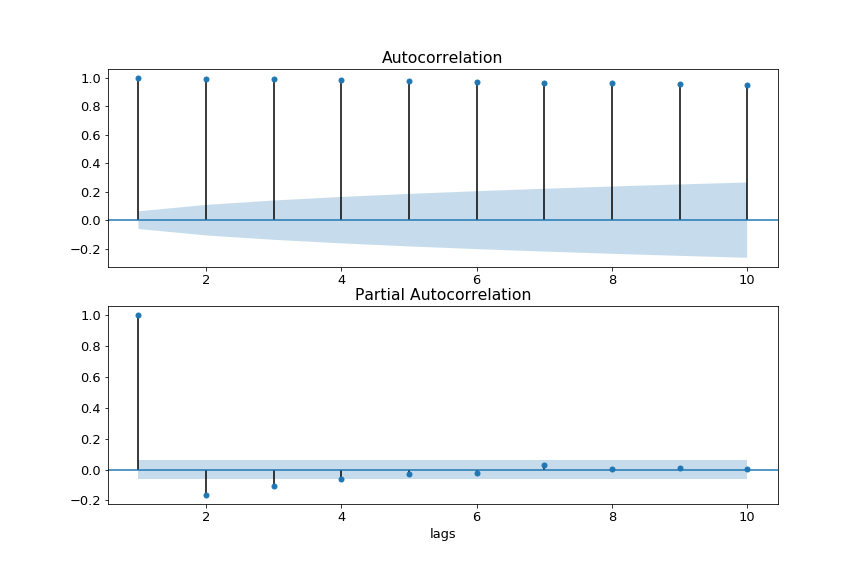
Aşırı/eksik fark alma ve ACF ile PACF