Kovaryans ve Pearson korelasyon katsayısı
Python ile İstatistiksel Düşünme (Bölüm 1)

Justin Bois
Teaching Professor at the California Institute of Technology
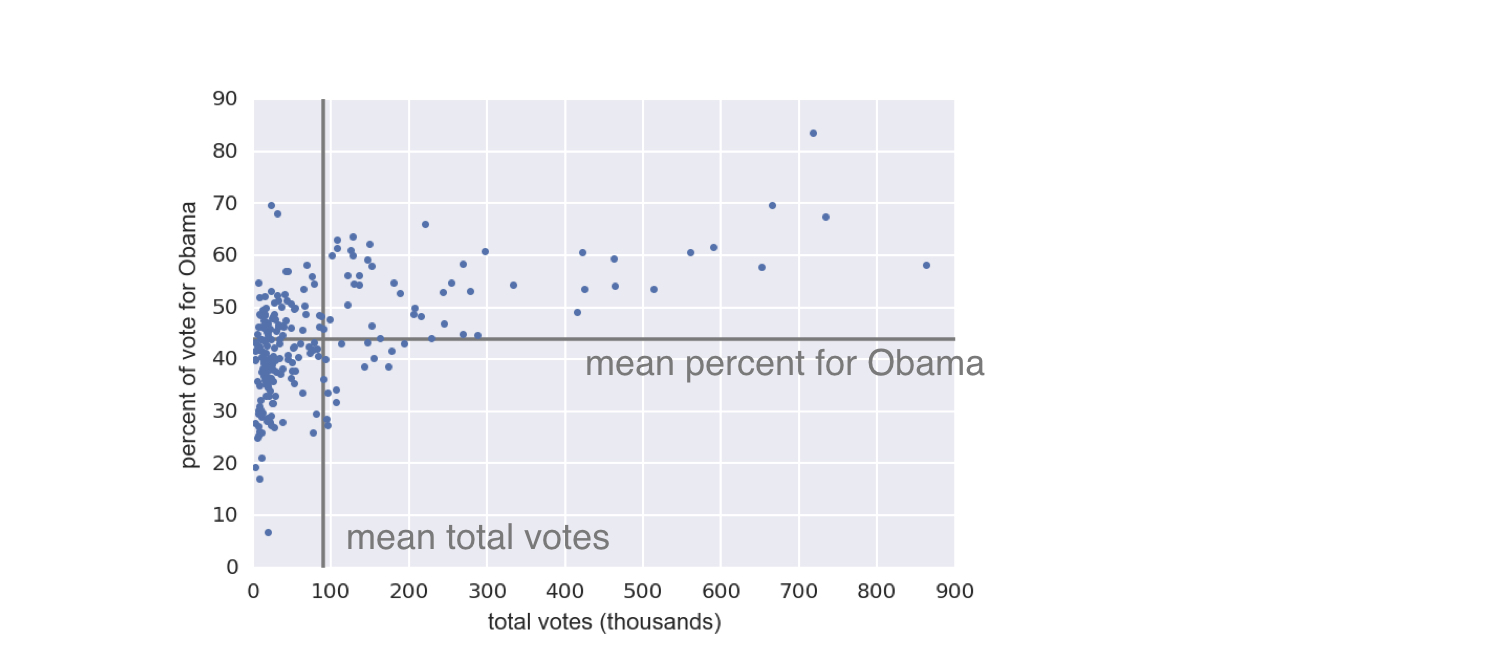
2008 ABD salıncak eyalet seçim sonuçları
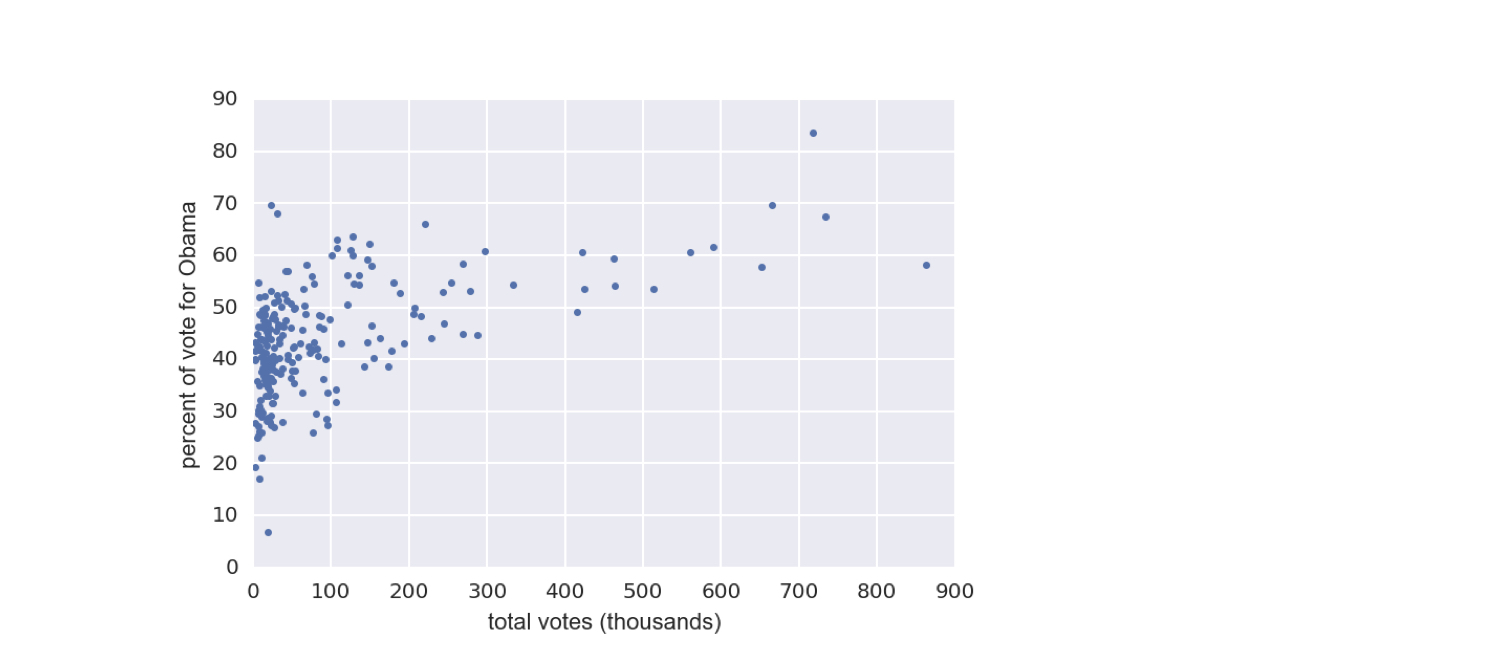
1 Veriler Data.gov'dan alınmıştır (https://www.data.gov/)
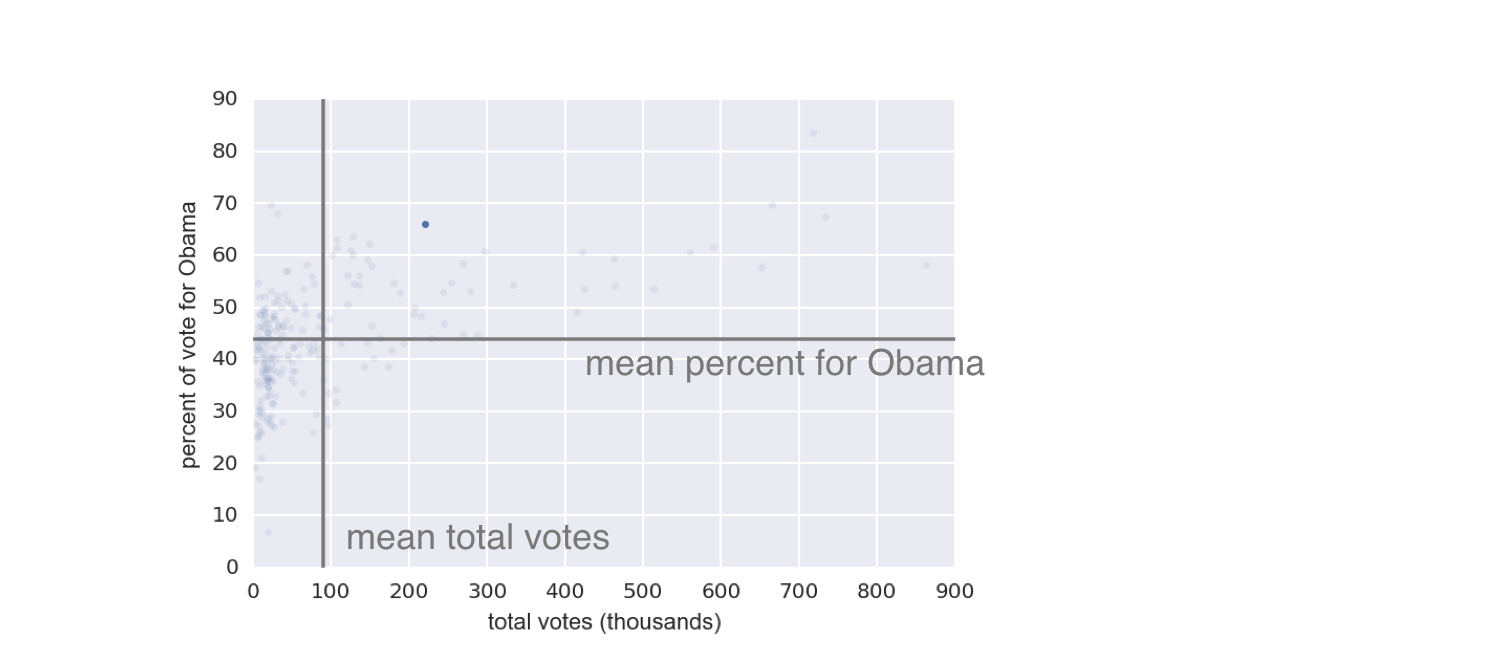
2008 ABD salıncak eyalet seçim sonuçları
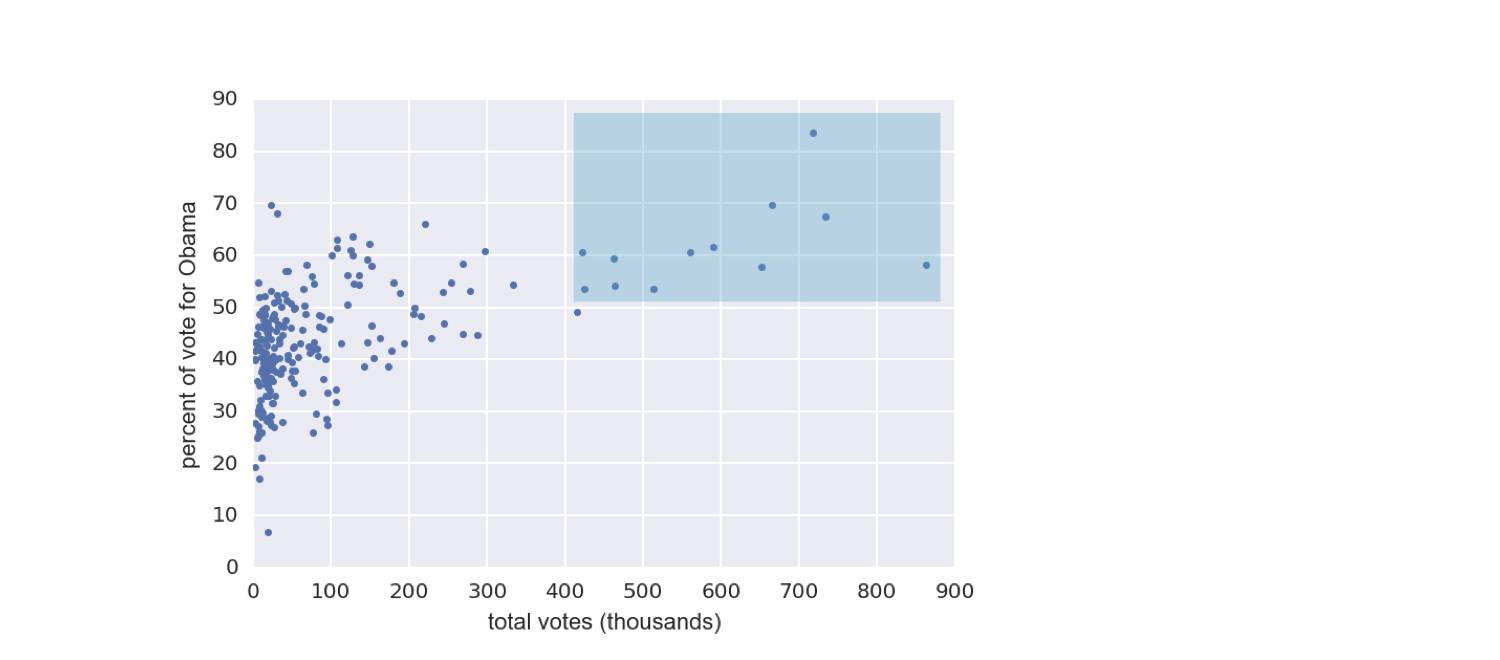
1 Veriler Data.gov'dan alınmıştır (https://www.data.gov/)
2008 ABD salıncak eyalet seçim sonuçları
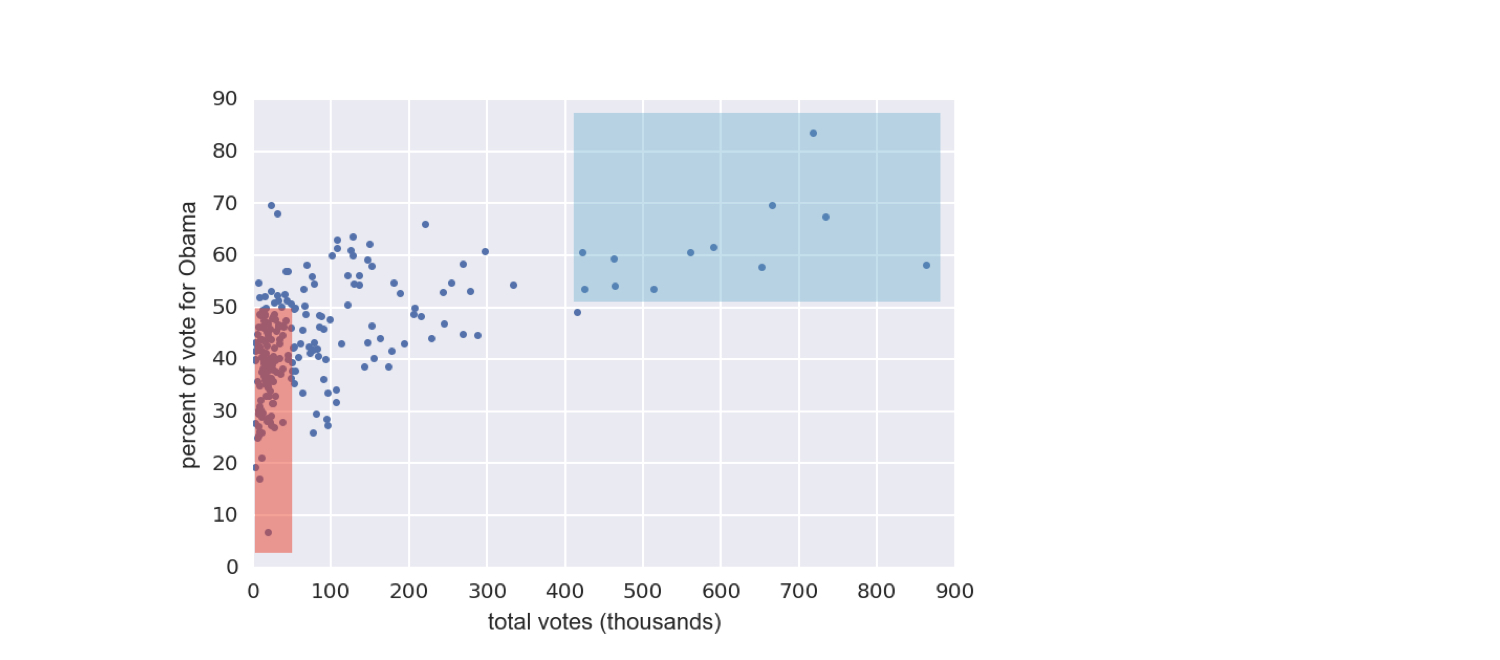
1 Veriler Data.gov'dan alınmıştır (https://www.data.gov/)
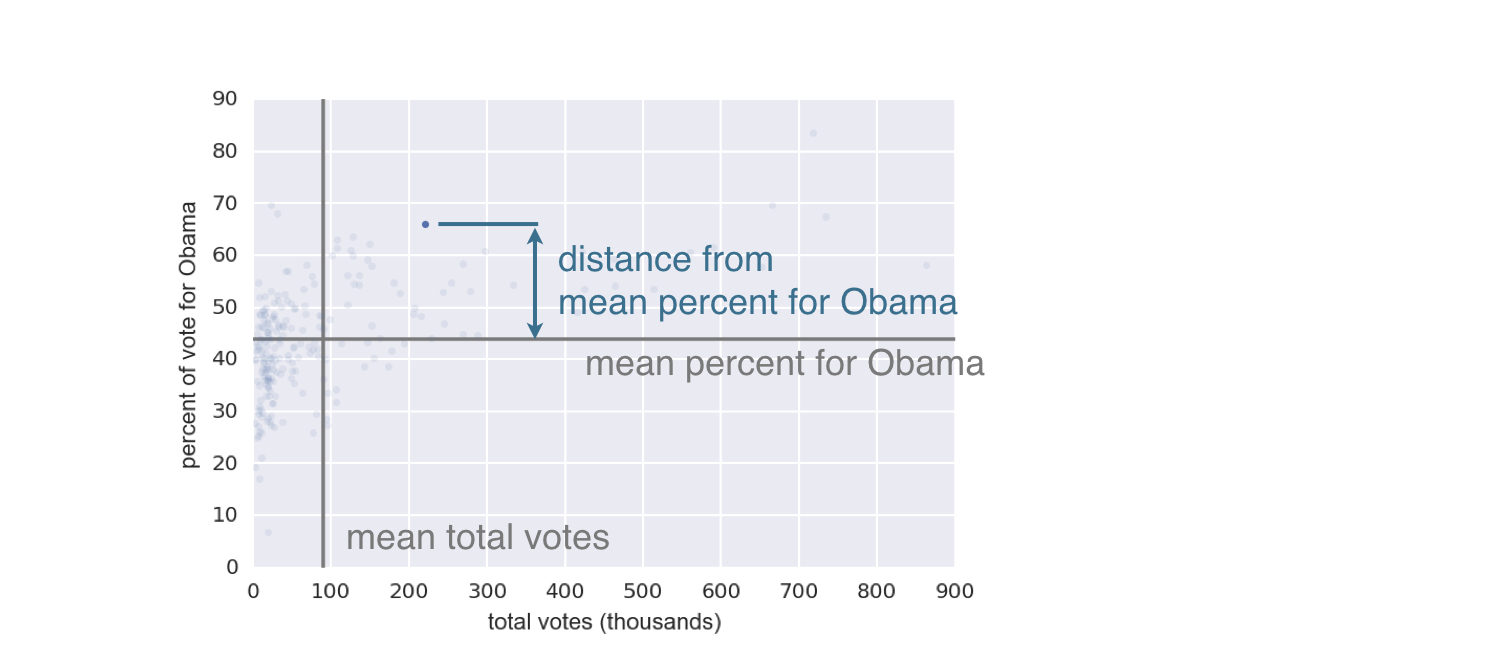
Kovaryansın hesaplanması
1 Veriler Data.gov'dan alınmıştır (https://www.data.gov/)
Kovaryansın hesaplanması
1 Veriler Data.gov'dan alınmıştır (https://www.data.gov/)
Kovaryansın hesaplanması
1 Veriler Data.gov'dan alınmıştır (https://www.data.gov/)
Kovaryansın hesaplanması
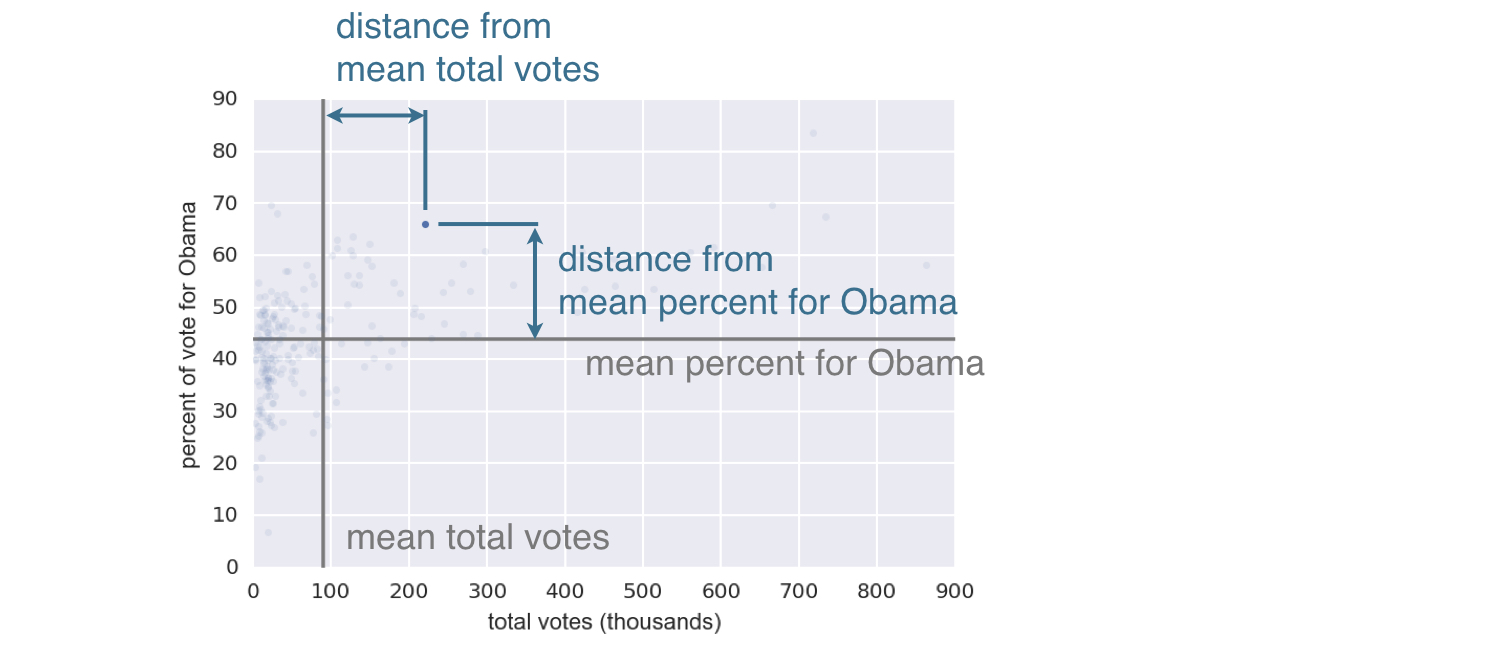
$$covariance = \frac{1}{n}\sum_{i=1}^{n}(x_i - \bar{x})(y_i - \bar{y})$$
1 Veriler Data.gov'dan alınmıştır (https://www.data.gov/)
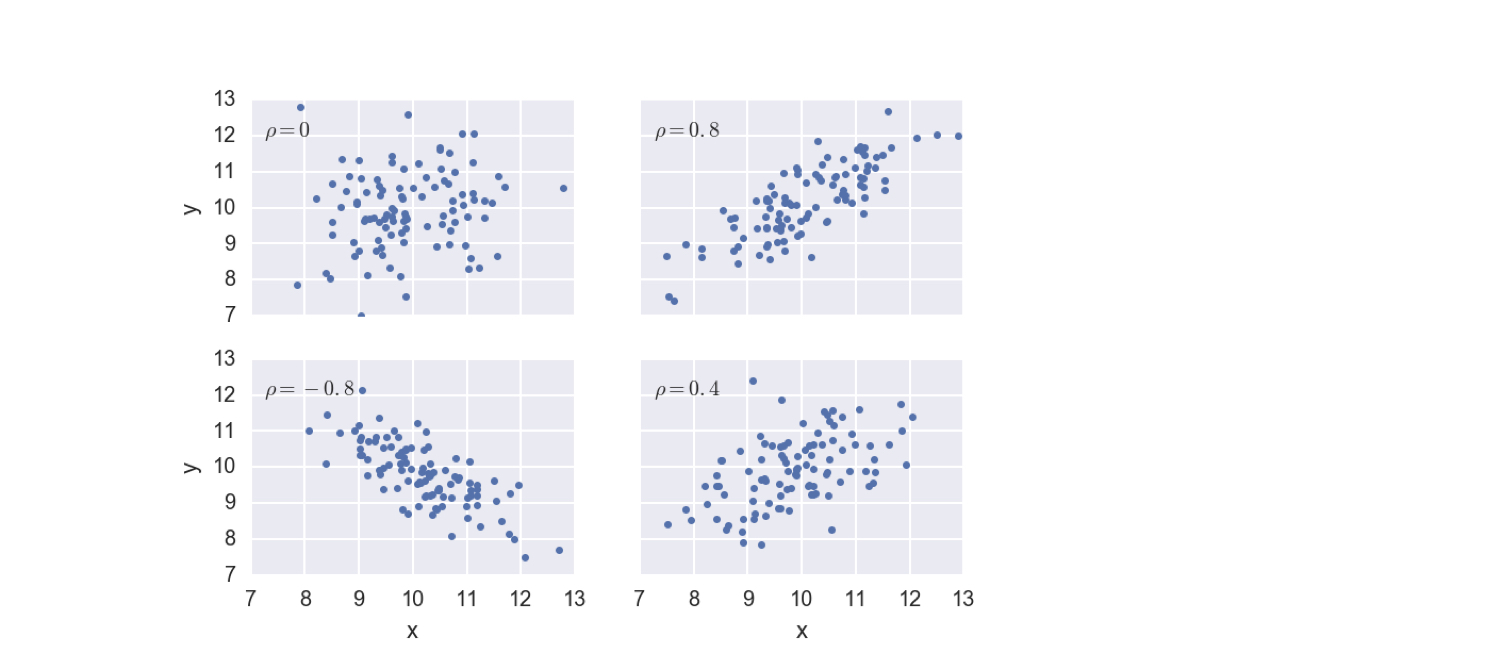
Pearson korelasyonuna örnekler