Yüzdelikler, aykırı değerler ve kutu grafikleri
Python ile İstatistiksel Düşünme (Bölüm 1)

Justin Bois
Teaching Professor at the California Institute of Technology
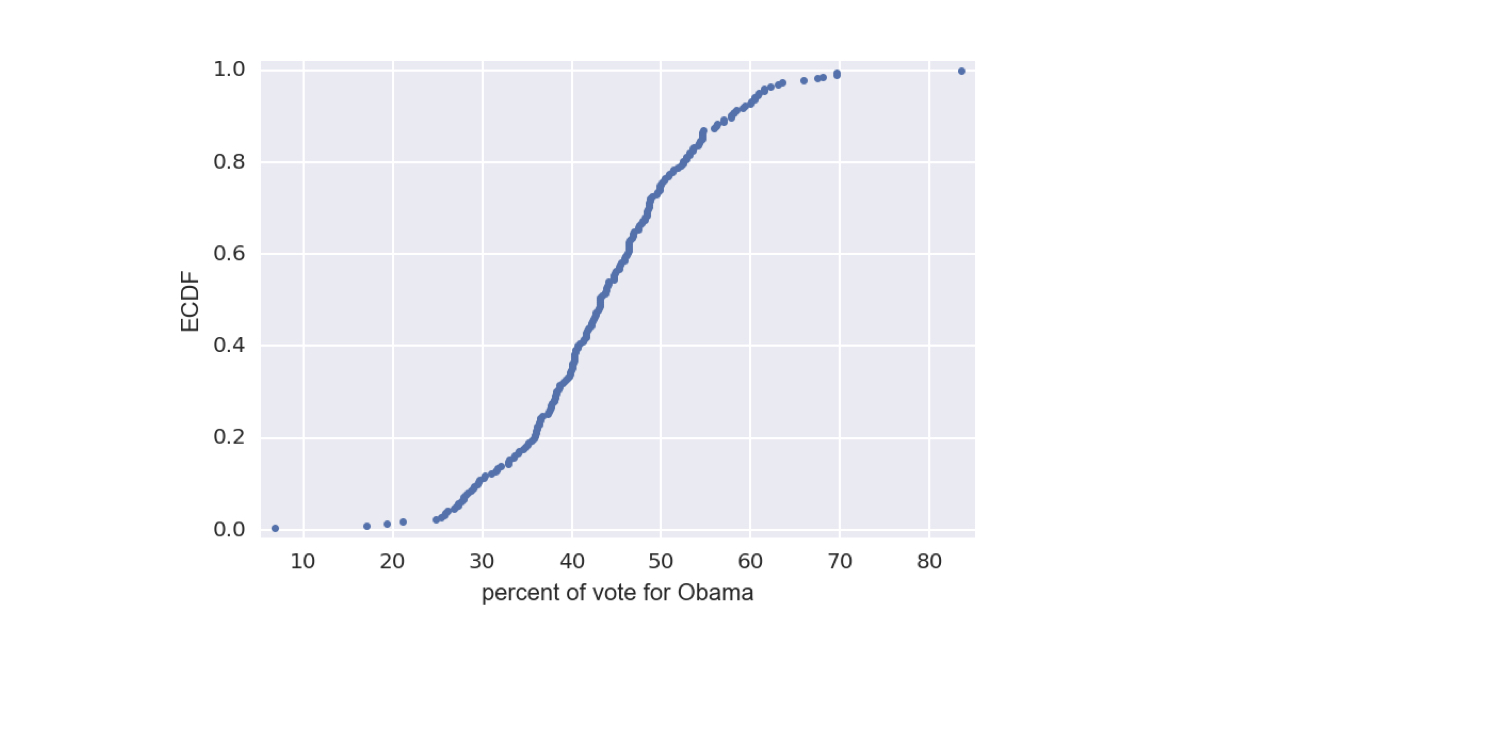
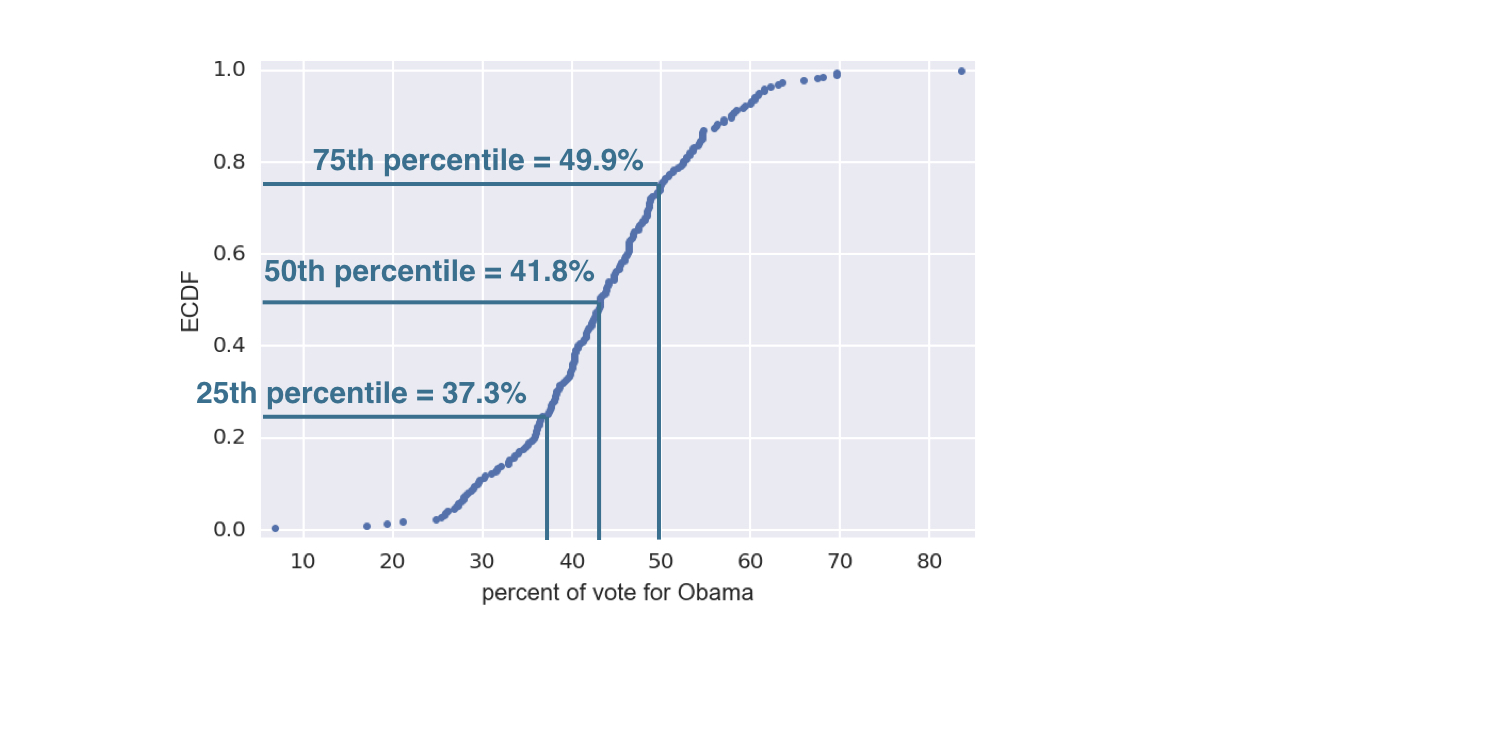
ECDF üzerinde yüzdelikler
1 Veriler Data.gov'dan alınmıştır (https://www.data.gov/)
ECDF üzerinde yüzdelikler
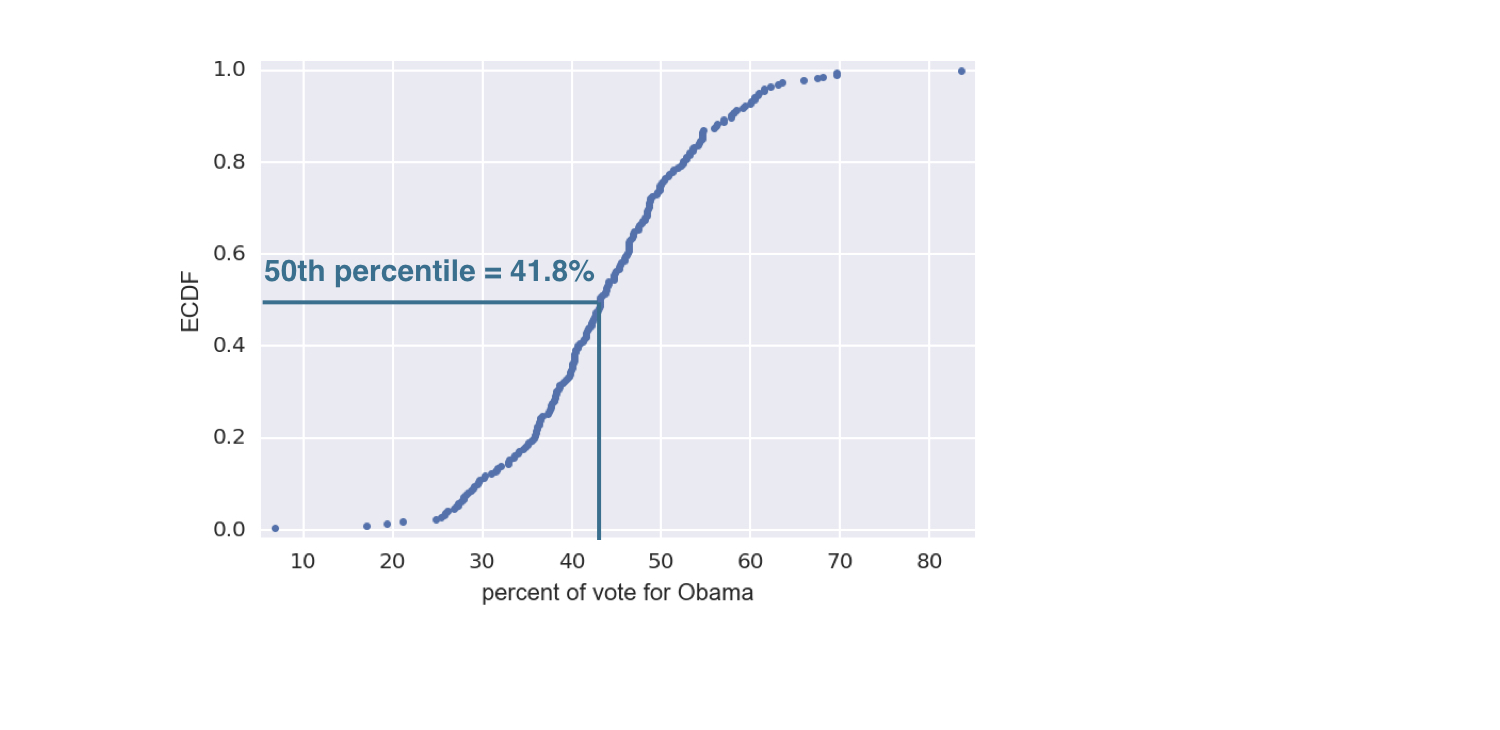
ECDF üzerinde yüzdelikler
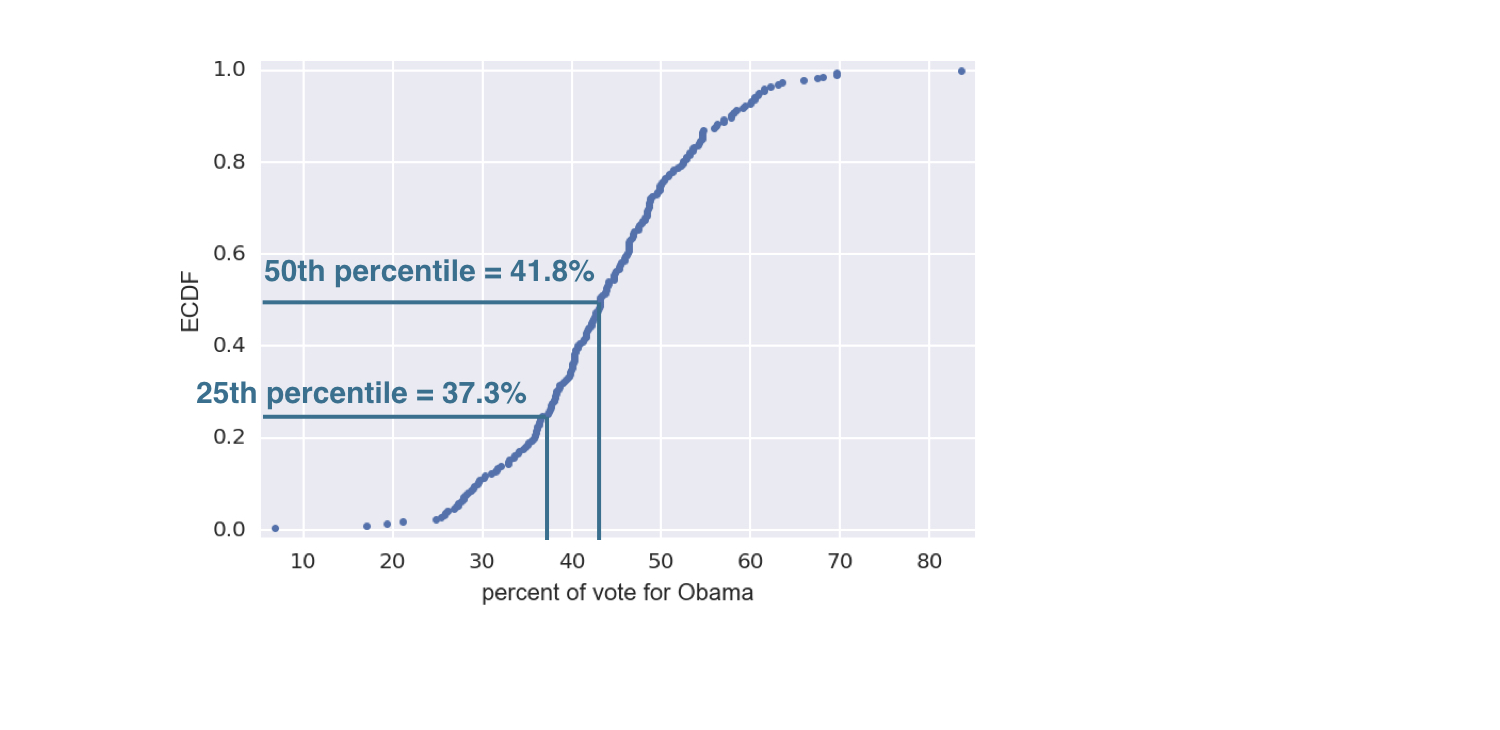
ECDF üzerinde yüzdelikler
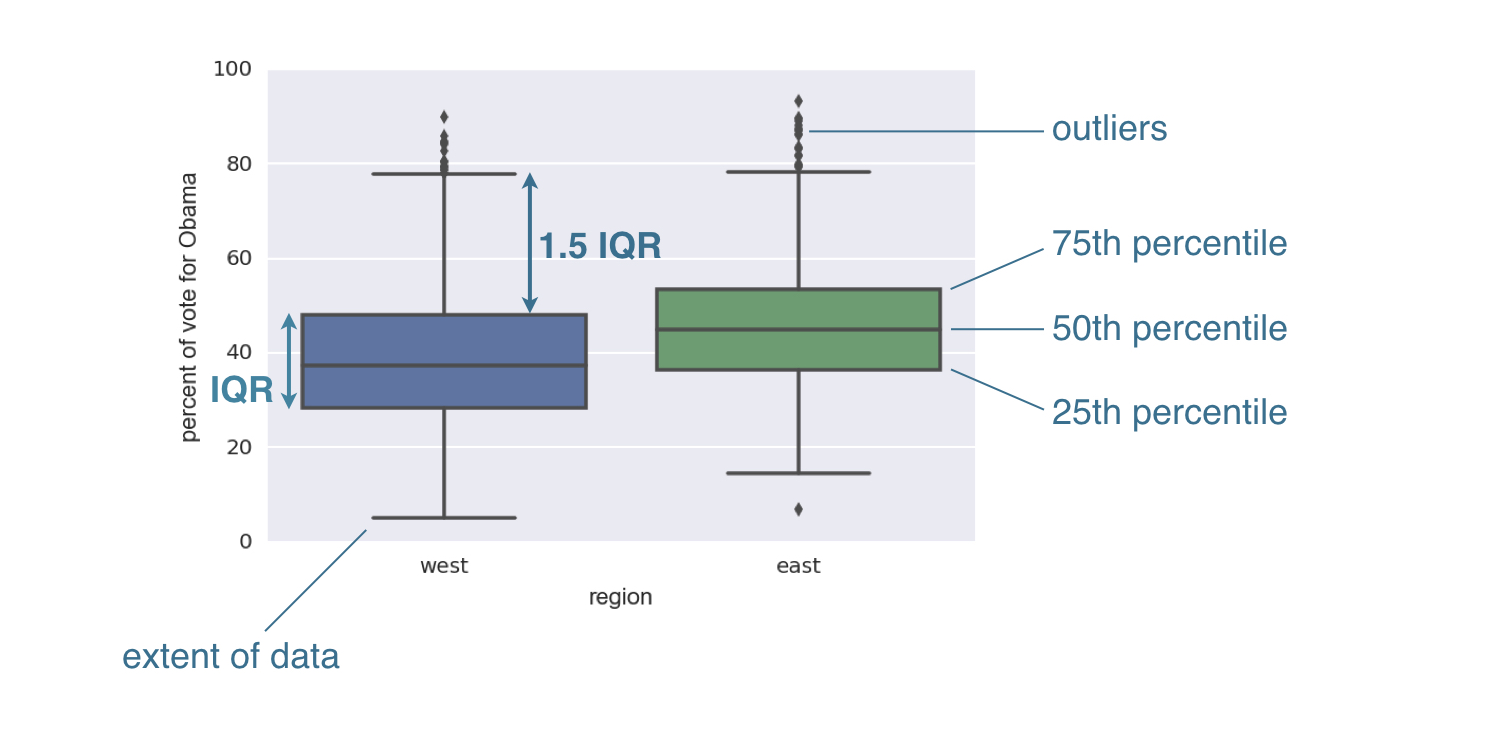
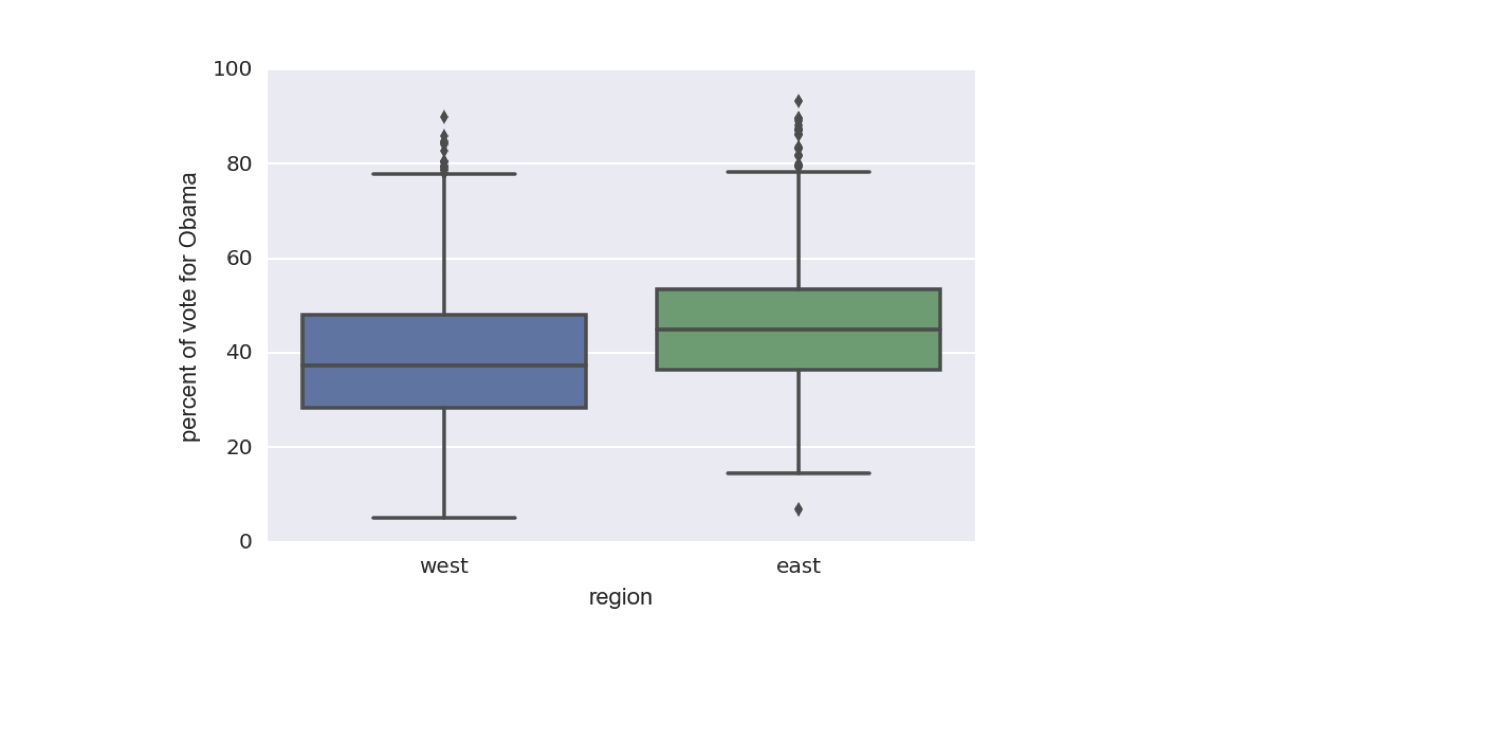
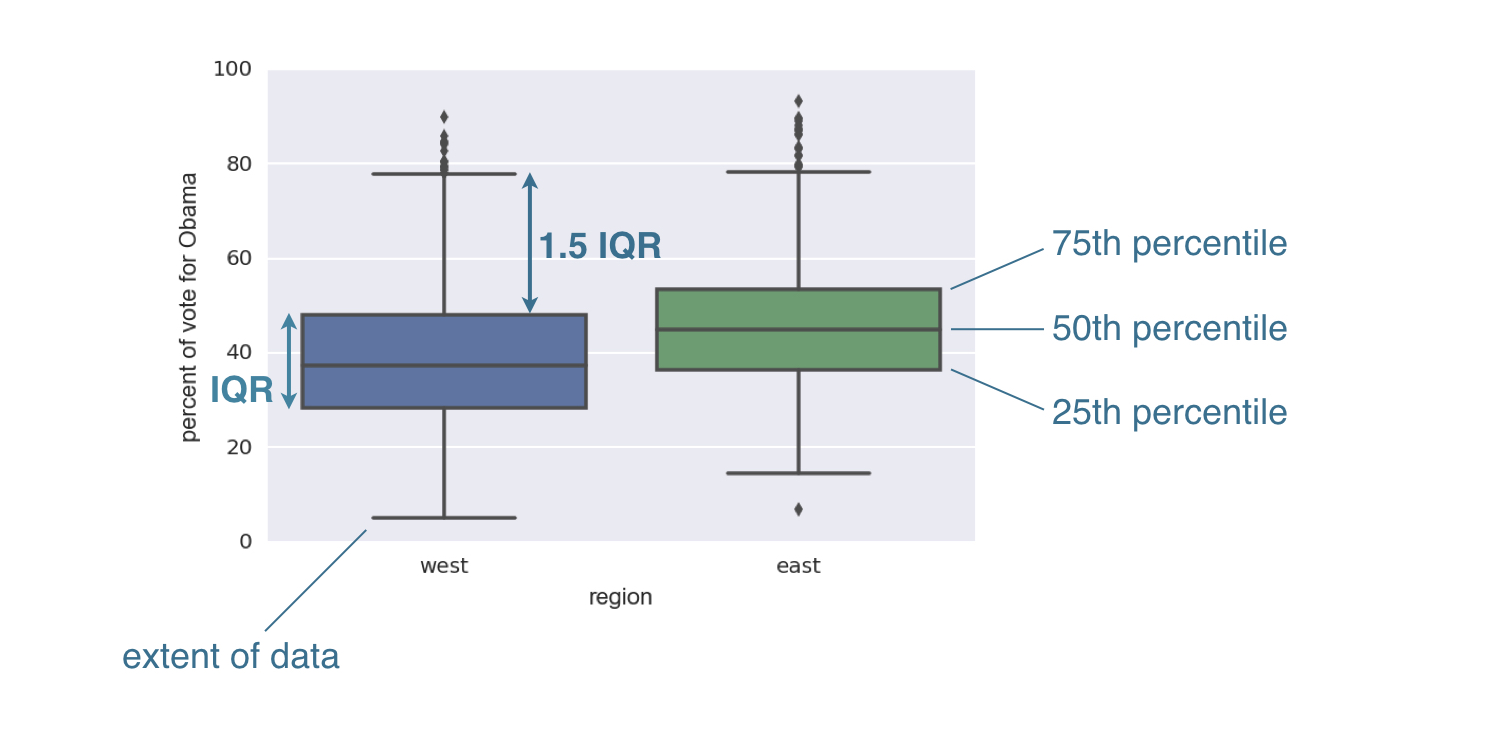
2008 ABD seçimi kutu grafiği
1 Veriler Data.gov'dan alınmıştır (https://www.data.gov/)
2008 ABD seçimi kutu grafiği
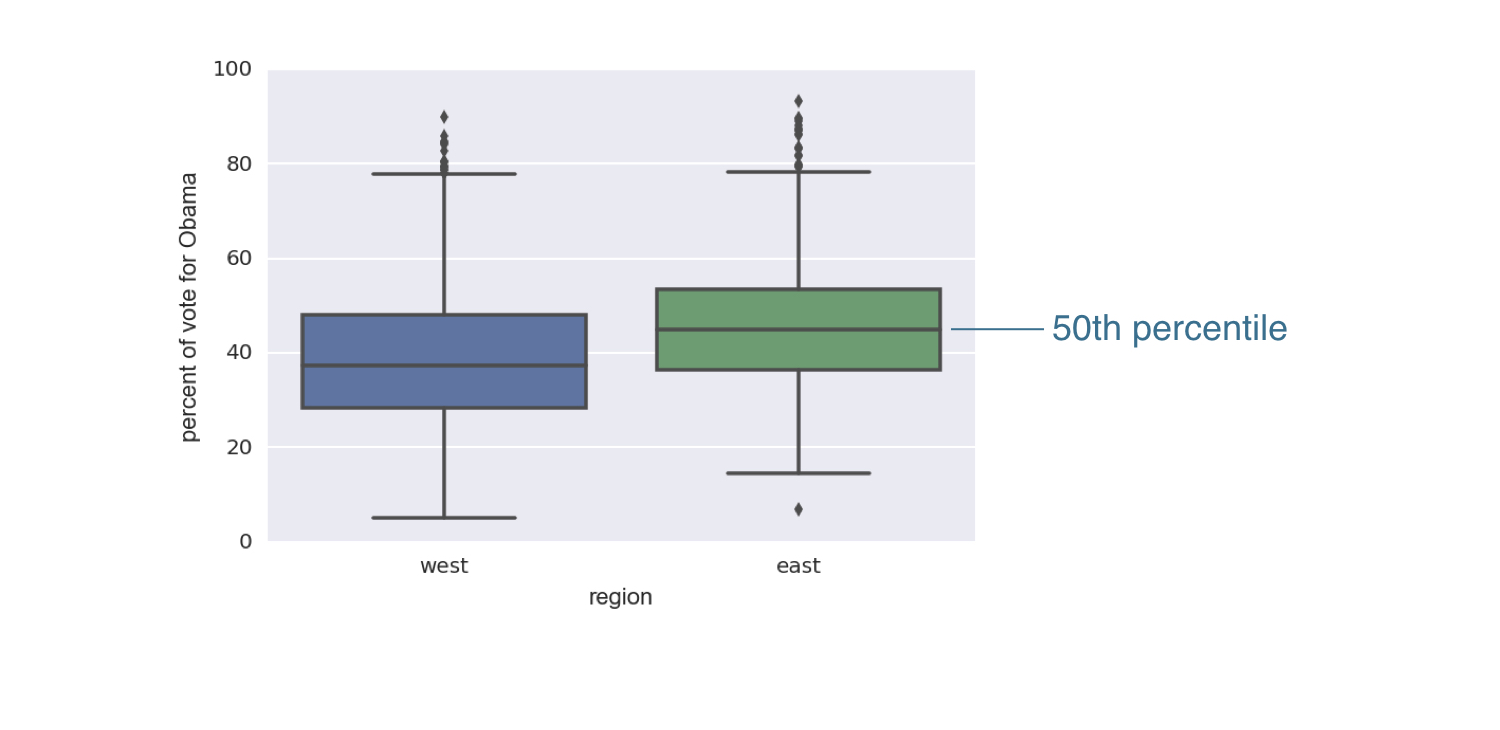
2008 ABD seçimi kutu grafiği

2008 ABD seçimi kutu grafiği
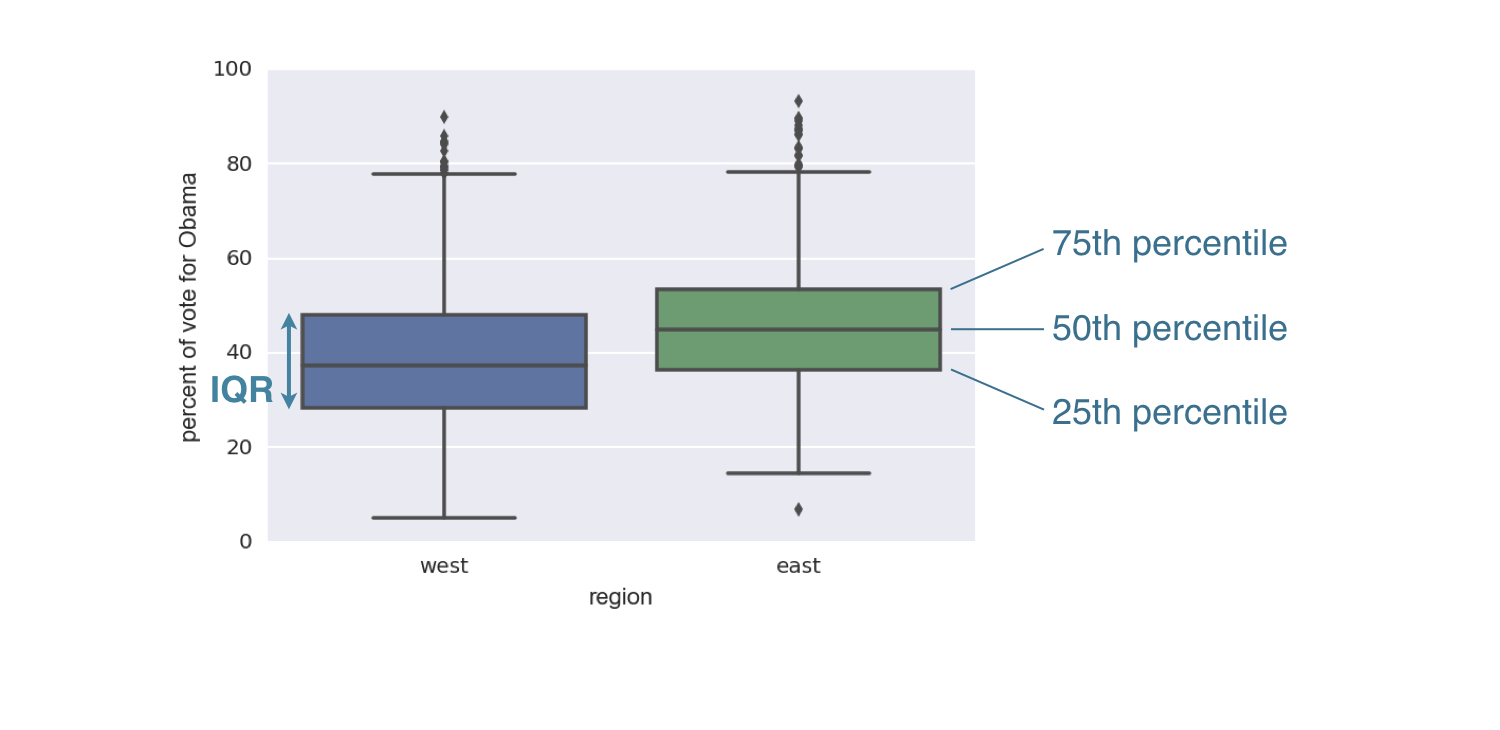
2008 ABD seçimi kutu grafiği
2008 ABD seçimi kutu grafiği