Histogram çizimi
Python ile İstatistiksel Düşünme (Bölüm 1)

Justin Bois
Teaching Professor at the California Institute of Technology
2008 ABD salıncak eyalet seçim sonuçları
Veriler Data.gov'dan alınmıştır (https://www.data.gov/)
2008 ABD salıncak eyalet seçim sonuçları
Veriler Data.gov'dan alınmıştır (https://www.data.gov/)
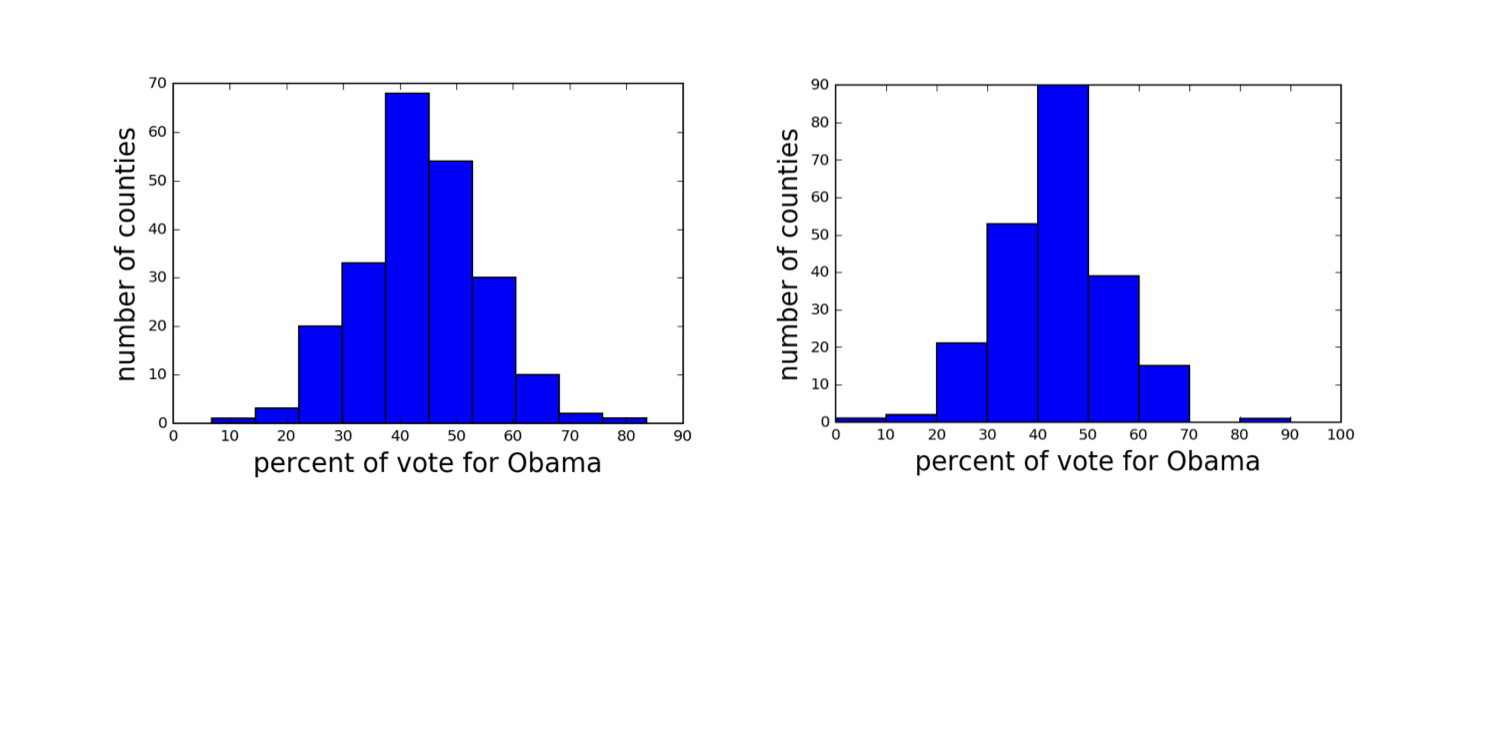
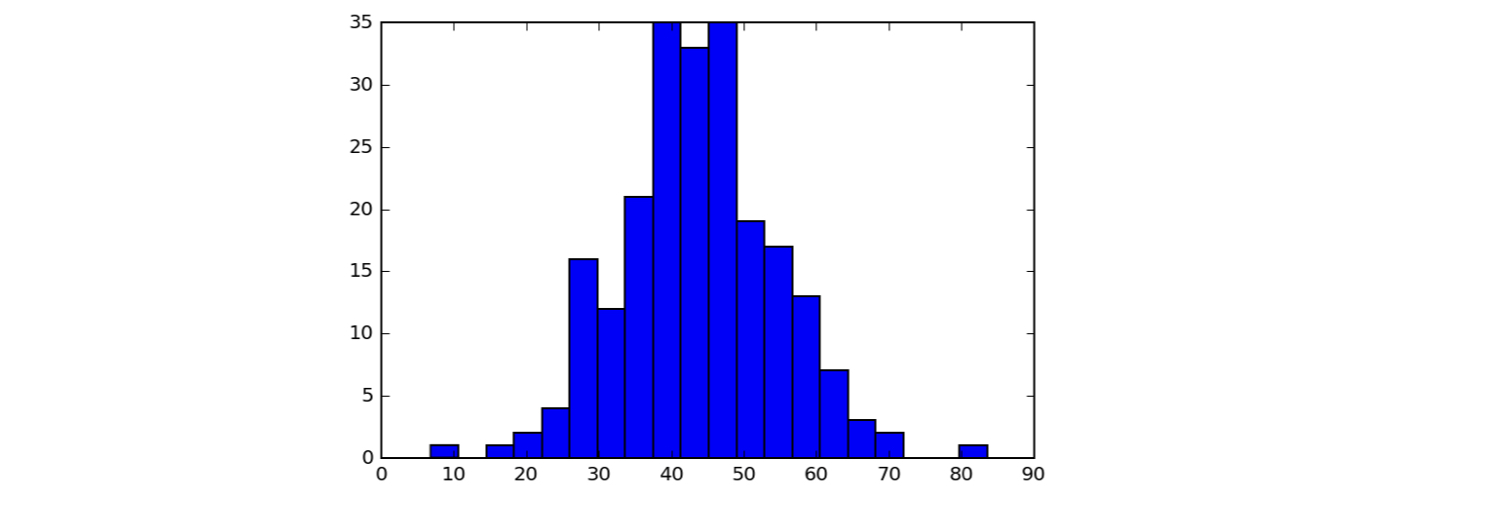
Farklı kutulamalı histogramlar
Veriler Data.gov'dan alınmıştır (https://www.data.gov/)
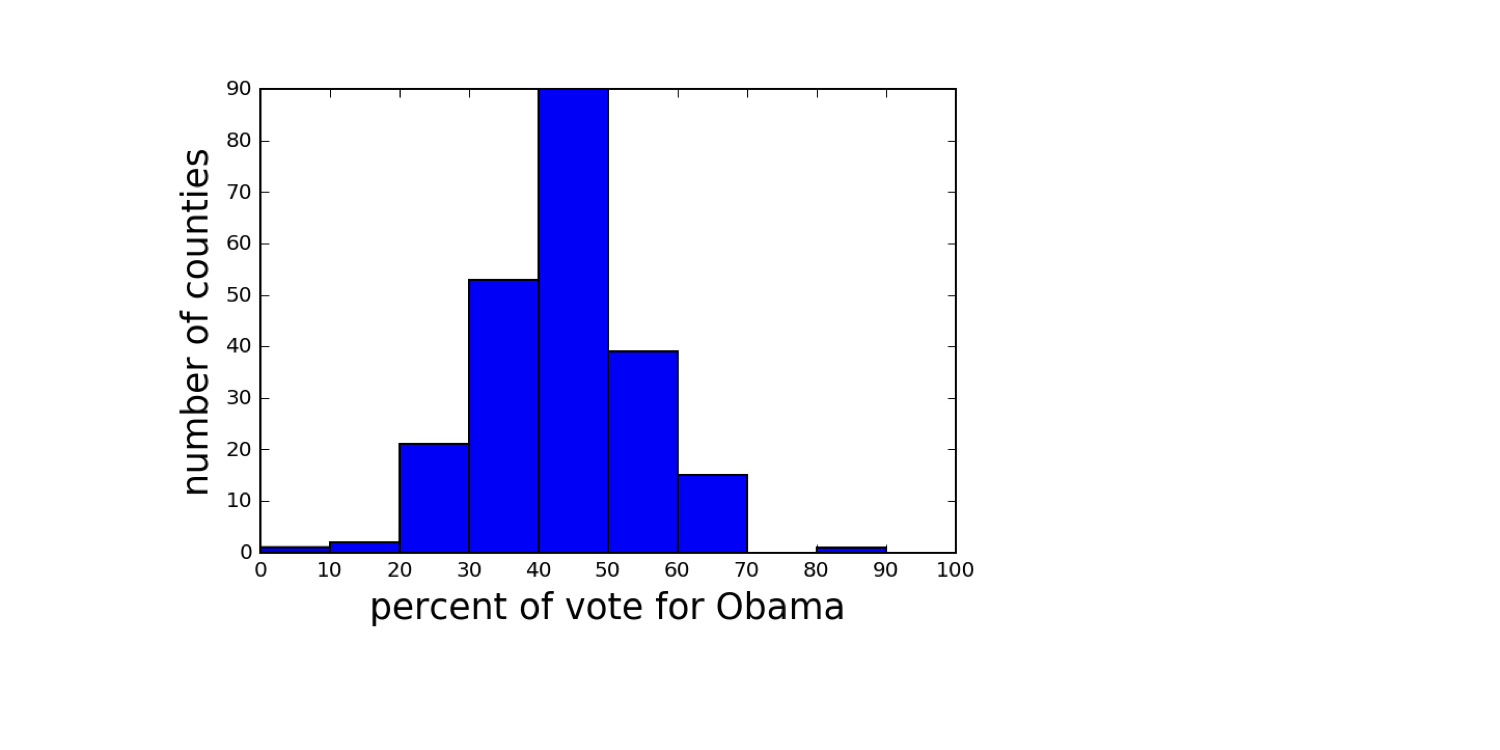
Histogramın kutularını ayarlama
bin_edges = [0, 10, 20, 30, 40, 50,
                60, 70, 80, 90, 100]
_ = plt.hist(df_swing['dem_share'], bins=bin_edges)
plt.show()
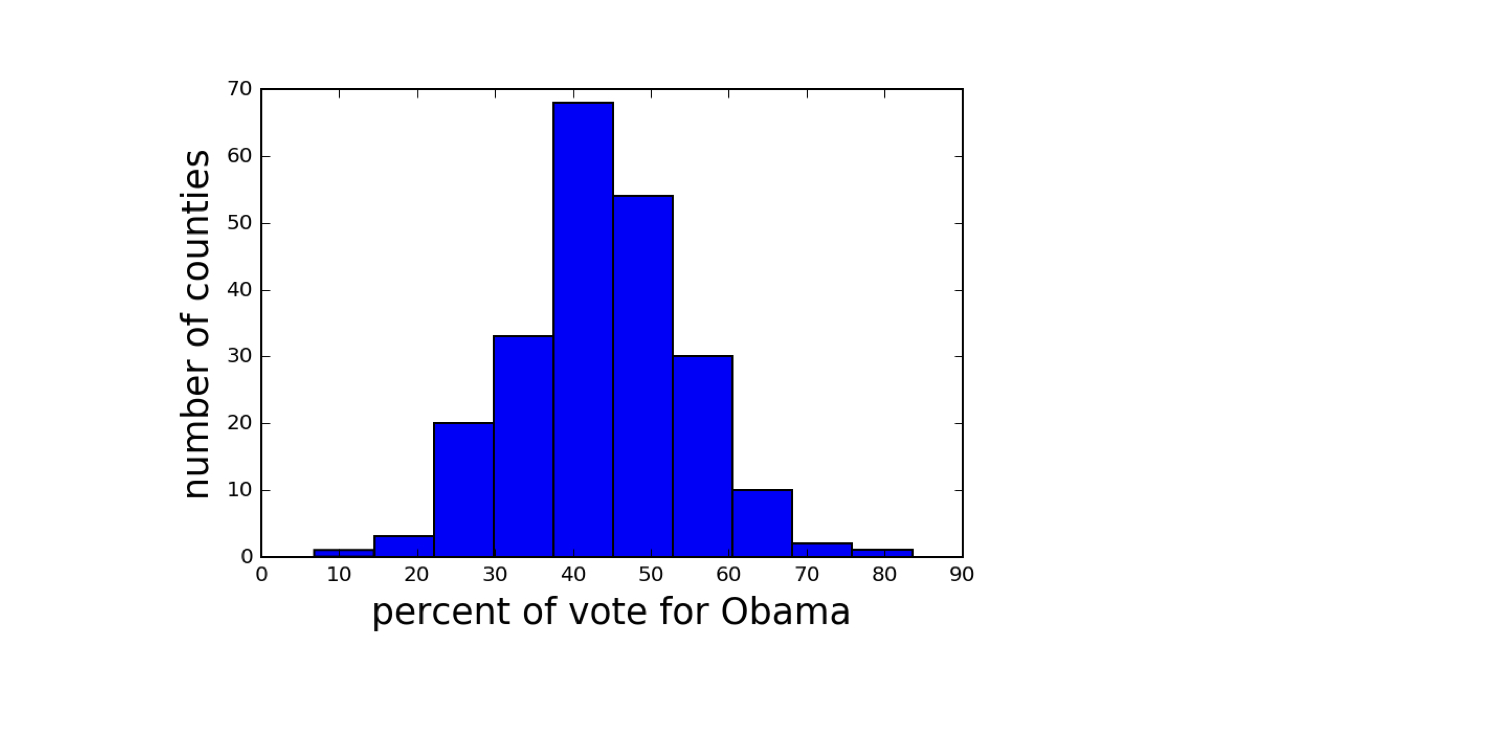
Histogramın kutularını ayarlama
_ = plt.hist(df_swing['dem_share'], bins=20)
plt.show()
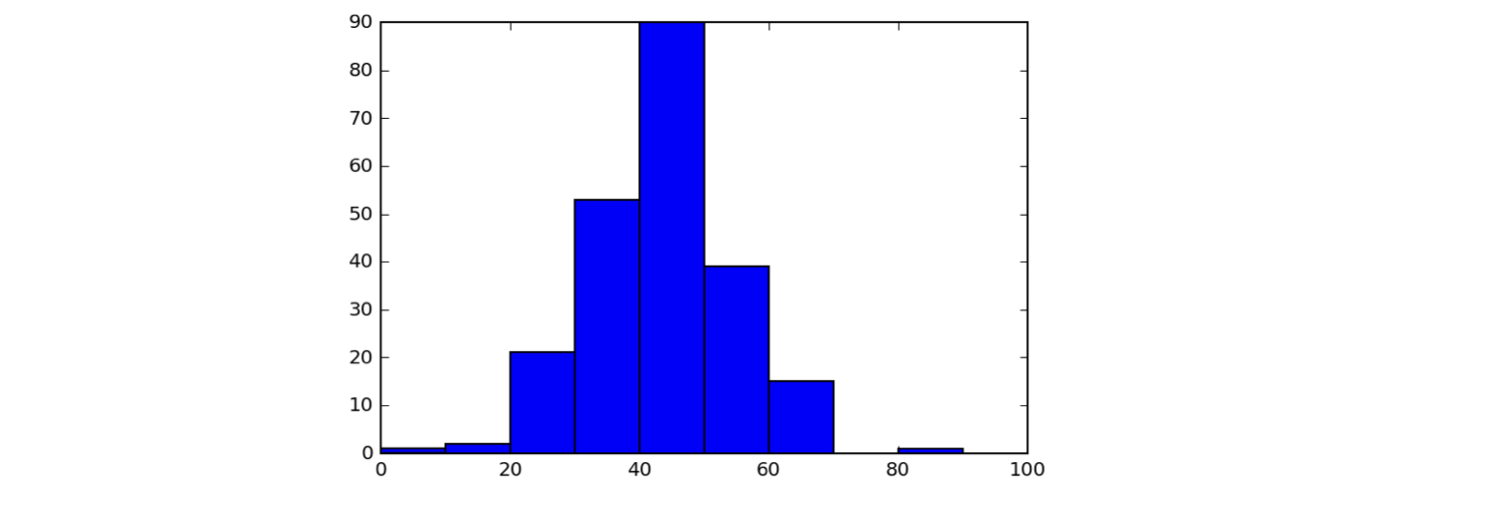
Seaborn stilli bir histogram
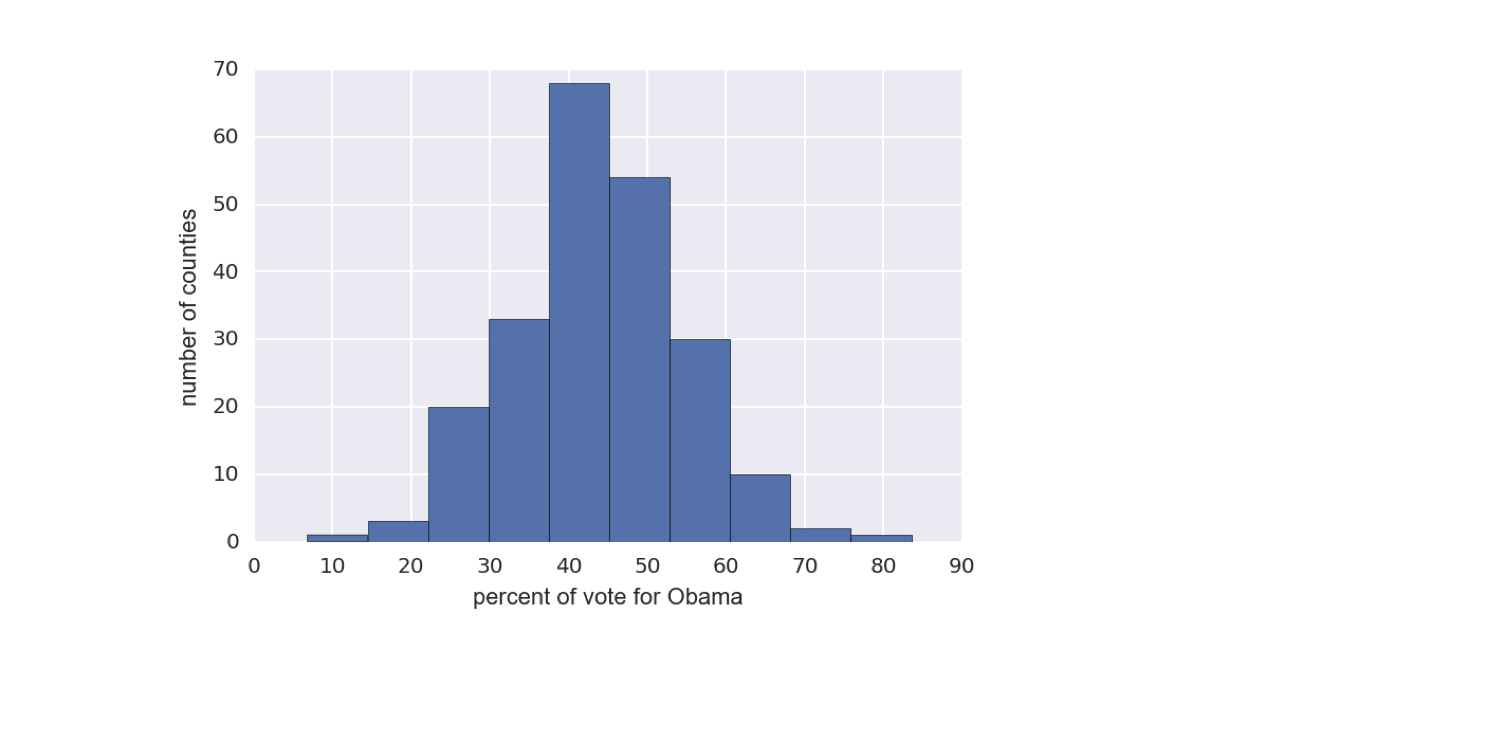
1 Veriler Data.gov'dan alınmıştır (https://www.data.gov/)

