Dash AG Grid etkileşimi
Dash ve Plotly ile Paneller Oluşturma

Alex Scriven
Data Scientist
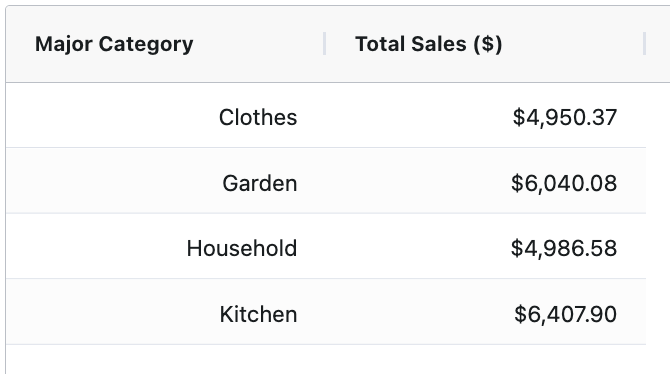
Tüm AG Grid hücrelerini biçimlendirme
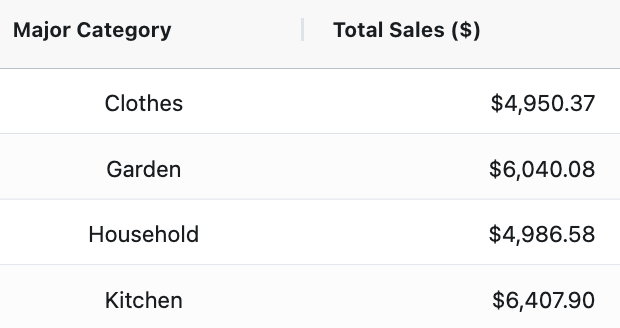
Bazı AG Grid hücrelerini biçimlendirme
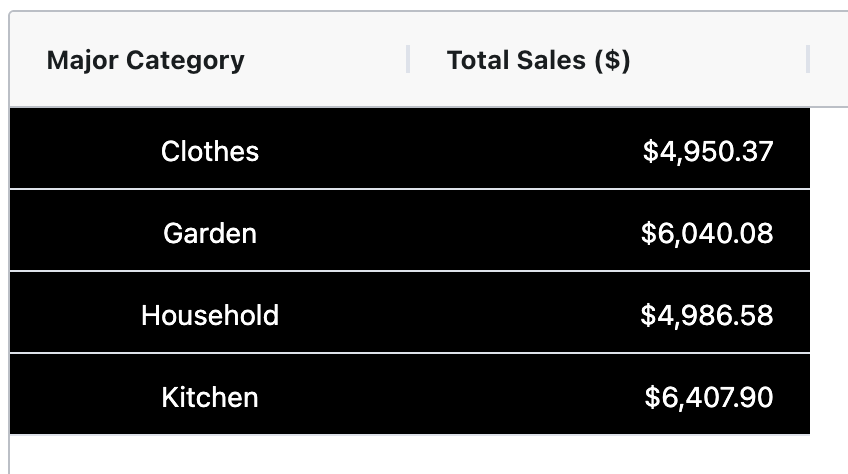
Diğer biçimlendirme örnekleri
$$
Hücre seçimi
Satır seçimi
Dash ve Plotly ile Paneller Oluşturma
Alex Scriven
Data Scientist
$$

