Trend göstergesi HO'lar

Python ile Finansal Alım Satım

Chelsea Yang

Data Science Instructor

Teknik göstergeler nedir?

  • Geçmiş piyasa verilerine dayalı matematiksel hesaplamalar
  • Piyasanın etkin olduğunu ve fiyatın tüm kamu bilgilerini içerdiğini varsayar
  • Geçmiş fiyat kalıplarına dair içgörü sağlar
Python ile Finansal Alım Satım

Göstergelerin türleri

  • Trend göstergeleri: bir trendin yönünü veya gücünü ölçer
    • Örnek: Hareketli ortalamalar (HO), Ortalama Yönsel Hareket Endeksi (ADX)
  • Momentum göstergeleri: fiyat hareketinin hızını ölçer
    • Örnek: Göreli Güç Endeksi (RSI)
  • Volatilite göstergeleri: fiyat sapmalarının büyüklüğünü ölçer
    • Örnek: Bollinger Bantları
Python ile Finansal Alım Satım

TA-Lib paketi

TA-Lib : Technical Analysis Library

  • 150+ teknik gösterge uygulaması içerir
import talib
Python ile Finansal Alım Satım

Hareketli ortalama göstergeleri

  • SMA: Basit Hareketli Ortalama
  • EMA: Üssel Hareketli Ortalama


  • Özellikler:
    • Fiyatla birlikte hareket eder
    • Yönü daha iyi göstermek için veriyi yumuşatır
Python ile Finansal Alım Satım

Basit Hareketli Ortalama (SMA)

$ SMA = (P_1+P_2+...+P_n)/n $

# Calculate two SMAs
stock_data['SMA_short'] = talib.SMA(stock_data['Close'], timeperiod=10)
stock_data['SMA_long'] = talib.SMA(stock_data['Close'], timeperiod=50)

# Print the last five rows print(stock_data.tail())
             Close  SMA_short  SMA_long
Date                                   
2020-11-24 1768.88    1758.77   1594.74
2020-11-25 1771.43    1760.65   1599.75
2020-11-27 1793.19    1764.98   1605.70
2020-11-30 1760.74    1763.35   1611.71
2020-12-01 1798.10    1765.02   1619.05

Python ile Finansal Alım Satım

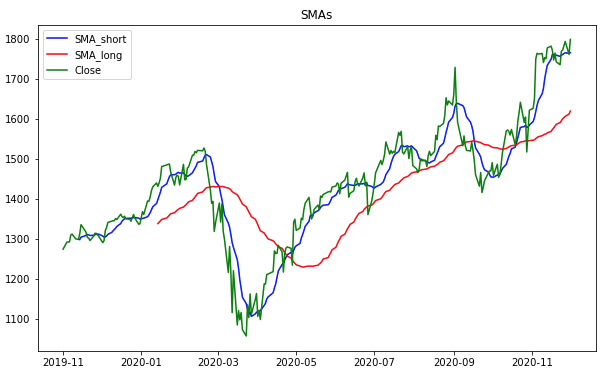
SMA’nın görselleştirilmesi

import matplotlib.pyplot as plt

# Plot SMA with the price
plt.plot(stock_data['SMA_short'], 
         label='SMA_short')
plt.plot(stock_data['SMA_long'], 
         label='SMA_long')
plt.plot(stock_data['Close'], 
         label='Close')

# Customize and show the plot
plt.legend()
plt.title('SMAs')
plt.show()

SMA grafiği

Python ile Finansal Alım Satım

Üssel Hareketli Ortalama (EMA)

$EMA_n = P_n \times multiplier + \text{previous EMA} \times (1-multiplier)$

$multiplier = 2 / (n + 1)$

# Calculate two EMAs
stock_data['EMA_short'] = talib.EMA(stock_data['Close'], timeperiod=10)
stock_data['EMA_long'] = talib.EMA(stock_data['Close'], timeperiod=50)
# Print the last five rows
print(stock_data.tail())
             Close  EMA_short  EMA_long
Date                                   
2020-11-24 1768.88    1748.65   1640.98
2020-11-25 1771.43    1752.79   1646.09
2020-11-27 1793.19    1760.13   1651.86
2020-11-30 1760.74    1760.24   1656.13
2020-12-01 1798.10    1767.13   1661.70
Python ile Finansal Alım Satım

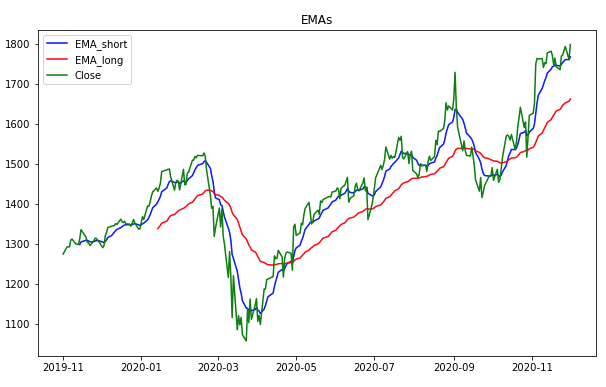
EMA’nın görselleştirilmesi
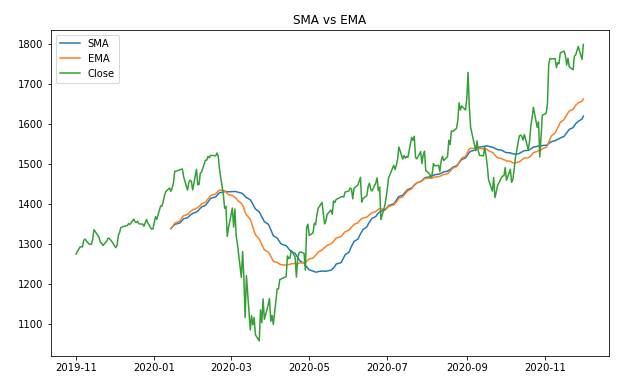
import matplotlib.pyplot as plt
# Plot EMA with the price
plt.plot(stock_data['EMA_short'], 
         label='EMA_short')
plt.plot(stock_data['EMA_long'], 
         label='EMA_long')
plt.plot(stock_data['Close'], 
         label='Close')

# Customize and show the plot
plt.legend()
plt.title('EMAs')
plt.show()

EMA grafiği

Python ile Finansal Alım Satım

SMA vs. EMA

EMA, en son fiyat hareketine daha duyarlıdır

Aynı bakış penceresiyle hesaplanan SMA ve EMA karşılaştırma grafiği

Python ile Finansal Alım Satım

Hadi pratik yapalım!

Python ile Finansal Alım Satım

Preparing Video For Download...