Seaborn'da Regresyon Grafikleri
Seaborn ile Orta Düzey Veri Görselleştirme

Chris Moffitt
Instructor
regplot'a giriş
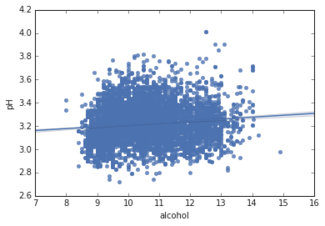
regplotbir saçılım grafiği ve regresyon çizgisi oluşturur- Kullanımı
displot'a benzer data,xveydeğişkenleri tanımlanmalı
sns.regplot(data=df, x="alcohol", y="pH" )
lmplot(), temel regplot() üzerine inşa edilir
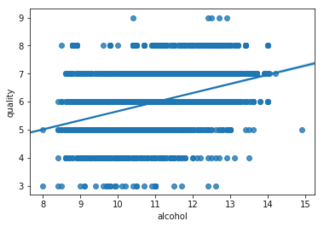
regplot- düşük seviye
sns.regplot(data=df,
            x="alcohol",
            y="quality")
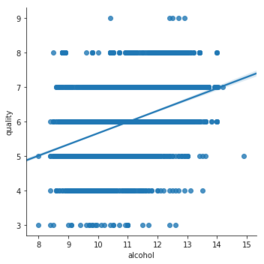
lmplot- yüksek seviye
sns.lmplot(data=df,
           x="alcohol",
           y="quality")
lmplot faceting
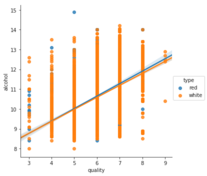
- Veriyi renklere göre düzenle (
hue)
sns.lmplot(data=df,
           x="quality",
           y="alcohol",
           hue="type")
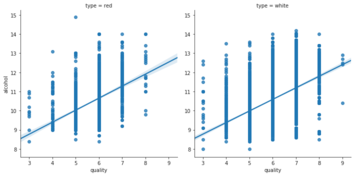
- Veriyi sütunlara göre düzenle (
col)
sns.lmplot(data=df,
           x="quality",
           y="alcohol",
           col="type")