JointGrid ve jointplot kullanma

Seaborn ile Orta Düzey Veri Görselleştirme

Chris Moffitt

Instructor

JointGrid() Genel Bakış
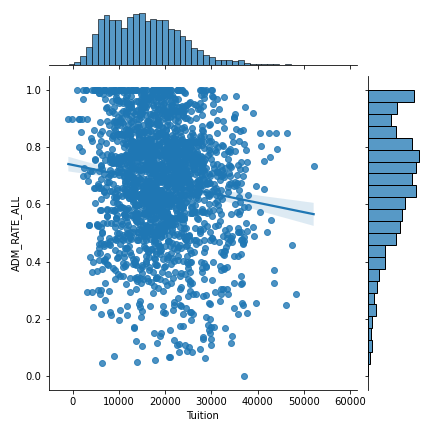
JointGrid Genel Bakış

Seaborn ile Orta Düzey Veri Görselleştirme

Temel JointGrid

g = sns.JointGrid(data=df, x="Tuition", y="ADM_RATE_ALL") 
g.plot(sns.regplot, sns.histplot)

JointGrid Örneği

Seaborn ile Orta Düzey Veri Görselleştirme

İleri JointGrid

g = sns.JointGrid(data=df, x="Tuition", y="ADM_RATE_ALL") 
g = g.plot_joint(sns.kdeplot)
g = g.plot_marginals(sns.kdeplot, shade=True)
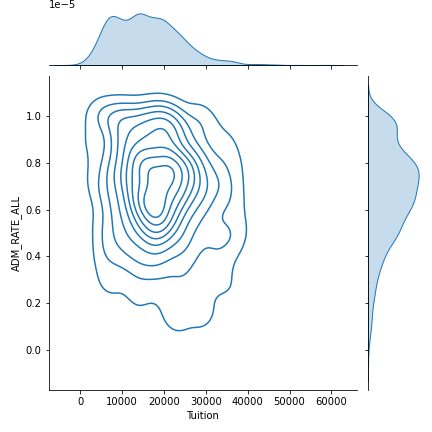
Açıklamalı JointGrid örneği

Seaborn ile Orta Düzey Veri Görselleştirme

jointplot()

sns.jointplot(data=df, x="Tuition", y="ADM_RATE_ALL", kind='hex')
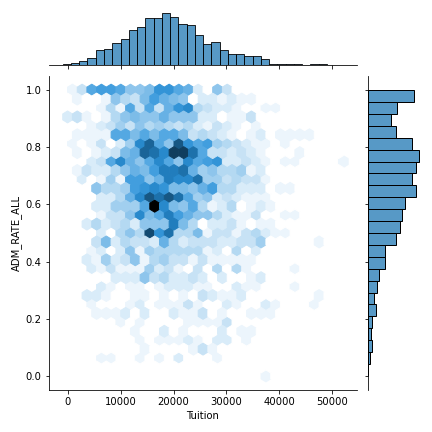
jointplot örneği

Seaborn ile Orta Düzey Veri Görselleştirme

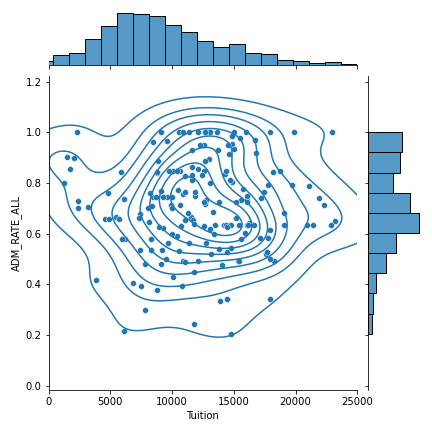
jointplot'u özelleştirme

g = (sns.jointplot(x="Tuition",
                   y="ADM_RATE_ALL",
                   kind="scatter",
                   xlim=(0, 25000),
                   data=df.query('UG < 2500 &
                   Ownership == "Public"'))
    .plot_joint(sns.kdeplot))
Seaborn ile Orta Düzey Veri Görselleştirme

jointplot'u özelleştirme

jointplot

Seaborn ile Orta Düzey Veri Görselleştirme

Hadi pratik yapalım!

Seaborn ile Orta Düzey Veri Görselleştirme

Preparing Video For Download...