matplotlib ile özelleştirme
Seaborn ile Orta Düzey Veri Görselleştirme

Chris Moffitt
Instructor
Matplotlib Axes
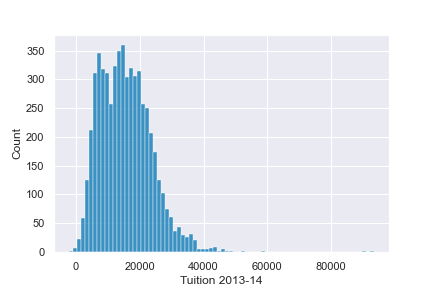
- Çoğu özelleştirme
matplotlibAxesnesneleriyle yapılır Axesseaborn fonksiyonlarına geçirilebilir
fig, ax = plt.subplots()
sns.histplot(df['Tuition'], ax=ax)
ax.set(xlabel='Tuition 2013-14')
İleri Özelleştirmeler
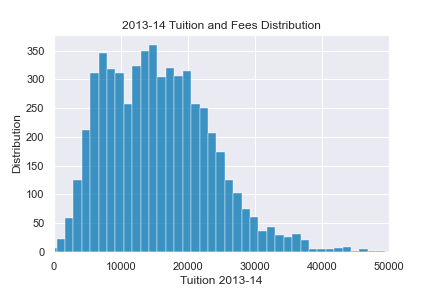
axesnesnesi birçok yaygın özelleştirmeyi destekler
fig, ax = plt.subplots()
sns.histplot(df['Tuition'], ax=ax)
ax.set(xlabel="Tuition 2013-14",
       ylabel="Dağılım", xlim=(0, 50000),
title="2013-14 Öğrenim ve Harç Dağılımı")
Grafikleri Birleştirme