Kohort analizi görselleştirme

Python ile Müşteri Segmentasyonu

Karolis Urbonas

Head of Data Science, Amazon

Isı haritası
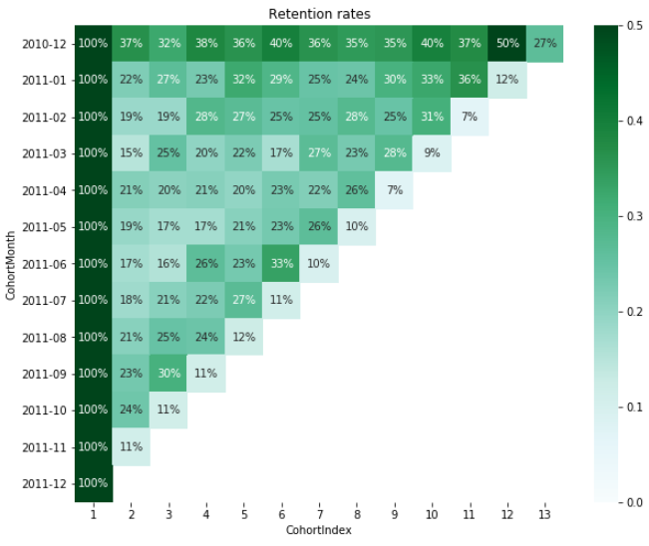
  • Kohort analizini görselleştirmenin en kolay yolu

  • Hem veriler hem görseller dahil

  • seaborn ile yalnızca birkaç satır kod

kohort_isı_haritası

Python ile Müşteri Segmentasyonu

Tutma tablosunu yükleyin

retention.round(3)*100
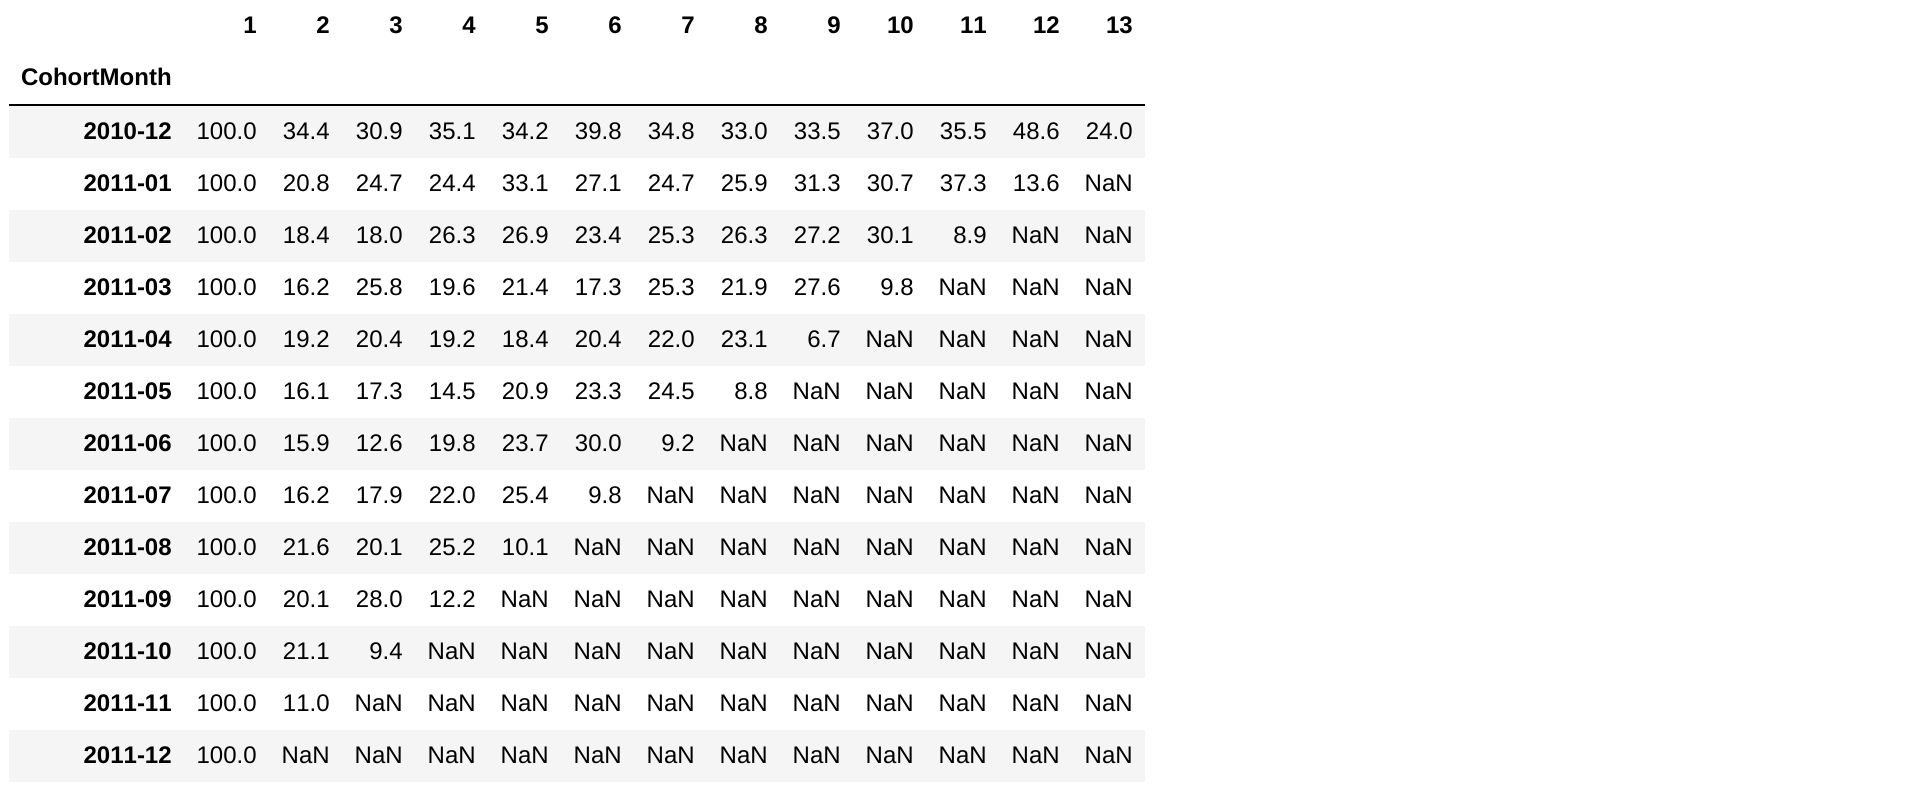
tutma_tablo

Python ile Müşteri Segmentasyonu

Isı haritası oluşturma

import seaborn as sns
import matplotlib.pyplot as plt

plt.figure(figsize=(10, 8))
plt.title('Retention rates')
sns.heatmap(data = retention, annot = True, fmt = '.0%', vmin = 0.0, vmax = 0.5, cmap = 'BuGn')
plt.show()
Python ile Müşteri Segmentasyonu

Tutma ısı haritası

tutma_ısı_haritası

Python ile Müşteri Segmentasyonu

Kohortları görselleştirme alıştırması

Python ile Müşteri Segmentasyonu

Preparing Video For Download...