xts ve plot() işlevine hızlı bakış
R'de Zaman Serisi Verilerini Görselleştirme

Arnaud Amsellem
Quantitative Trader and creator of the R Trader blog
xts’e hızlı bakış
- Zaman serilerini işlemek için özel bir nesne sınıfı
- eXtensible Time Series
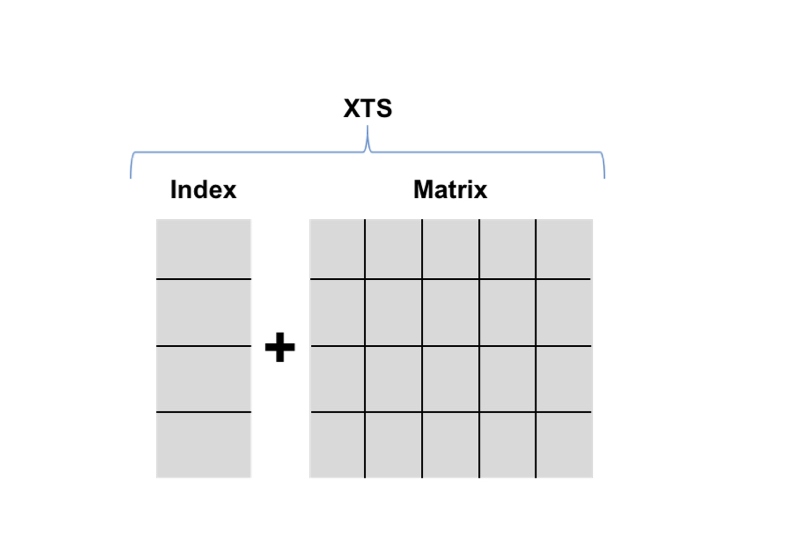
- xts = Zaman Dizini + Matris
- Dizin bir zaman nesnesidir:
Date,POSIX Time,timeDate,chron
plot() işlevini kullanma
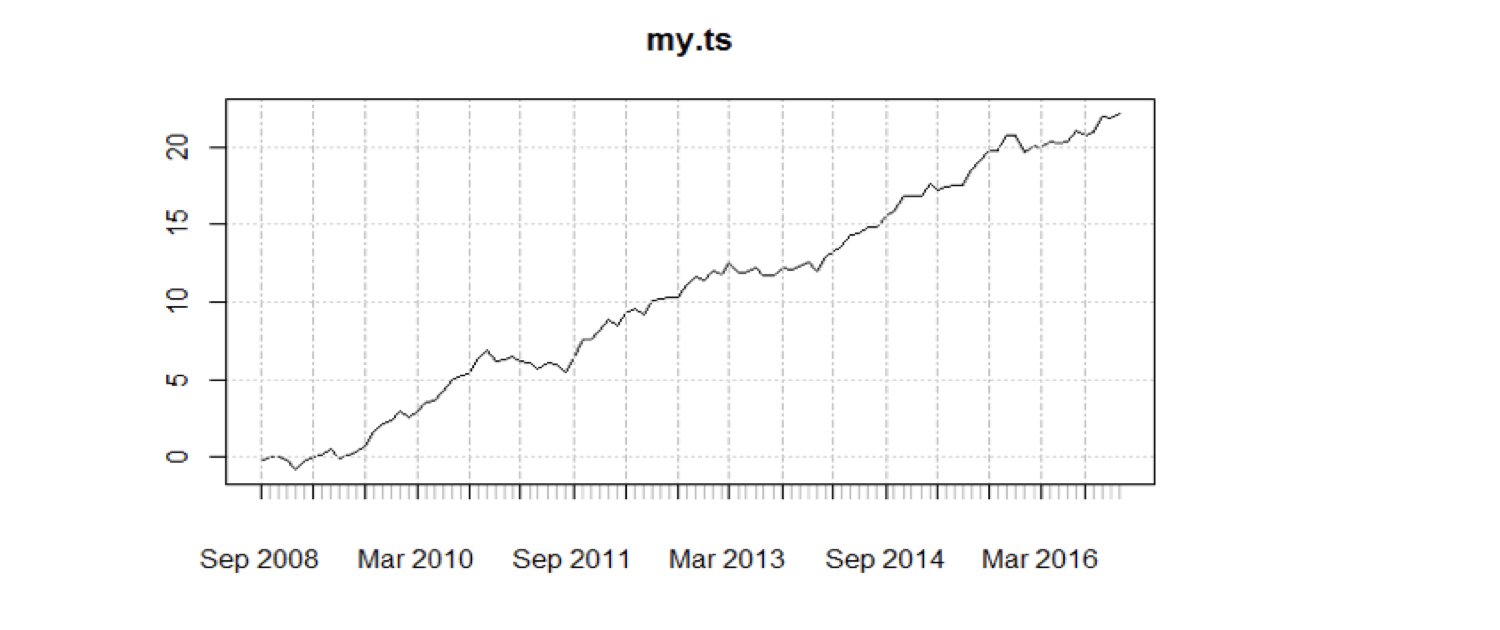
plot(my_ts)
plot() işlevini kullanma
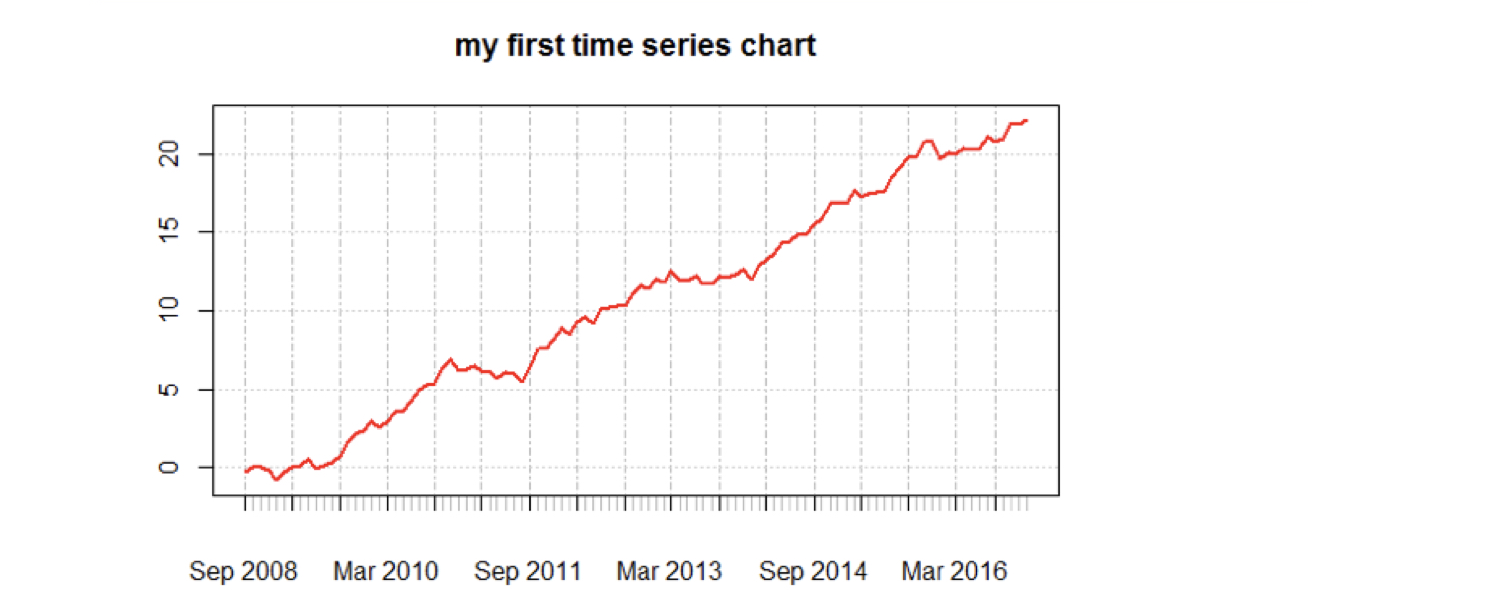
plot(my_ts, main = "ilk zaman serim")
lines(my_ts, col = "red", lwd = 2)
plot() işlevini kullanma
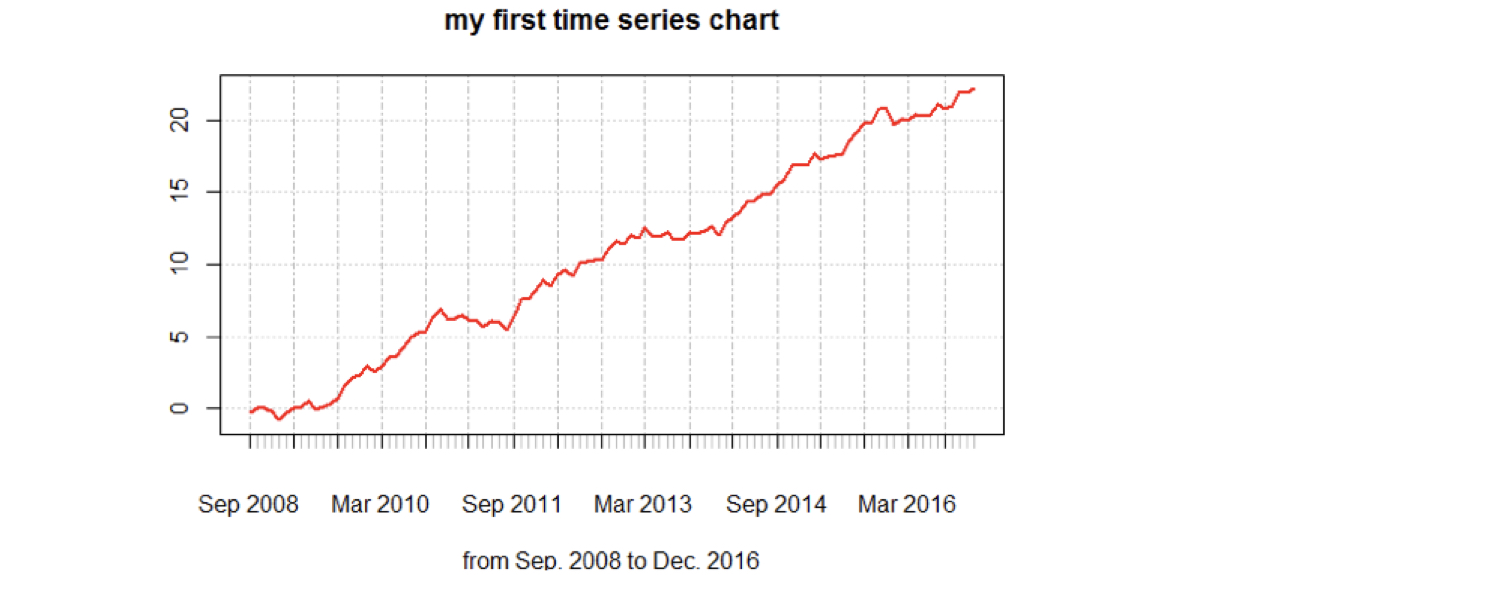
plot(my_ts, main = "ilk zaman serim",
            sub = "Eyl. 2008 - Ara. 2016")
lines(my_ts, col = "red", lwd = 2)

