İlk shinydashboard’unuz

shinydashboard ile Panolar Oluşturma

Png Kee Seng

Researcher

Şimdiye kadarki yol

  • Kullanıcı arayüzünde (UI) taslak oluşturma
    • Üstbilgi, kenar çubuğu, gövde
  • Çıktıları ve kullanıcı girdileriyle etkileşimlerini tanımlayın
  • Bu rolü server üstlenir

çizim

header <- dashboardHeader(...)
sidebar <- dashboardSidebar(...)
body <- dashboardBody(...)

ui <- dashboardPage(header, sidebar, body)
server <- function(input, output) { ... }
shinyApp(ui, server)
shinydashboard ile Panolar Oluşturma

Server

  • Çıktı ve girdileri tanımlayın
  • Çıktıları ve girdilerle etkileşimlerini belirtin
  • Dağınıklığı azaltmak ve okunabilirliği artırmak için yardımcı fonksiyonlar kullanın
    • Bu yardımcıları kodun en üstüne koyun

Sunucu, talimatlarınızı mutfağa ileten yardımcı bir garson gibidir. shinyApp’te server, girdilerin çıktılarla nasıl etkileşeceğini R’a söyler.

shinydashboard ile Panolar Oluşturma

Bir grafik ekleme

  • Küresel futbol turnuvası panosuna geri dönelim
  • takım 1 için bir hexbin grafiği ekleyelim
  • Sonra bu grafiği server’a yerleştirmeliyiz
  • Peki takım 2 için de aynı grafiği istersek?
soccer %>%
  ggplot(aes(x=`1_passes_compeletd`, 
             y=`1_goal_prevented`)) +
  geom_hex(bins=10) + theme_classic()
server <- function(input, output){
  output$plot1 <- renderPlot({
  fifa %>%
    ggplot(aes(x=`1_passes_compeletd`, 
               y=`1_goal_prevented`)) +
    geom_hex(bins=10) + theme_classic()
  })
}
shinydashboard ile Panolar Oluşturma

server içinde ggplot nesneleri tanımlama

server <- function(input, output) {
  output$plot1 <- renderPlot({
    if (input$team == 1){

fifa %>% ggplot(aes(x=`1_passes_compeletd`, y=`1_goal_prevented`)) + geom_hex(bins=10) + theme_classic()
} else if (input$team == 2){
fifa %>% ggplot(aes(x=`2_passes_compeletd`, y=`2_goal_prevented`)) + geom_hex(bins=10) + theme_classic()
} }) }
shinydashboard ile Panolar Oluşturma

Yardımcı fonksiyonları kullanma

plot_hex <- function(team){
  if (team == 1){
    soccer %>% ggplot(aes(x=`1_passes_compeletd`, 
                        y=`1_goal_prevented`)) +
      geom_hex(bins=10) + theme_classic()
  }
  else if (team == 2){
    soccer %>% ggplot(aes(x=`2_passes_compeletd`, 
                        y=`2_goal_prevented`)) +
      geom_hex(bins=10) + theme_classic()
  }
}
shinydashboard ile Panolar Oluşturma

Yardımcı fonksiyonları kullanma

Yardımcı fonksiyonla

server <- function(input, output) {
  output$plot1 <- renderPlot(plot_hex(input$team)) 
}
  • Daha okunaklı değil mi?

Yardımcı fonksiyon olmadan

server <- function(input, output) {
  output$plot1 <- renderPlot({
    if (input$team == 1){
      soccer %>% ggplot(aes(x=`1_passes_compeletd`, 
              y=`1_goal_prevented`)) +
        geom_hex(bins=10) + theme_classic()
      }
    else if (input$team == 2){
      soccer %>% ggplot(aes(x=`2_passes_compeletd`, 
              y=`2_goal_prevented`)) +
        geom_hex(bins=10) + theme_classic()
      }
    })
}
shinydashboard ile Panolar Oluşturma

Hepsini bir araya getirme

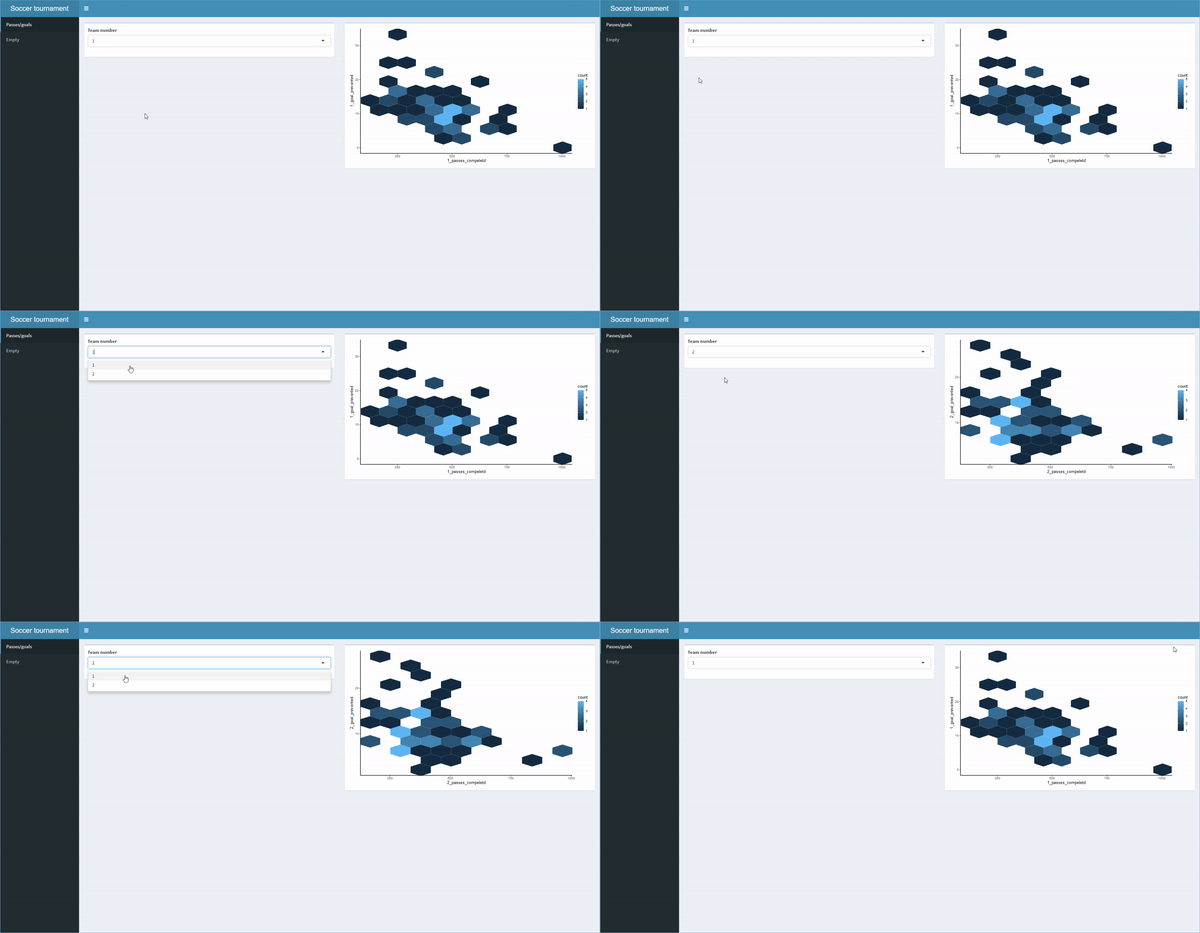
# Eksiksiz bir shinydashboard

header <- dashboardHeader(title = "Soccer tournament")
sidebar <- dashboardSidebar(sidebarMenu(menuItem("Passes/goals", tabName = "passtab"), menuItem("Empty", tabName = "emptytab")))
body <- dashboardBody(tabItems( tabItem("passtab", fluidRow(box(selectInput("team", "Team number", choices = c(1,2))), box(plotOutput("plot1"))) ), tabItem("emptytab")) )
ui <- dashboardPage(header, sidebar, body)
server <- function(input, output) { output$plot1 <- renderPlot(plot_hex(input$team)) }
shinyApp(ui, server)
shinydashboard ile Panolar Oluşturma

Oluşturulan shinydashboard’un nasıl göründüğünü gösteren bir animasyon. Kullanıcı farklı sayfalar/sekmler arasında geçiş yapabilir ve farklı çıktılar için girdi sağlayabilir.

shinydashboard ile Panolar Oluşturma

Hadi pratik yapalım!

shinydashboard ile Panolar Oluşturma

Preparing Video For Download...