shinydashboard ile Panolar Oluşturma
Png Kee Seng
Researcher
Her çıktı için iki işlev çağrılır
<type>output(<identifying label>, ...)
İkinci kod server içinde tanımlanır
output$<identifying label> <- render<type>(...)
library(tidyverse)
sleep <- read_csv("../data/Time Americans Spend Sleeping.csv")
$ index : num [1:945] 0 1 2 3 4 ...
$ Year : num [1:945] 2003 2004 2005 2006 2007 ...
$ Period : chr [1:945] "Annual" "Annual" "Annual" "Annual" ...
$ Avg hrs per day sleeping: num [1:945] 8.57 8.55 8.62 8.63 ...
$ Standard Error : num [1:945] 0.018 0.026 0.023 0.024 ...
$ Type of Days : chr [1:945] "All days" "All days" "All days" ...
$ Age Group : chr [1:945] "15 years and over" "15 years and over" ...
$ Activity : chr [1:945] "Sleeping" "Sleeping" "Sleeping" ...
$ Sex : chr [1:945] "Both" "Both" "Both" ...
textOutput yerleştirelimui <- fluidPage(
titlePanel("Sleeping habits in America"),
textOutput("textlabel"))
server <- function(input, output) {
}
shinyApp(ui, server)
renderText kullanınoutput$ gösterimini kullanacağızui <- fluidPage( titlePanel("Sleeping habits in America"), textOutput("textlabel"))server <- function(input, output) { output$textlabel <- renderText("Uyku yoksunluğu dünyadaki birçok büyük şehirde ciddi bir sağlık sorunudur.") }shinyApp(ui, server)

input$ ile erişirizinput$<type>
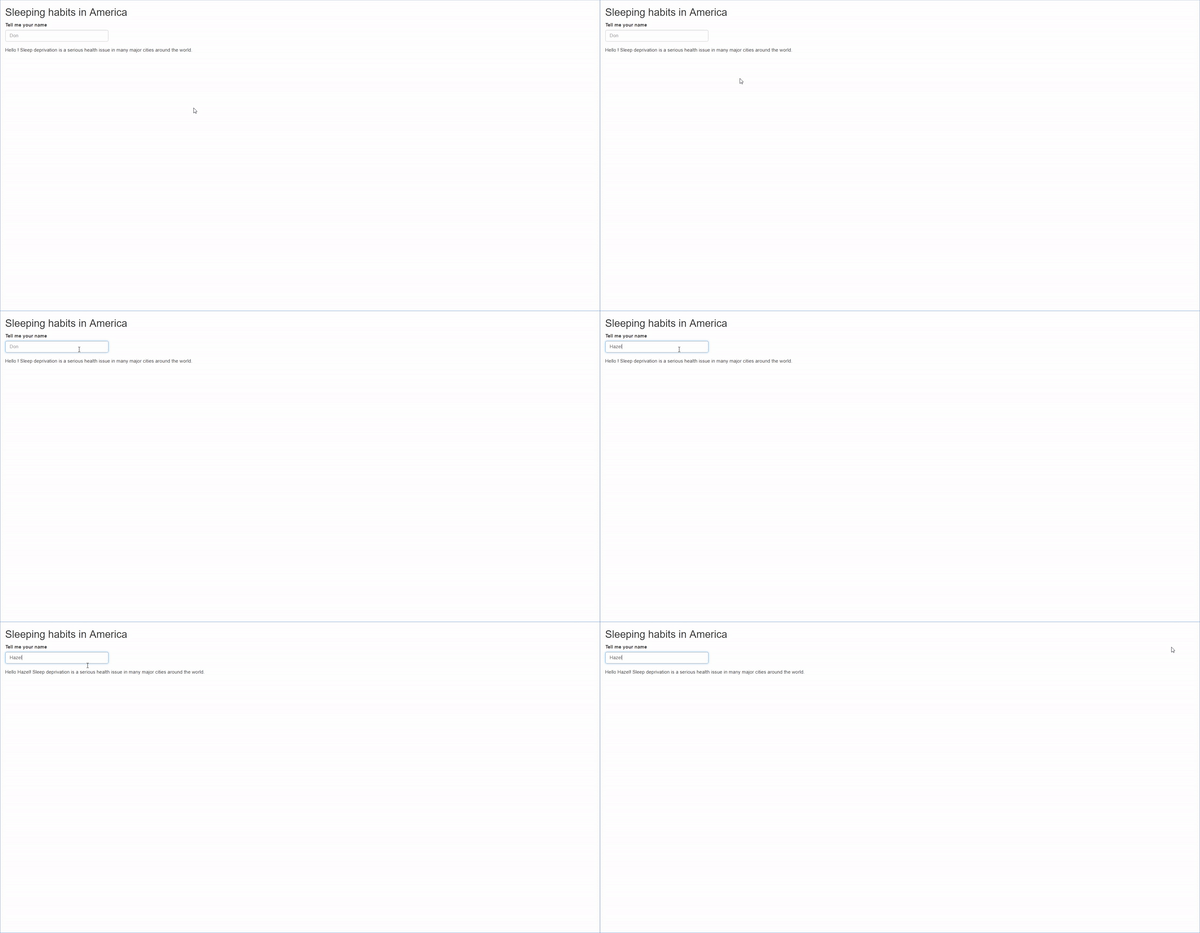
ui <- fluidPage( titlePanel("Sleeping habits in America"),textInput("textlabel", "Adınızı yazınız", value = "", placeholder = "Don"),textOutput("textoutlabel")) server <- function(input, output) { output$textoutlabel <- renderText(paste0("Merhaba ",input$textlabel,"Uyku yoksunluğu dünyadaki birçok büyük şehirde ciddi bir sağlık sorunudur.")) } shinyApp(ui, server)

plotOutput() yerleştirinui <- fluidPage( titlePanel("Sleeping habits in America"),plotOutput("plotlabel"))server <- function(input, output) { } shinyApp(ui, server)
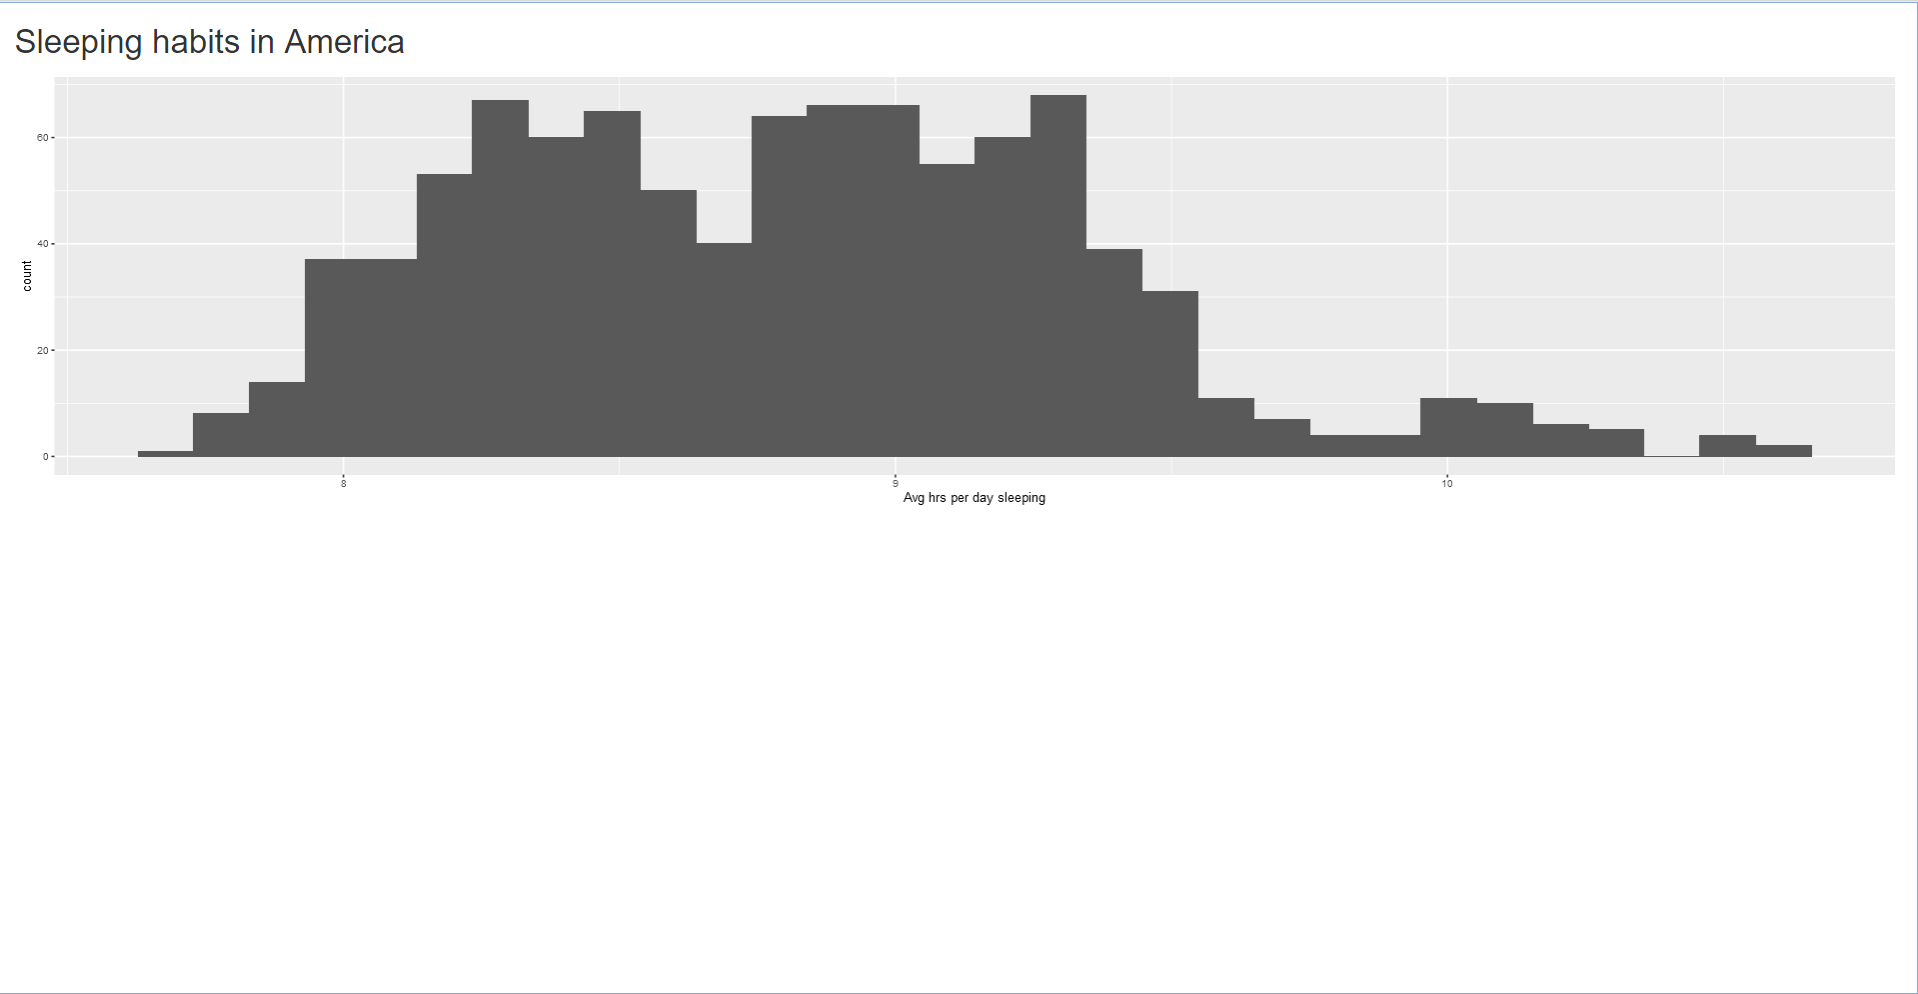
server() içinde renderPlot() kullanacağızui <- fluidPage( titlePanel("Sleeping habits in America"), plotOutput("plotlabel")) server <- function(input, output) {output$plotlabel <- renderPlot({ ggplot(sleep) + geom_histogram(aes(x = `Avg hrs per day sleeping`)) })} shinyApp(ui, server)

ui <- fluidPage(
titlePanel("Sleeping habits in America"),
selectInput("selectlabel",
"Bir seçenek seçin",
choices = c("Histogram", "Boxplot")),
plotOutput("plotlabel"))
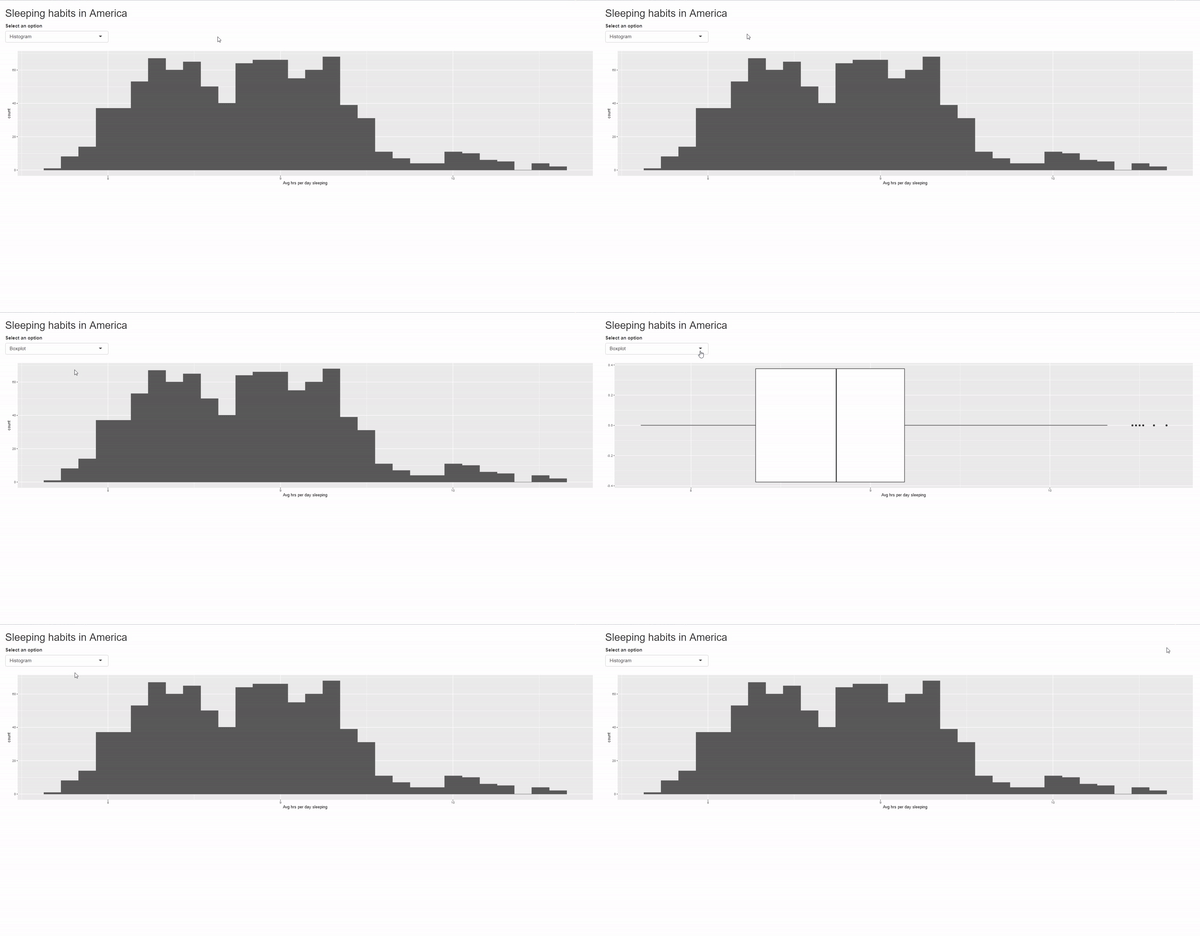
server <- function(input, output) { output$plotlabel <- renderPlot({ if (input$selectlabel == "Histogram"){ggplot(sleep) + geom_histogram(aes(x = `Avg hrs per day sleeping`))} else if (input$selectlabel == "Boxplot"){ggplot(sleep) + geom_boxplot(aes(x = `Avg hrs per day sleeping`))} }) } shinyApp(ui, server)

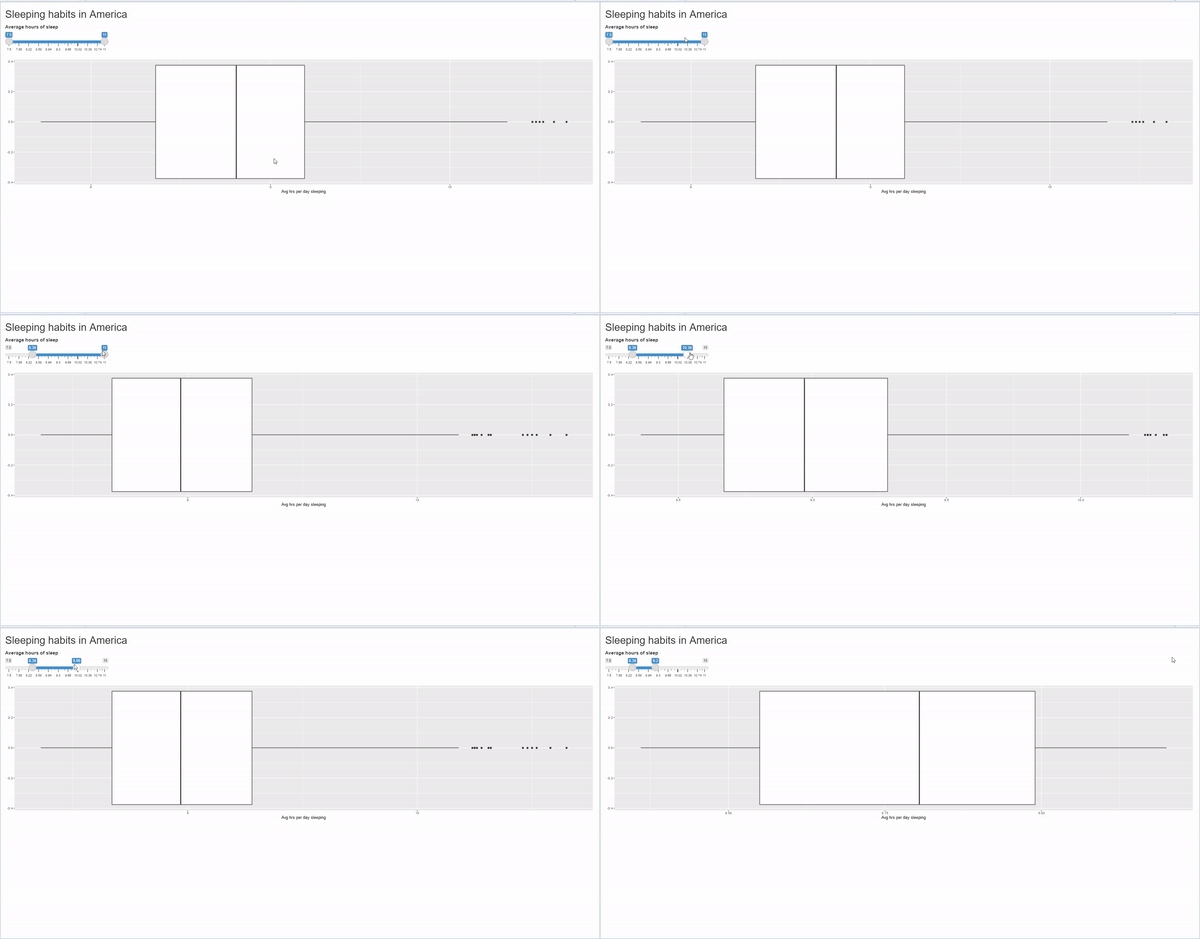
sliderInput içeren bir örneğe bakalımui <- fluidPage( titlePanel("Sleeping habits in America"),sliderInput("sliderlabel", "Ortalama uyku süresi", min = 7.5, max = 11, value = c(7.5, 11), step = 0.02),plotOutput("plotlabel")) server <- function(input, output) {output$plotlabel <- renderPlot({ filter(sleep, `Avg hrs per day sleeping` >= input$sliderlabel[1], `Avg hrs per day sleeping` <= input$sliderlabel[2]) %>% ggplot() + geom_boxplot(aes(x=`Avg hrs per day sleeping`)) })} shinyApp(ui, server)

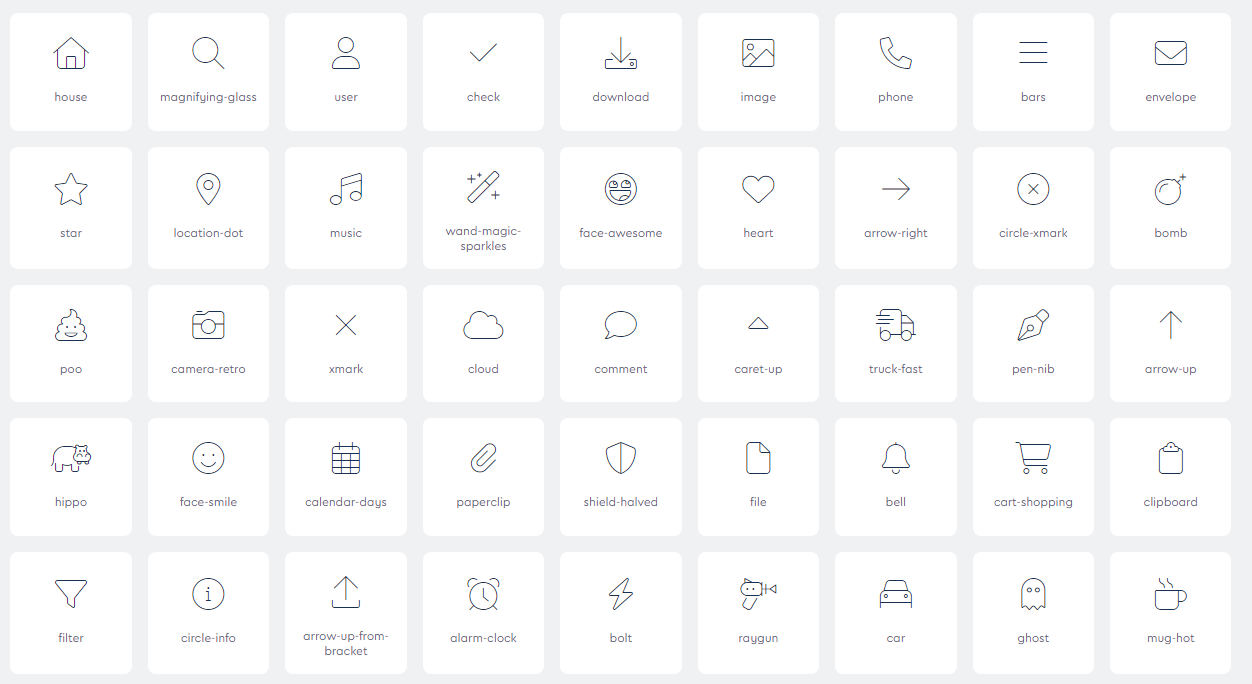
shiny, shinyApp’te kullanılabilecek simgeler de içerir![]()
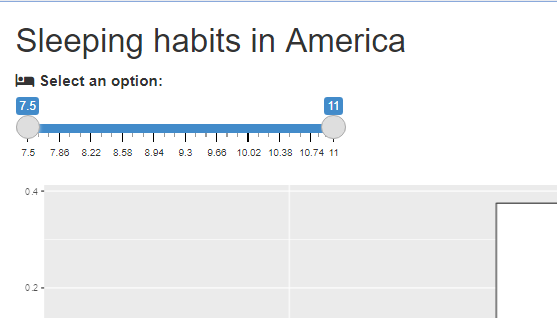
icon("...") kullanınicon("bed")ui <- fluidPage( titlePanel("Sleeping habits in America"), sliderInput("sliderlabel",list(icon("bed"),"Bir seçenek seçin:"), min = 7.5, max = 11, value = c(7.5, 11), step = 0.02), plotOutput("plotlabel")) server <- function(input, output) { output$plotlabel <- renderPlot({ filter(sleep, `Avg hrs per day sleeping` >= input$sliderlabel[1], `Avg hrs per day sleeping` <= input$sliderlabel[2]) %>% ggplot() + geom_boxplot(aes(x=`Avg hrs per day sleeping`)) }) } shinyApp(ui, server)
![]()
shinydashboard ile Panolar Oluşturma