Simülasyon tabanlı çıkarım

R'de Doğrusal Regresyon için Çıkarım

Jo Hardin

Professor, Pomona College
R'de Doğrusal Regresyon için Çıkarım

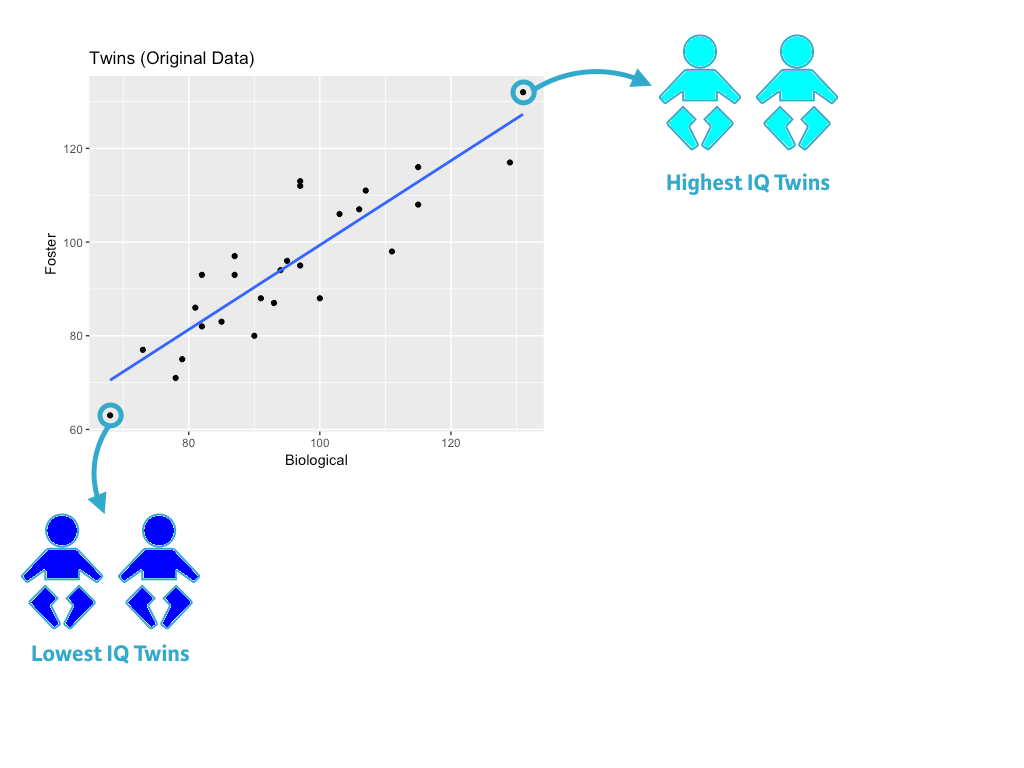
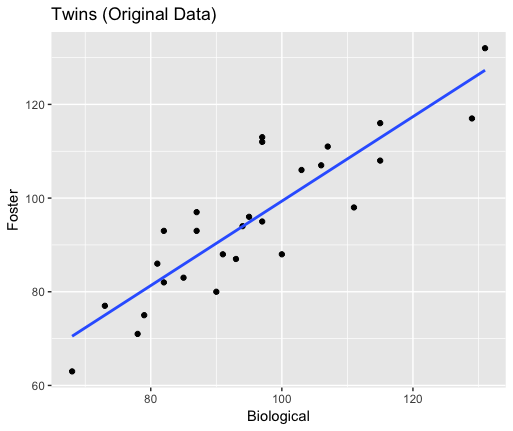
İkizlerin IQ'larının saçılım grafiği.

R'de Doğrusal Regresyon için Çıkarım

İkiz verisi

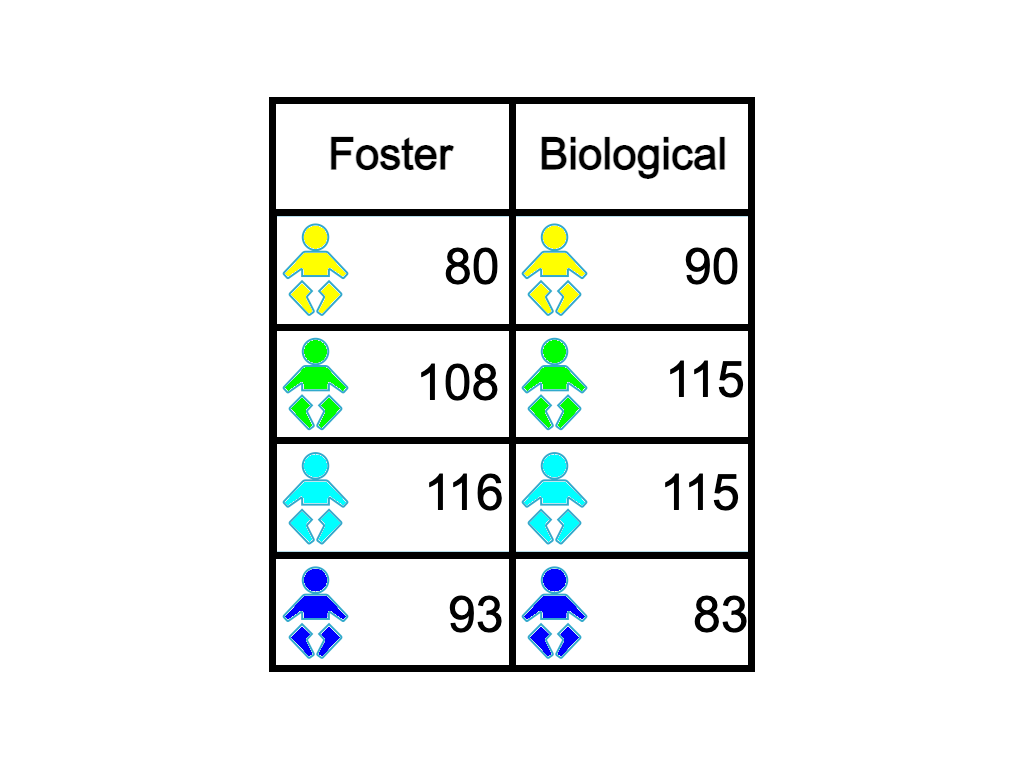
İkizlerin IQ tablosu. Her satır bir ikiz çiftini gösterir. İlk sütunda evlatlık aile yanında büyüyen ikizin IQ'su, ikinci sütunda biyolojik ailesiyle büyüyen ikizin IQ'su var.

R'de Doğrusal Regresyon için Çıkarım

Permüte edilmiş ikiz verisi

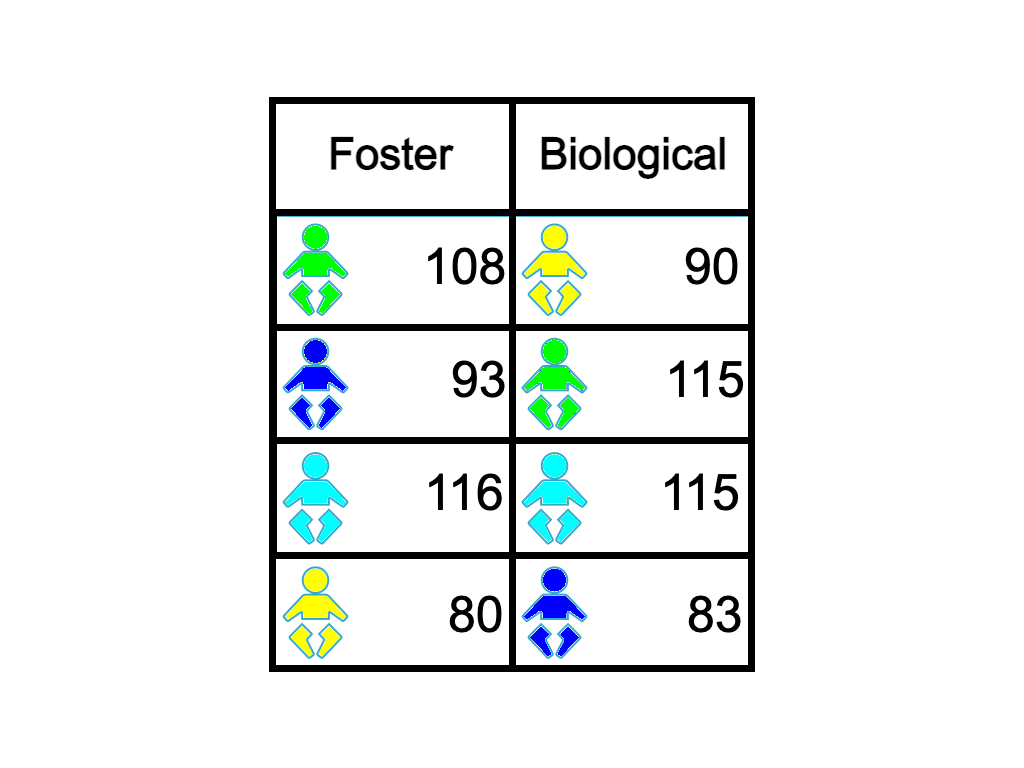
İkizlerin IQ tablosunda her sütun permüte edildi; artık ikiz çiftleri aynı satırda birlikte görünmüyor.

R'de Doğrusal Regresyon için Çıkarım

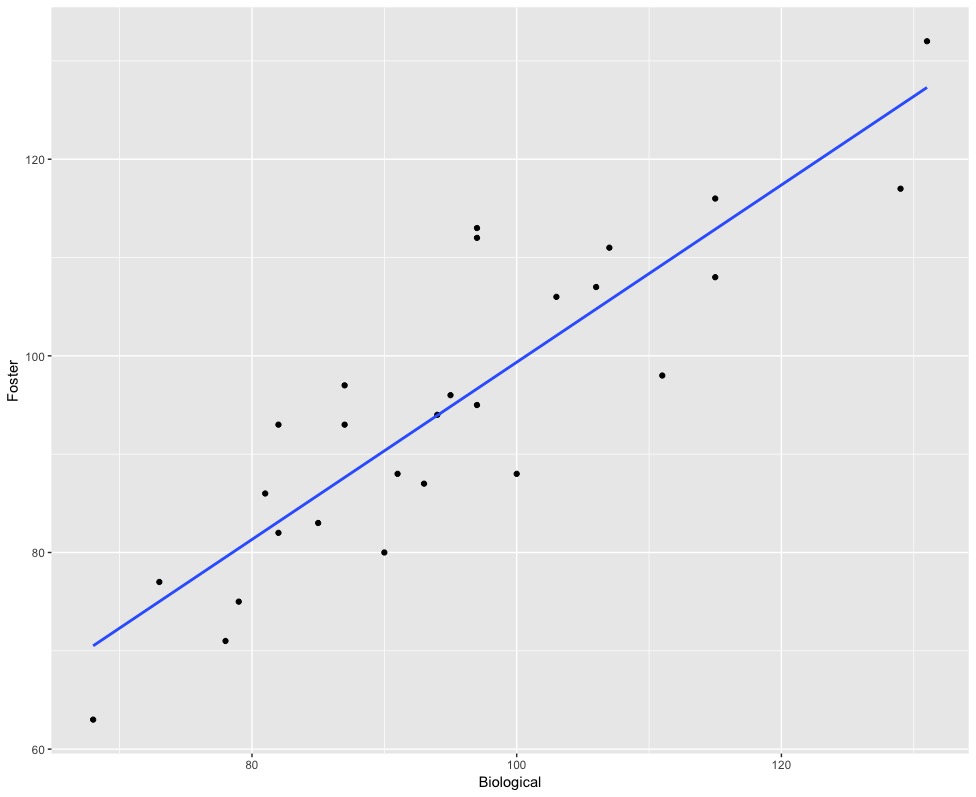
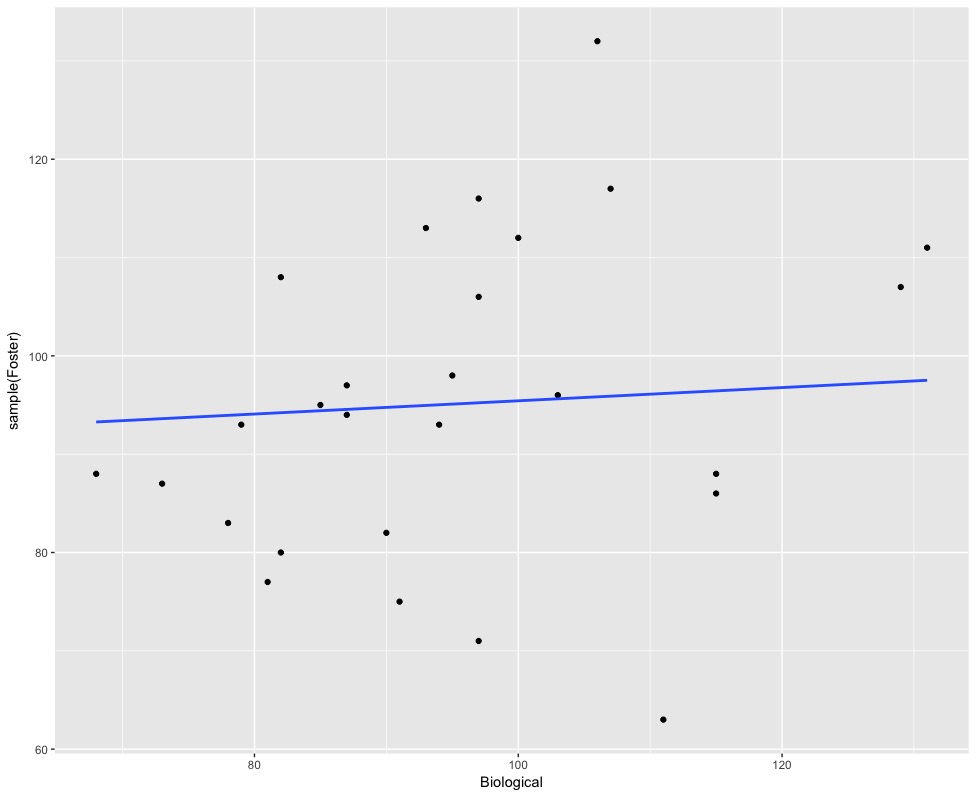
Permüte veri (1) grafiği

Özgün veri

Permüte veri (1)
R'de Doğrusal Regresyon için Çıkarım

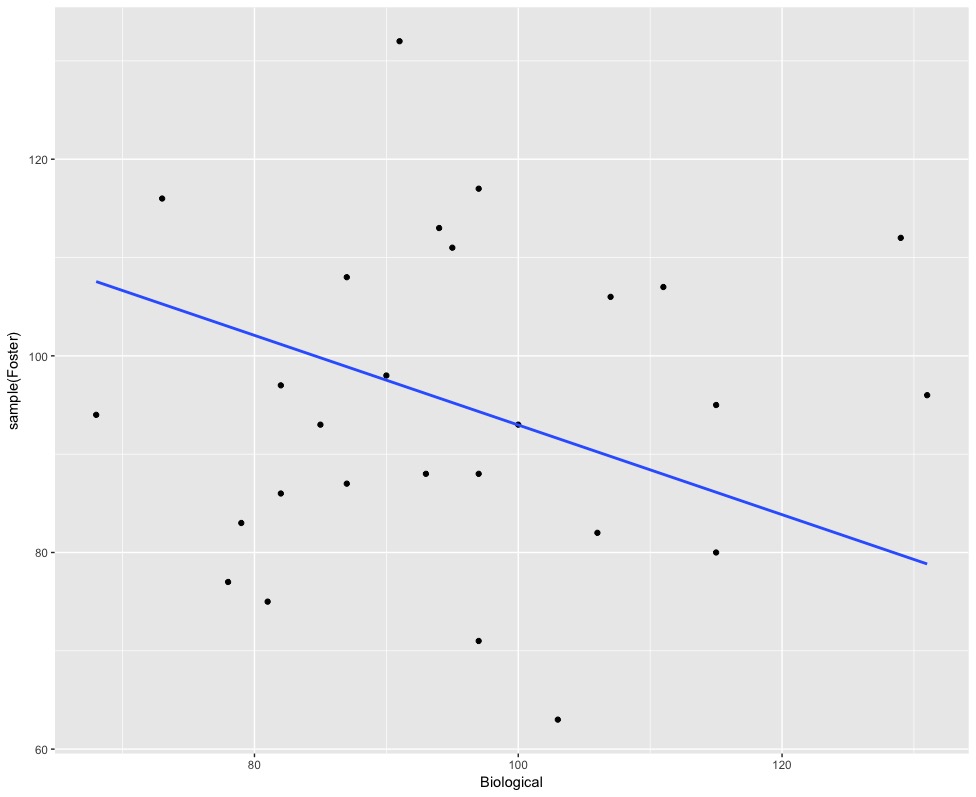
Permüte veri (2) grafiği

Özgün veri

Permüte veri (2)
R'de Doğrusal Regresyon için Çıkarım

Permüte veri (1) ve (2)

Permüte veri (1)

Permüte veri (2)

R'de Doğrusal Regresyon için Çıkarım
twins %>%
   specify(Foster ~ Biological) %>%
   hypothesize(null = "independence") %>%
   generate(reps = 10, type = "permute") %>%
   calculate(stat = "slope")
A tibble: 10 x 2
   replicate          stat
       <int>         <dbl>
 1         1  0.0007709302
 2         2 -0.0353592305
 3         3 -0.0278627974
 4         4 -0.0072547982
 5         5 -0.1252761541
 6         6 -0.1669869287
 7         7 -0.2610519170
 8         8 -0.0157695494
 9         9  0.0581361900
10        10  0.1598471947
R'de Doğrusal Regresyon için Çıkarım

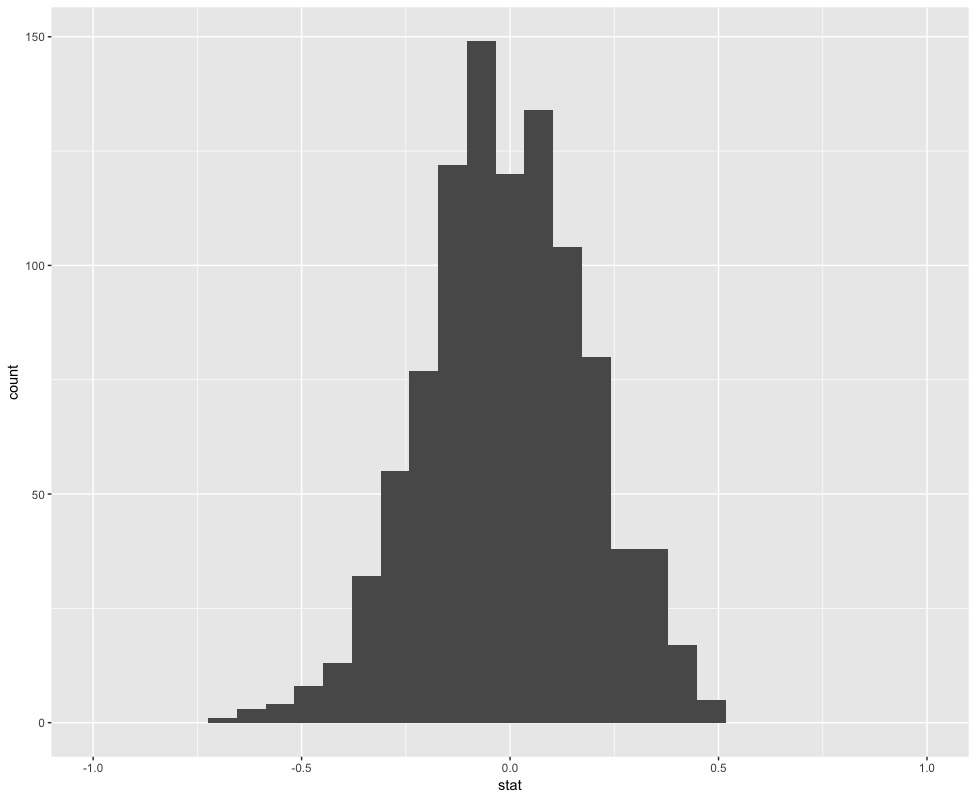
Çok sayıda permüte eğim

perm_slope <- twins %>%
   specify(Foster ~ Biological) %>%
   hypothesize(
     null = "independence"
     ) %>%
   generate(reps = 1000, 
            type = "permute") %>%
   calculate(stat = "slope") 

ggplot(data = perm_slope, aes(x = stat)) + 
   geom_histogram() +
   xlim(-1,1)

R'de Doğrusal Regresyon için Çıkarım

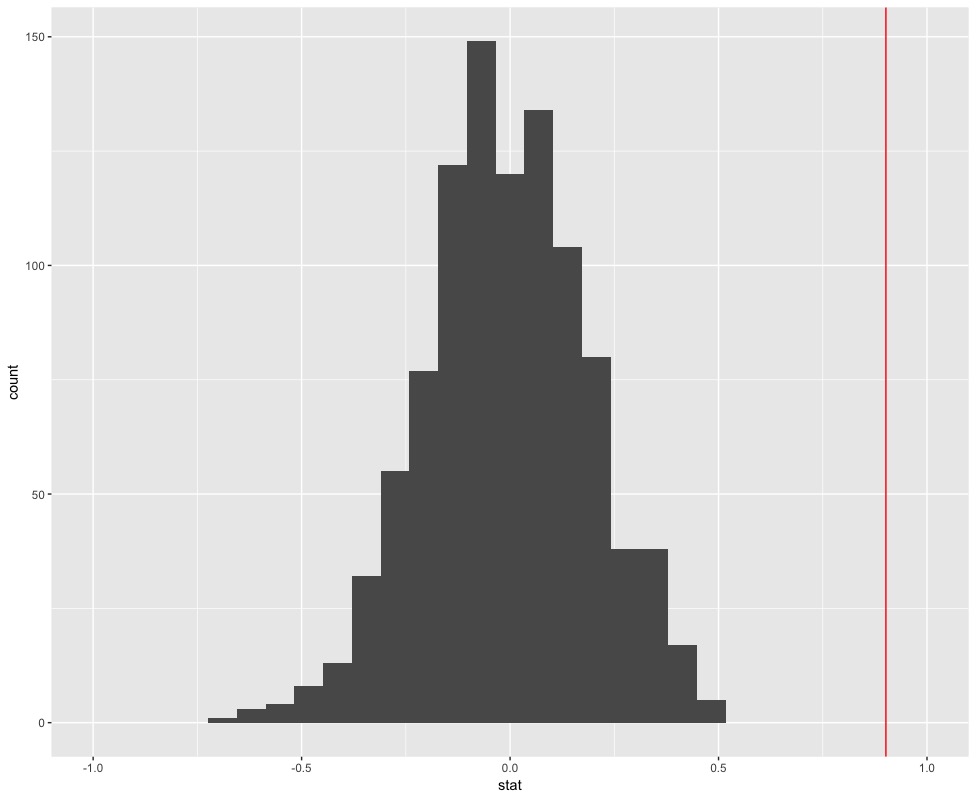
Gözlenen eğim kırmızıyla: permüte eğimler
obs_slope <- lm(Foster ~ Biological,
                data = twins) %>%
   tidy() %>%   
   filter(term == "Biological") %>%
   select(estimate) %>%   
   pull()
obs_slope
0.901436
ggplot(data = perm_slope, aes(x = stat)) + 
   geom_histogram() +
   geom_vline(xintercept = obs_slope, color = "red") 
   + xlim(-1,1)

R'de Doğrusal Regresyon için Çıkarım

Hadi pratik yapalım!

R'de Doğrusal Regresyon için Çıkarım

Preparing Video For Download...