R'da Feature Engineering
Jorge Zazueta
Research Professor and Head of the Modeling Group at the School of Economics, UASLP
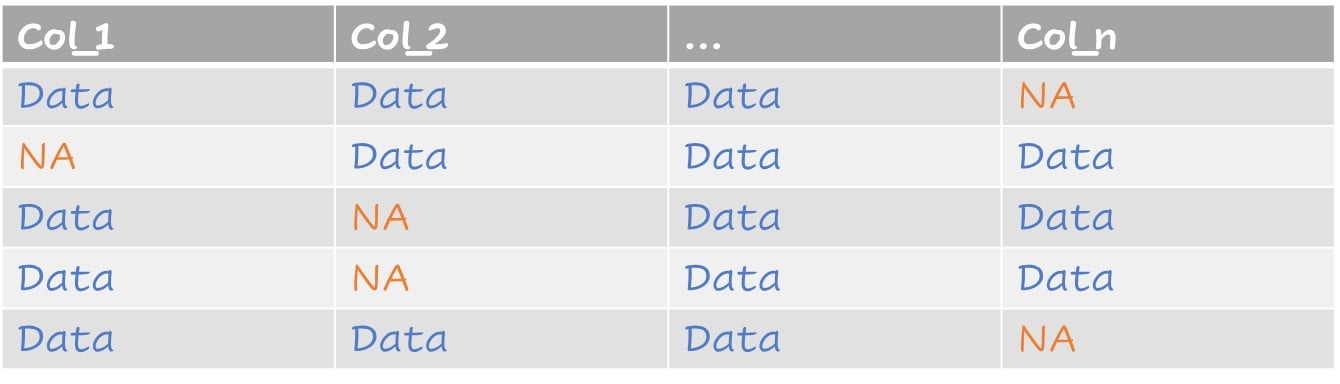
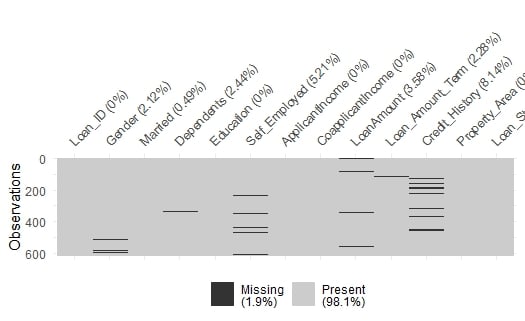
Eksik değerli tipik bir veri seti

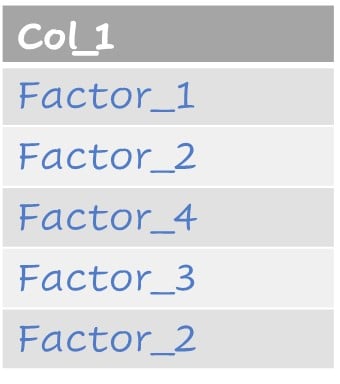
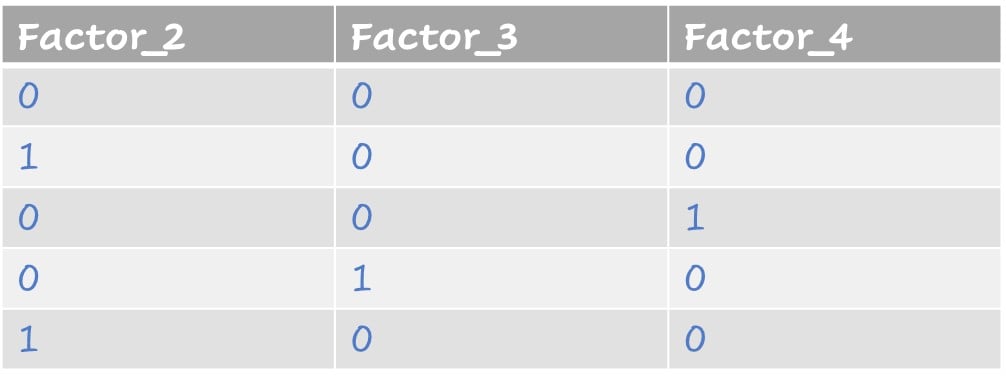
Değerlerin faktör olarak gösterimi

Atanmış değerleri olan veri seti

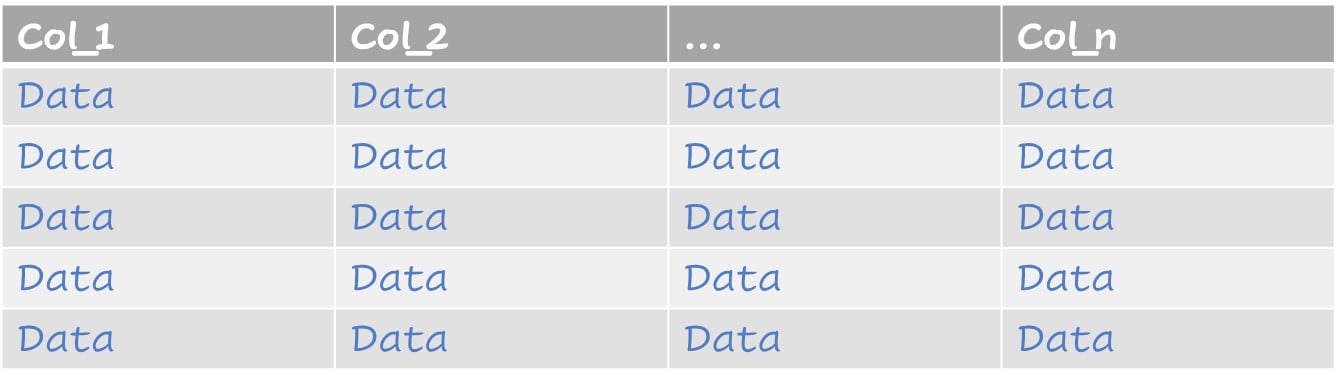
Faktörlerin sahte değişkenlerle gösterimi

# A tibble: 614 × 13
Loan_ID Gender Married Dependents Educa…¹ Self_…² Appli…³ Coapp…⁴ LoanA…⁵ Loan_…⁶
<fct> <fct> <fct> <fct> <fct> <fct> <dbl> <dbl> <dbl> <dbl>
1 LP001002 Male No 0 Gradua… No 5849 0 NA 360
2 LP001003 Male Yes 1 Gradua… No 4583 1508 128 360
3 LP001005 Male Yes 0 Gradua… Yes 3000 0 66 360
4 LP001006 Male Yes 0 Not Gr… No 2583 2358 120 360
5 LP001008 Male No 0 Gradua… No 6000 0 141 360
6 LP001011 Male Yes 2 Gradua… Yes 5417 4196 267 360
7 LP001013 Male Yes 0 Not Gr… No 2333 1516 95 360
8 LP001014 Male Yes 3+ Gradua… No 3036 2504 158 360
9 LP001018 Male Yes 2 Gradua… No 4006 1526 168 360
10 LP001020 Male Yes 1 Gradua… No 12841 10968 349 360
# … with 604 more rows, 3 more variables: Credit_History <dbl>, Property_Area <fct>,
# Loan_Status <fct>, and abbreviated variable names ¹Education, ²Self_Employed,
# ³ApplicantIncome, ⁴CoapplicantIncome, ⁵LoanAmount, ⁶Loan_Amount_Term
# ℹ Use `print(n = ...)` to see more rows, and `colnames()` to see all variable names
loans içindeki eksik değerleri, naniar paketindeki vis_miss(loans) ile görsel olarak belirleyebiliriz.

Yalnızca eksik değer içeren sütunları seçerek tabloyu yakınlaştırabiliriz.
loans %>%
select(Gender,
Married,
Dependents,
Self_Employed,
LoanAmount,
Loan_Amount_Term,
Credit_History) %>%
vis_miss()
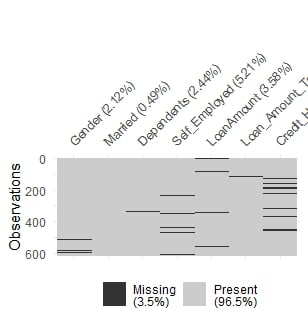
Eksik değerlere daha yakından bakış
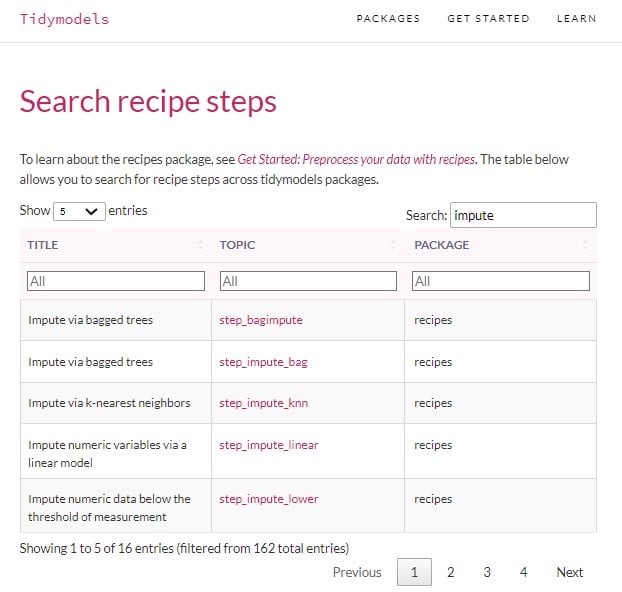
Eksik değerleri ele alıp sahte değişkenleri aynı tarifte oluşturabiliriz.
lr_recipe <-
recipe(Loan_Status ~.,
data = train) %>%
update_role(Loan_ID,
new_role = "ID" ) %>%
step_impute_knn(all_predictors()) %>%
step_dummy(all_nominal_predictors())
Tarifi yazdırın
lr_recipe
Recipe
Inputs:
role #variables
ID 1
outcome 1
predictor 30
Operations:
K-nearest neighbor imputation for all_predictors()
Dummy variables from all_nominal_predictors()
Diğer atama yöntemlerini ve tüm tarif adımlarını tidymodels dokümantasyonunda bulabilirsiniz: www.tidymodels.org/find/recipes
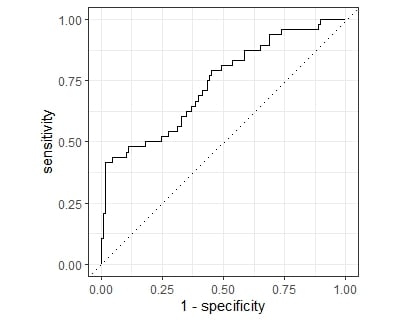
# Fit
lr_fit <-
lr_workflow %>% fit(data = train)
lr_aug <-
lr_fit %>% augment(test)
# Assess
lr_aug %>%
roc_curve(truth = Loan_Status, .pred_N) %>%
autoplot()
bind_rows(lr_aug %>%
roc_auc(truth = Loan_Status,
.pred_N),
lr_aug %>%
accuracy(truth = Loan_Status,
.pred_class))
# A tibble: 2 × 3
.metric .estimator .estimate
<chr> <chr> <dbl>
1 roc_auc binary 0.738
2 accuracy binary 0.792

R'da Feature Engineering