Ki-kare testi
Python ile Anket Verilerini Analiz Etme

EbunOluwa Andrew
Data Scientist
Ki-kare testi
- Kategorik değişken dağılımına dair çıkarımlar
- Gözlenen ile beklenen gözlemleri karşılaştırır

Anket analizinde neden ki-kare testi
Çıktı değişkeniyle ilgili girdileri seçin
Değişkenlerin popülasyon üzerindeki etkisini anlayın
Farklar tesadüfi mi yoksa istatistiksel olarak anlamlı mı, kontrol edin

1 Unsplash’ta Firmbee.com’un fotoğrafı
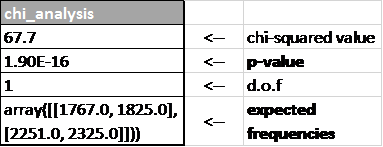
pet_survey sonucu ve yorum