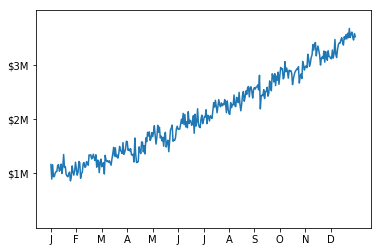
Grafikleri özelleştirme
MATLAB Kullanıcıları için Python

Justin Kiggins
Product Manager
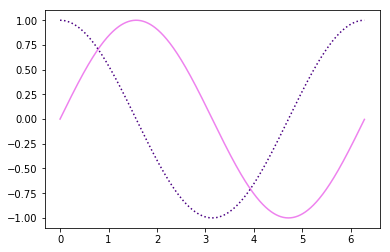
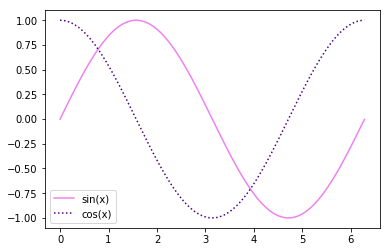
Özel renkler
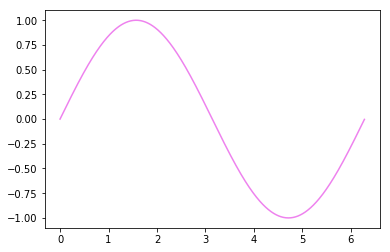
Özel çizgi stilleri
Gösterge ekleme
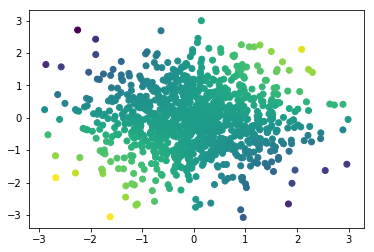
Renk ile veri kodlama
Özel eksen etiketleri
MATLAB Kullanıcıları için Python
Justin Kiggins
Product Manager

