R ile plotly'de Orta Düzey Etkileşimli Veri Görselleştirme
Adam Loy
Statistician, Carleton College

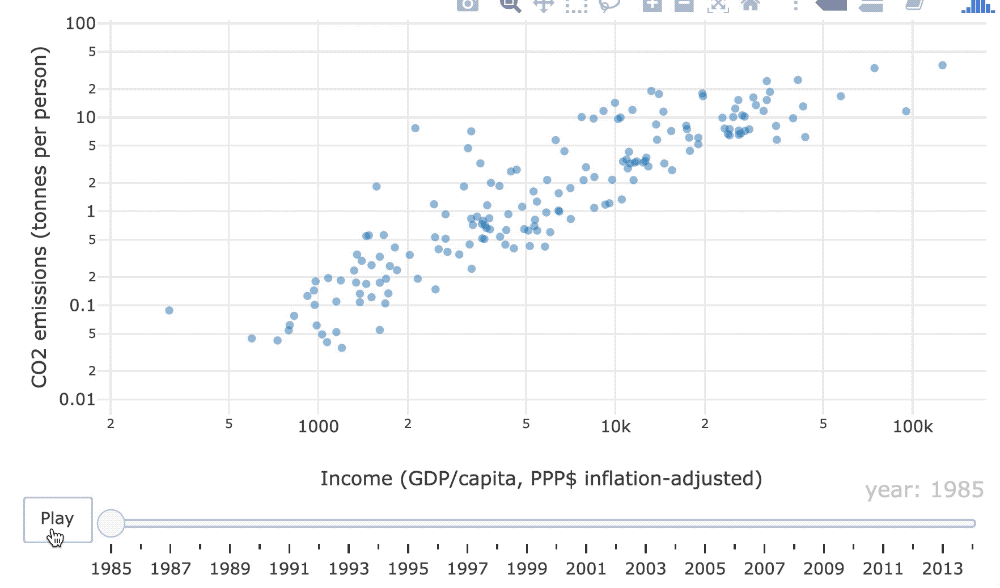
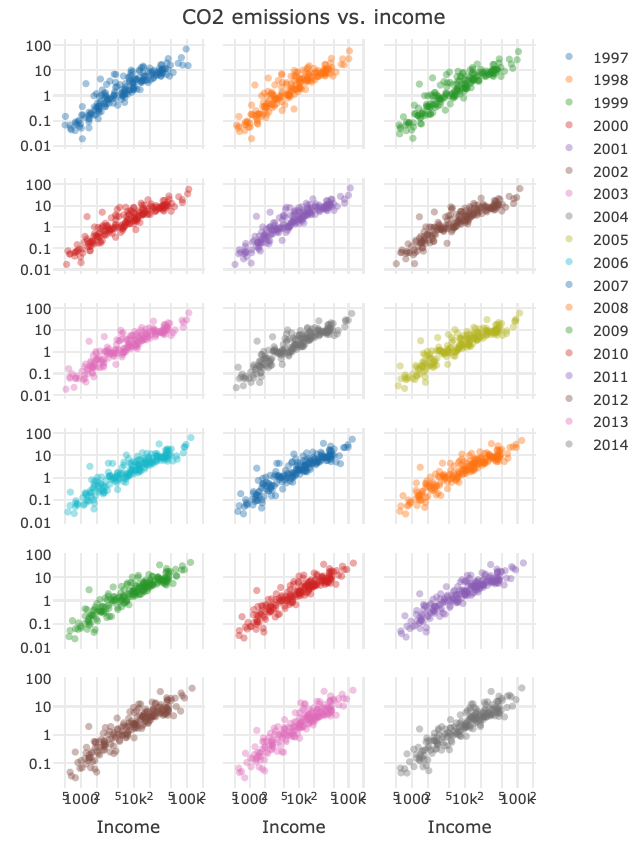
Is it easier to see the changes over time based on the animation? Or the faceted views?
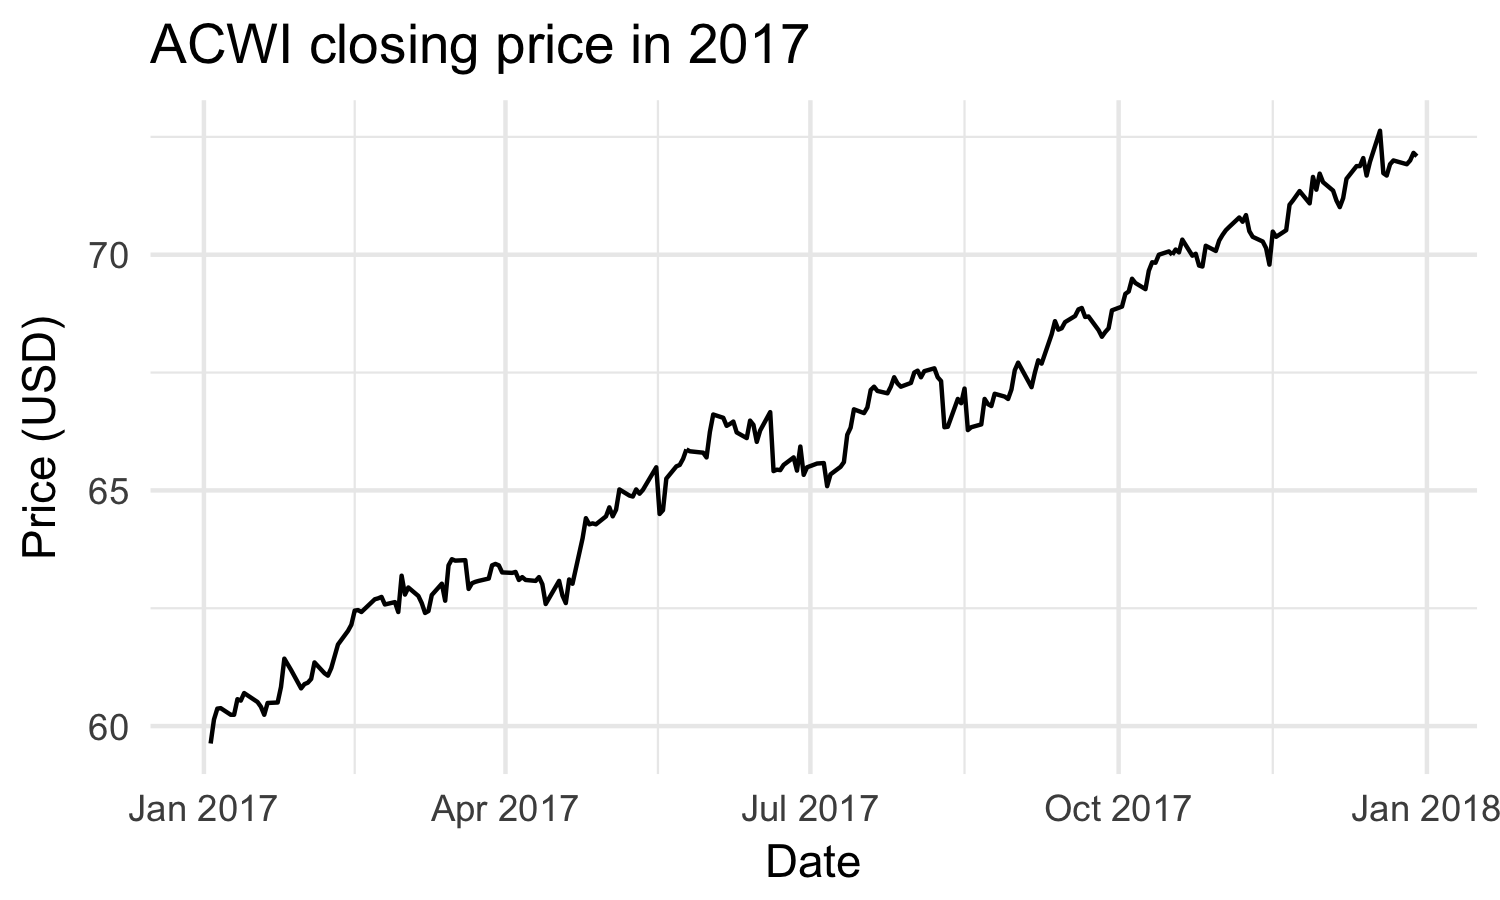
Visualization library for interactive and dynamic web-based graphics
Still under active development
Static
Interactive
Dynamic
A static graphic is permanently fixed after it is created
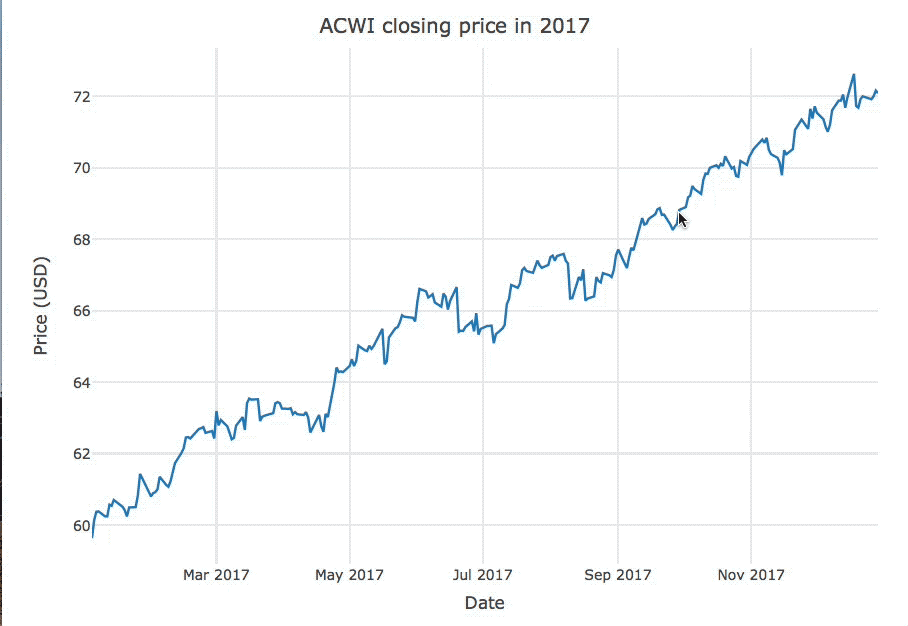
An interactive graphic changes based on an action performed by the user

A dynamic graphic changes periodically without user input

msci
# A tibble: 251 x 7
Date Open High Low Close Volume Adjusted
<date> <dbl> <dbl> <dbl> <dbl> <int> <dbl>
1 2017-01-03 79.8 79.8 78.4 78.7 646000 77.4
2 2017-01-04 79.1 81.1 79.1 80.7 849200 79.3
3 2017-01-05 80.4 81.8 80.4 81.6 557500 80.2
4 2017-01-06 81.8 83.9 81.8 83.4 597800 82.0
5 2017-01-09 83.1 83.5 82.6 82.7 668100 81.3
6 2017-01-10 82.3 82.6 81.1 81.5 558900 80.1
7 2017-01-11 81.2 81.6 80.8 81.5 365500 80.1
# ... with 244 more rows
library(plotly)msci %>% plot_ly(x = ~Date, y = ~Close) %>% add_lines()

R ile plotly'de Orta Düzey Etkileşimli Veri Görselleştirme