Seçim stratejileri
R ile plotly'de Orta Düzey Etkileşimli Veri Görselleştirme

Adam Loy
Statistician, Carleton College
İki seçim stratejisi
Örnek
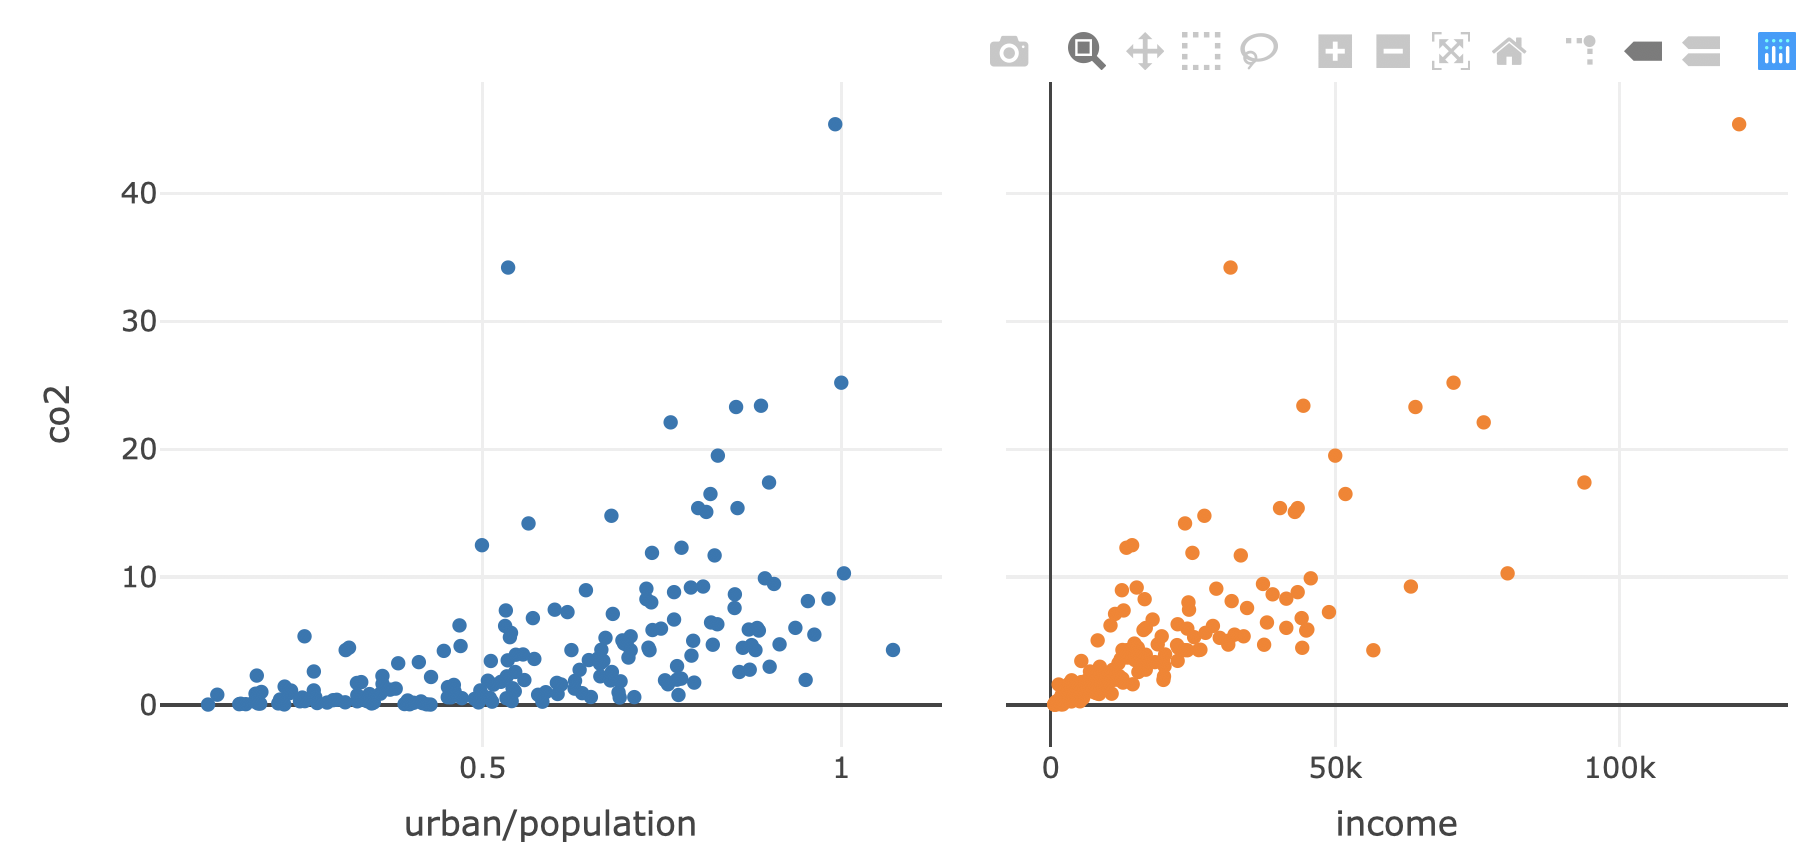
Kalıcı seçim
Kalıcı seçimi highlight() ile etkinleştirin
subplot(p1, p2, titleX = TRUE, shareY = TRUE) %>%
  hide_legend() %>%
  highlight(persistent = TRUE)
Renkli vurgulama
İki etkileşim türü