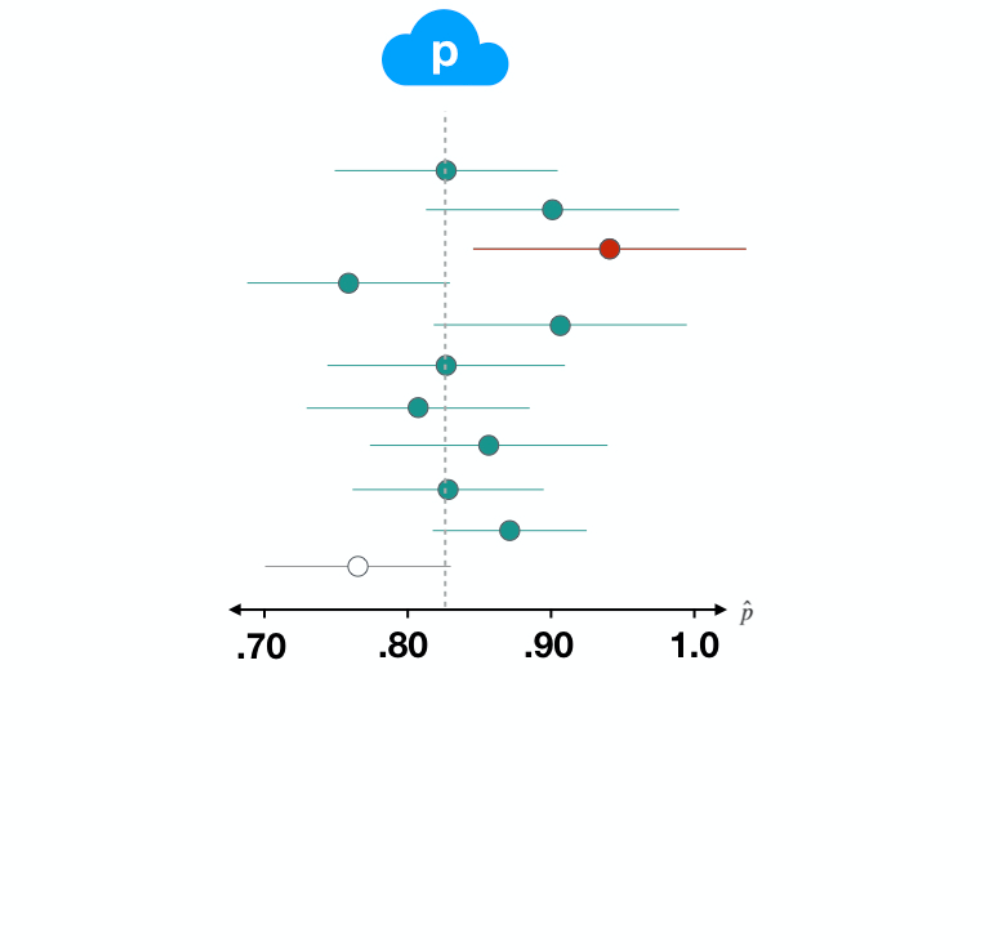
Bir Güven Aralığını Yorumlama
R ile Kategorik Verilerde Çıkarım

Andrew Bray
Assistant Professor of Statistics at Reed College
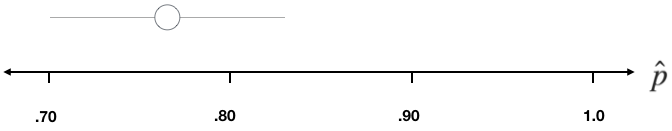
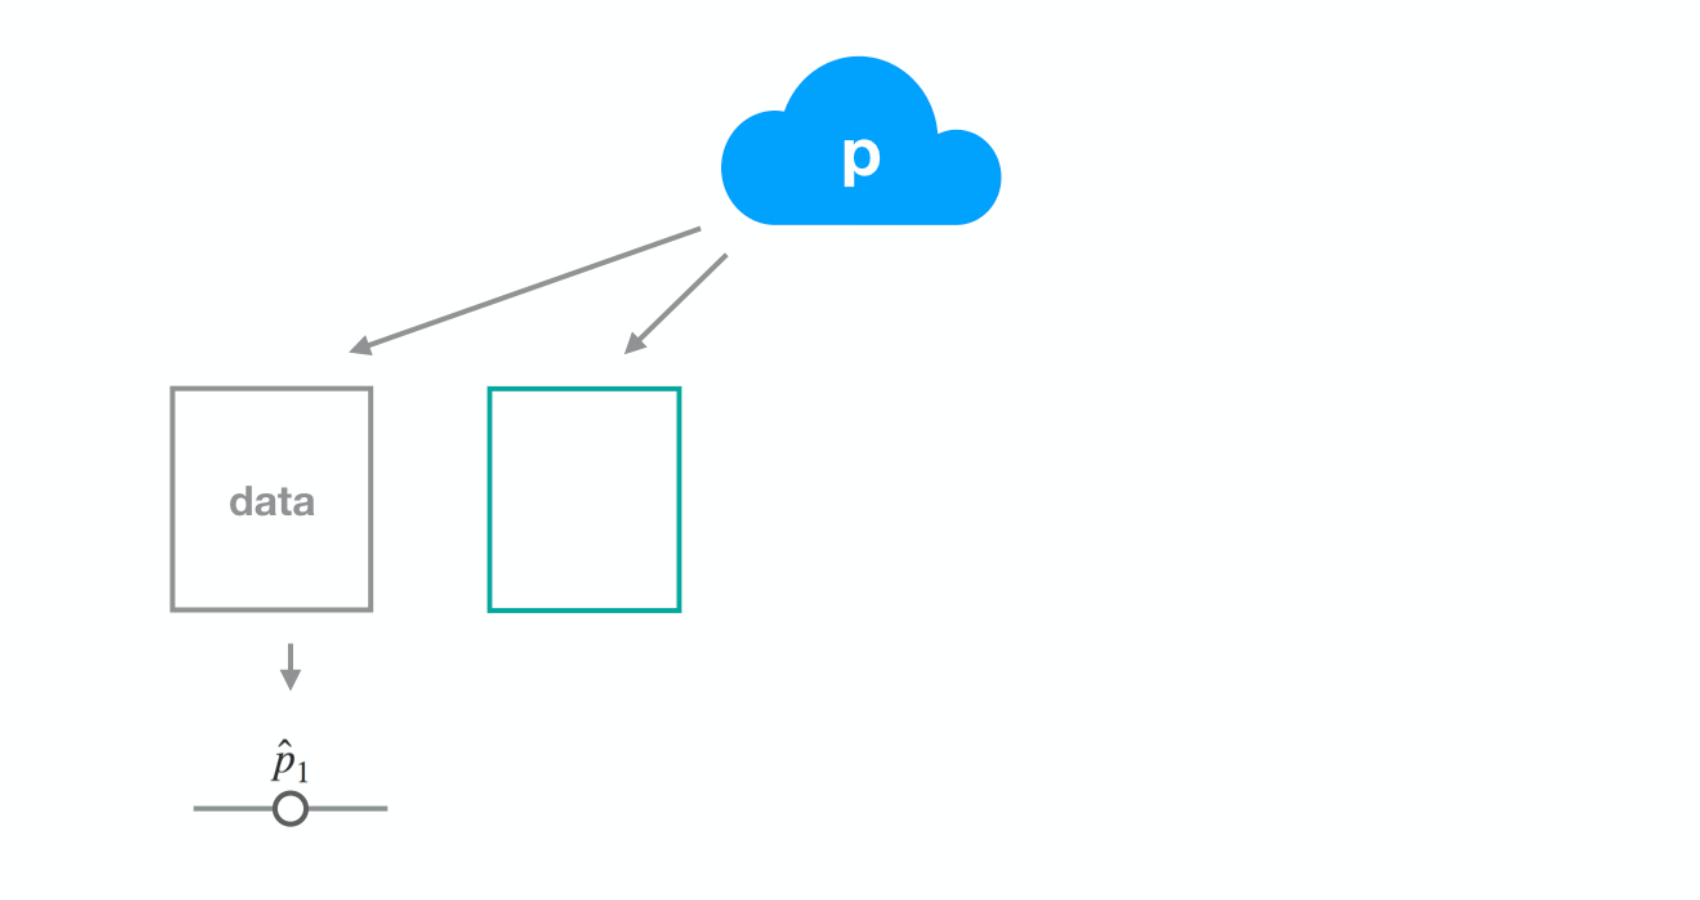
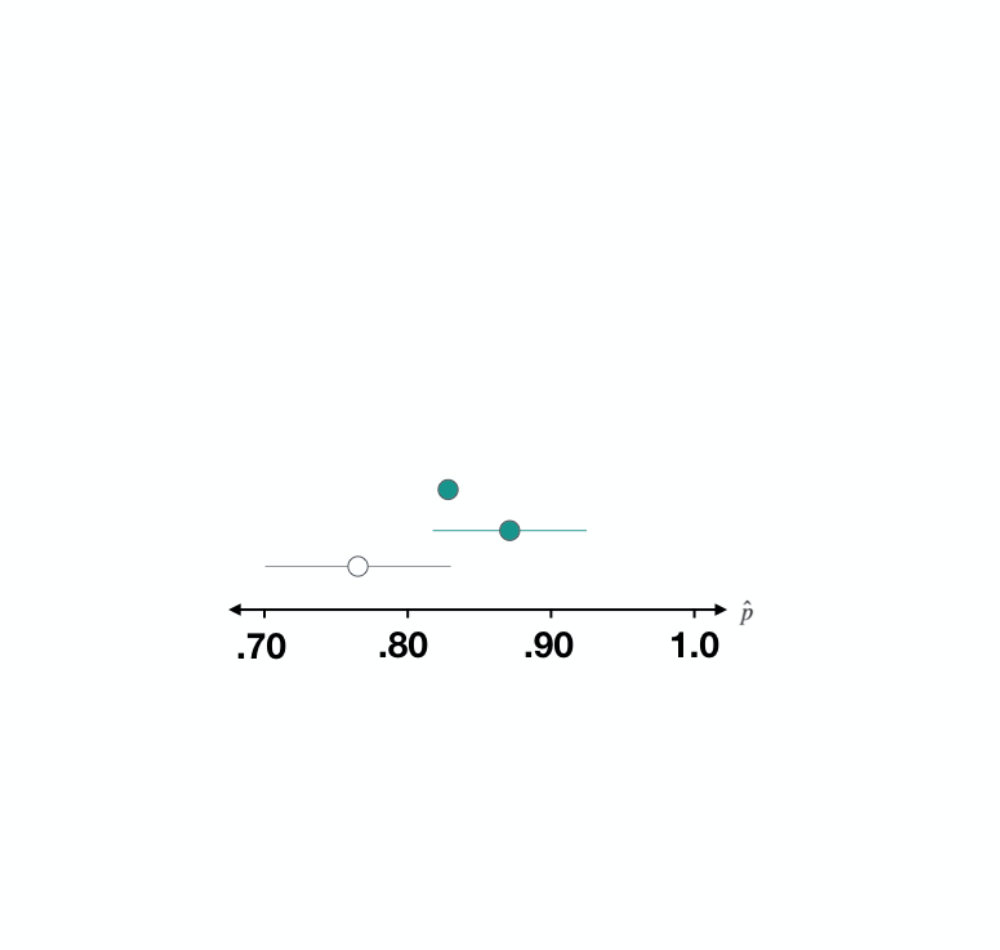
Veri Kümesi 1

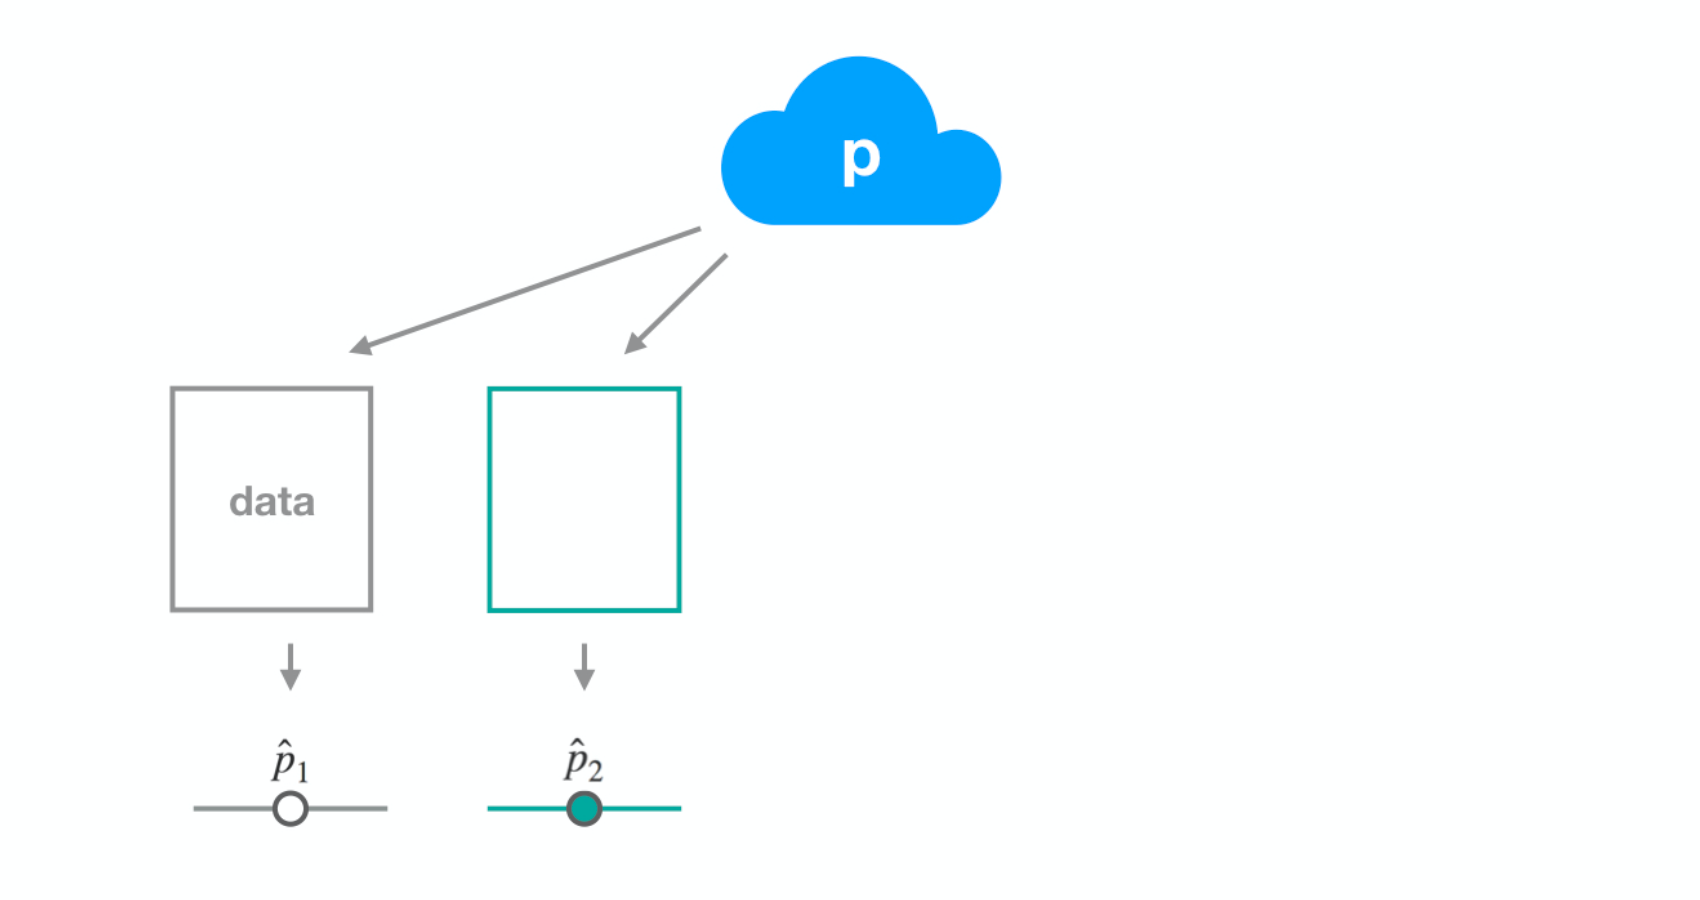
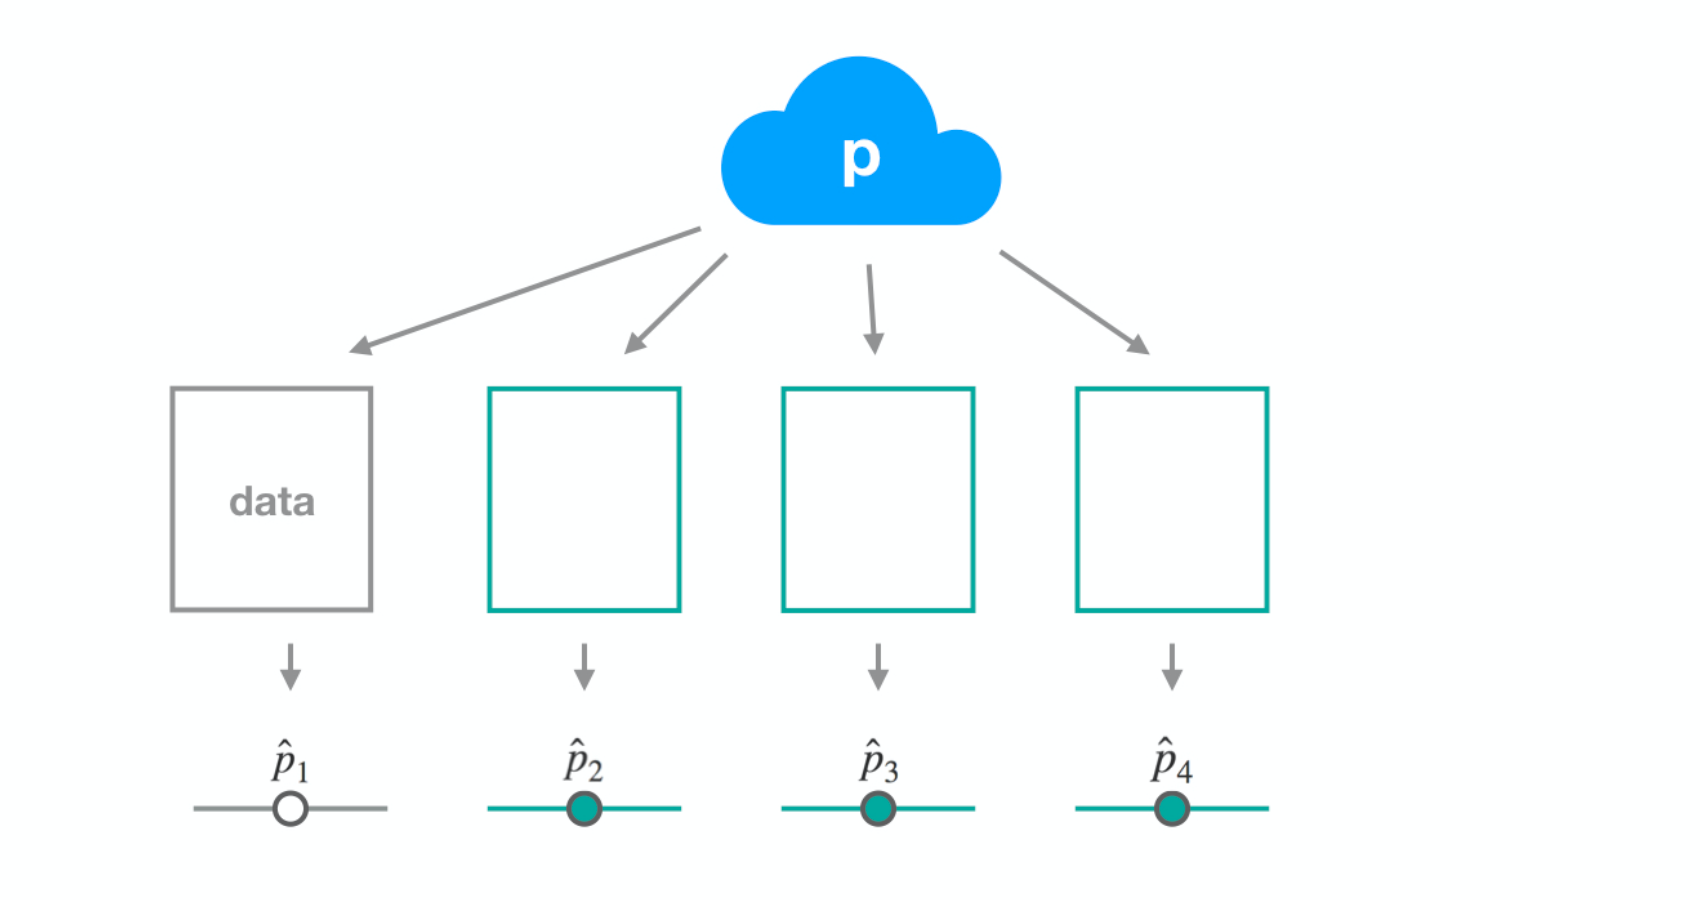
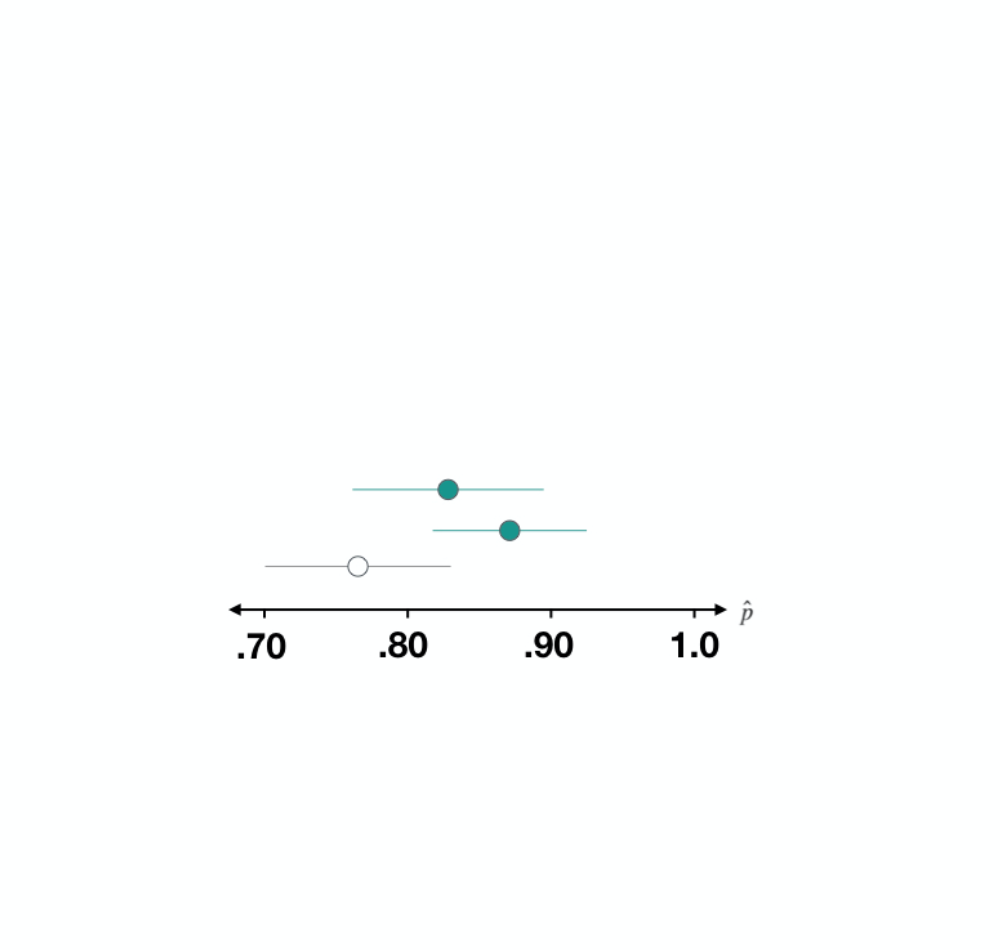
Veri Kümesi 2
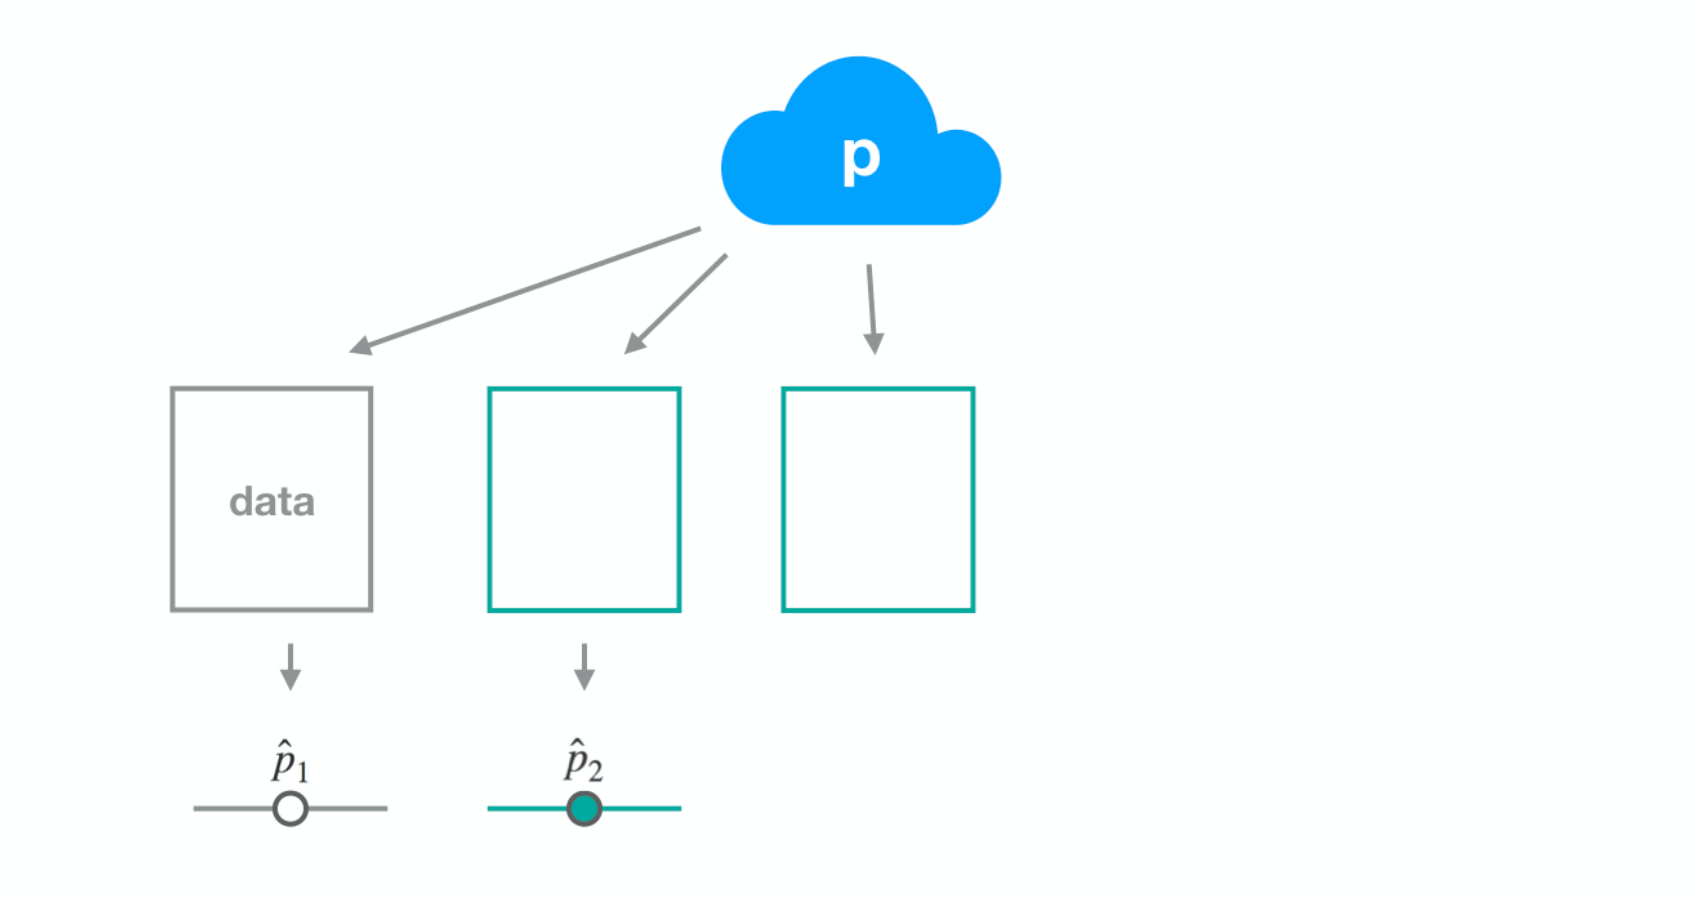
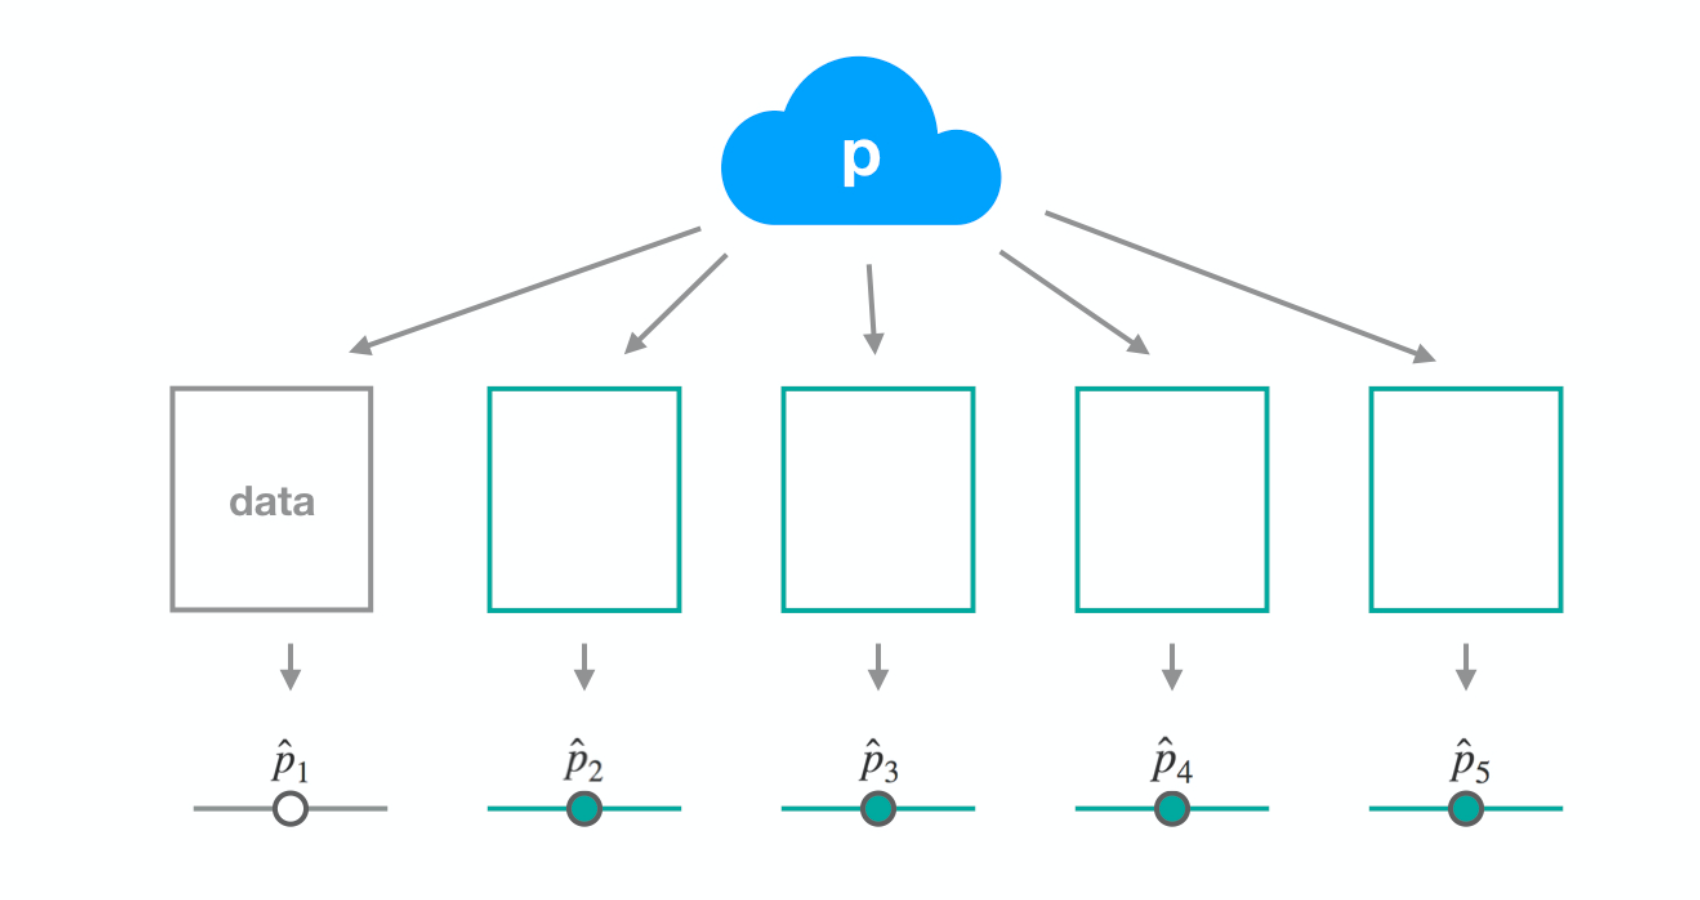
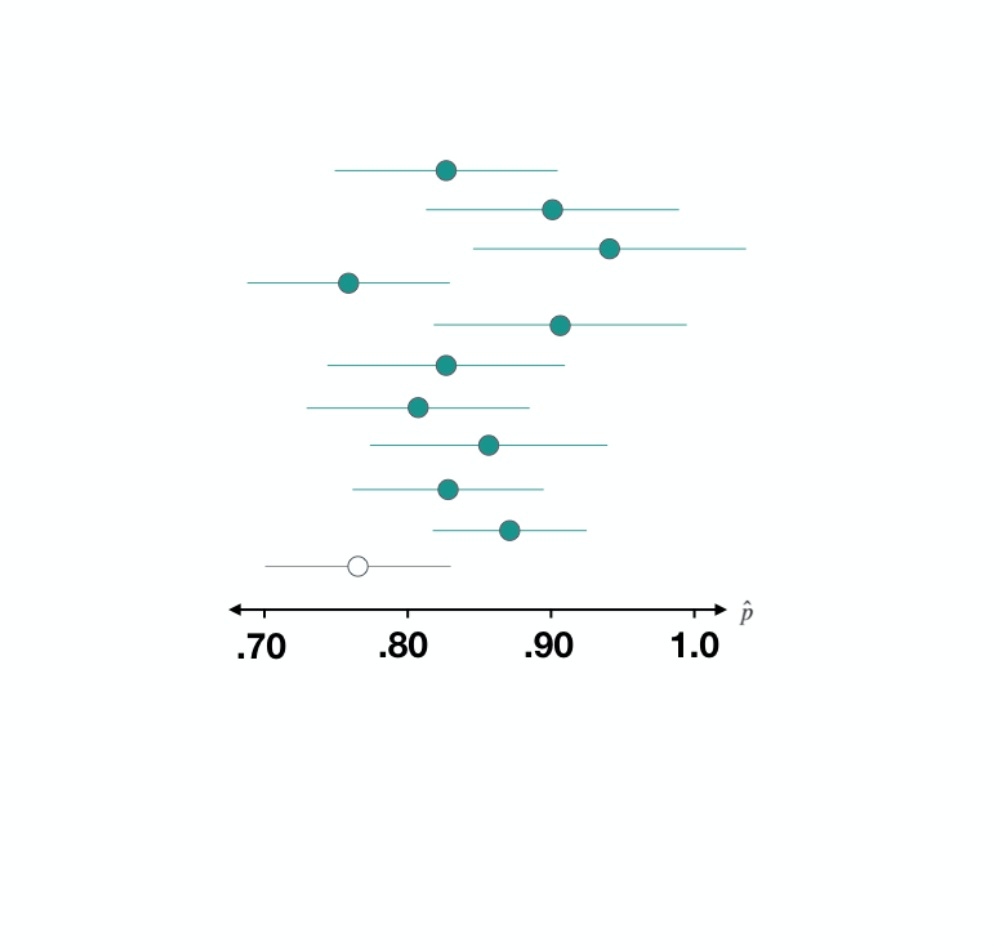
Veri Kümesi 3
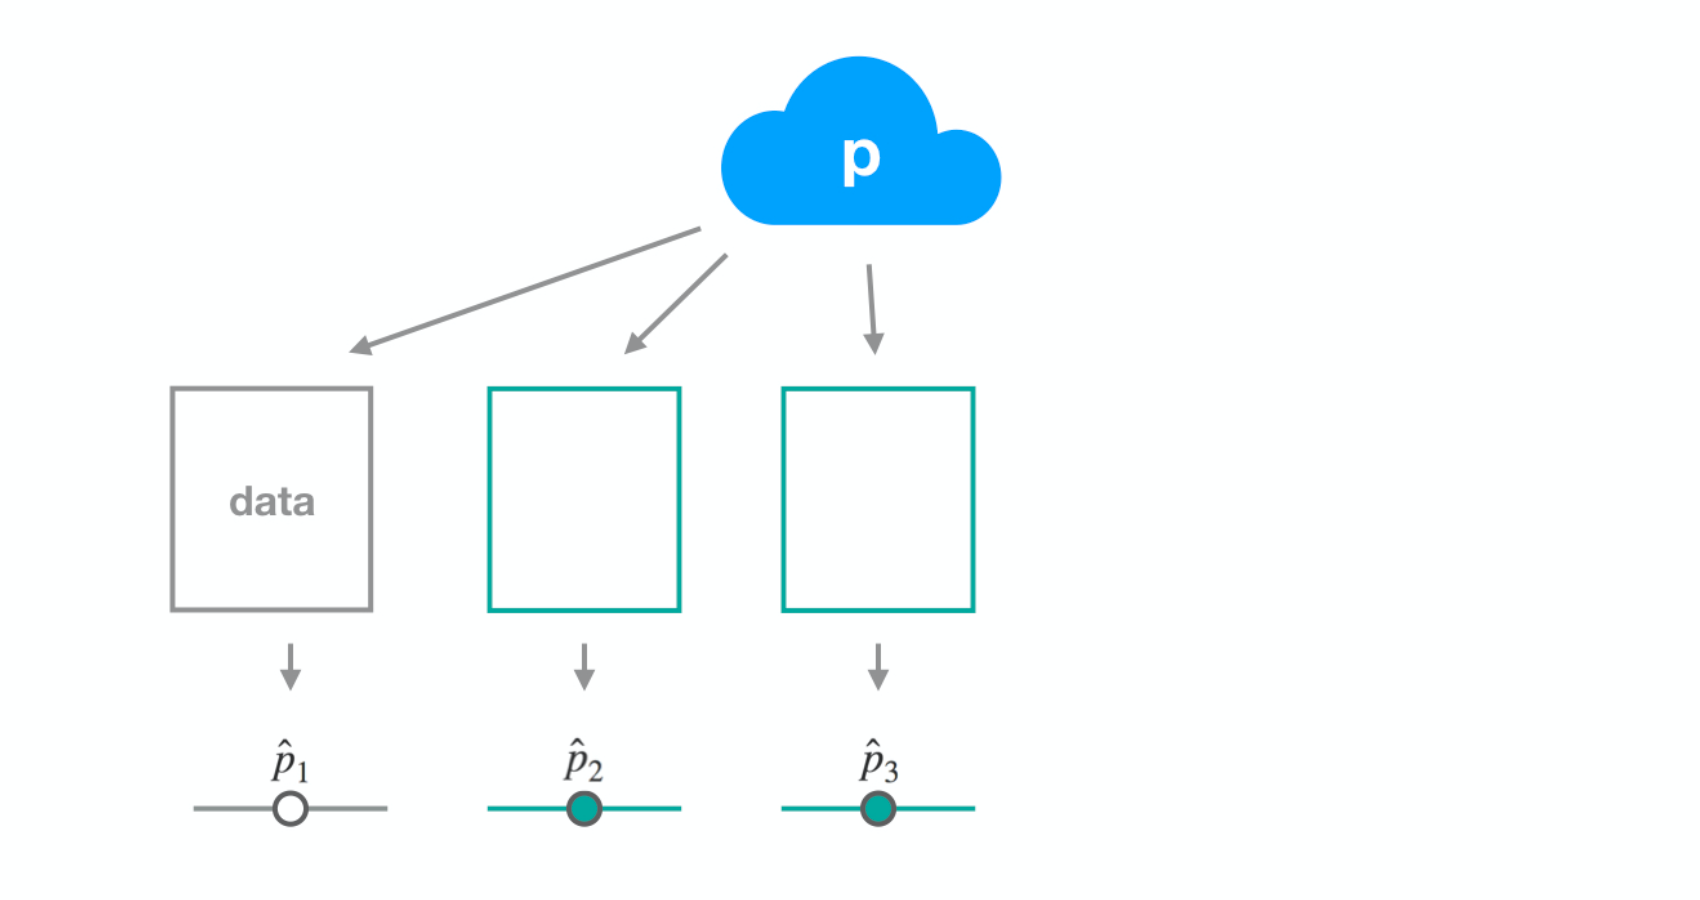
Veri Kümesi 3
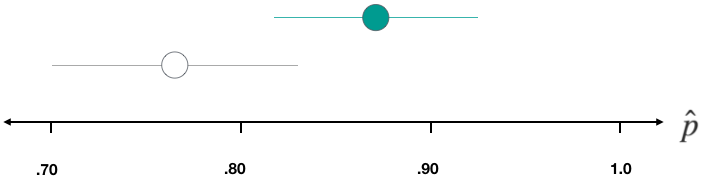
Veri Kümesi 3
Veri Kümesi 3
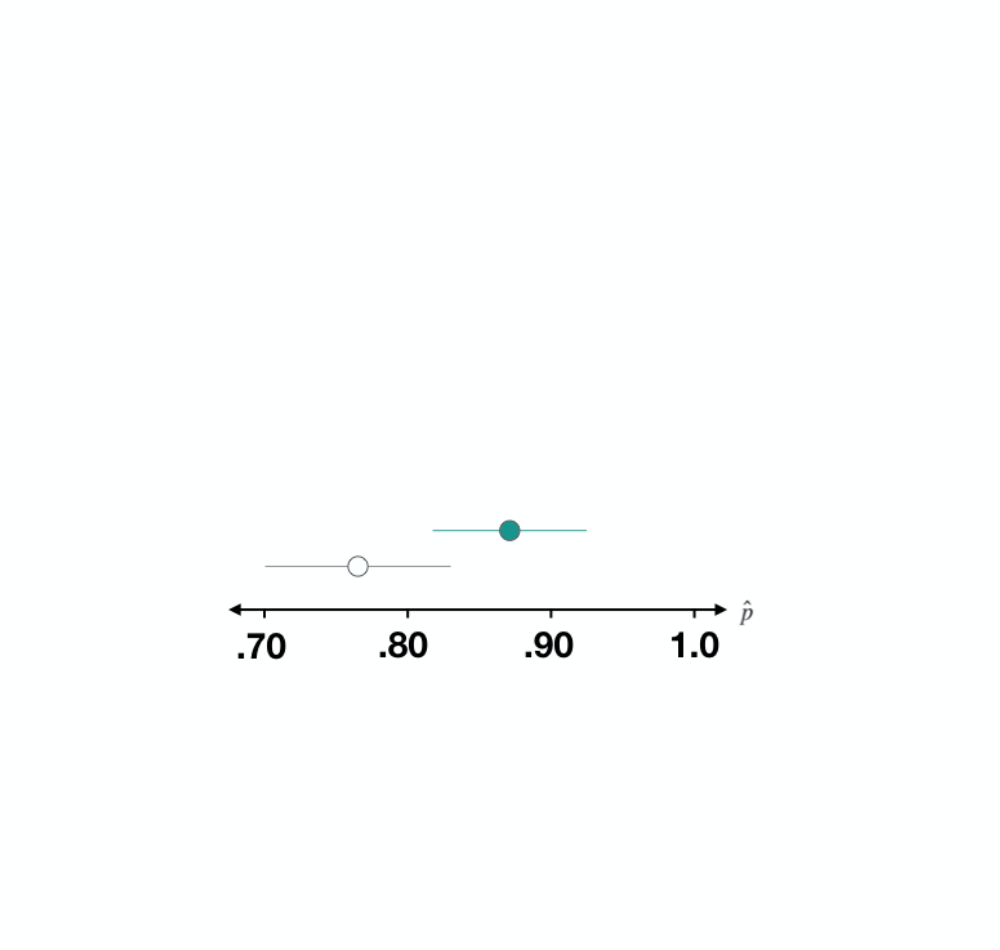
Veri Kümesi 3
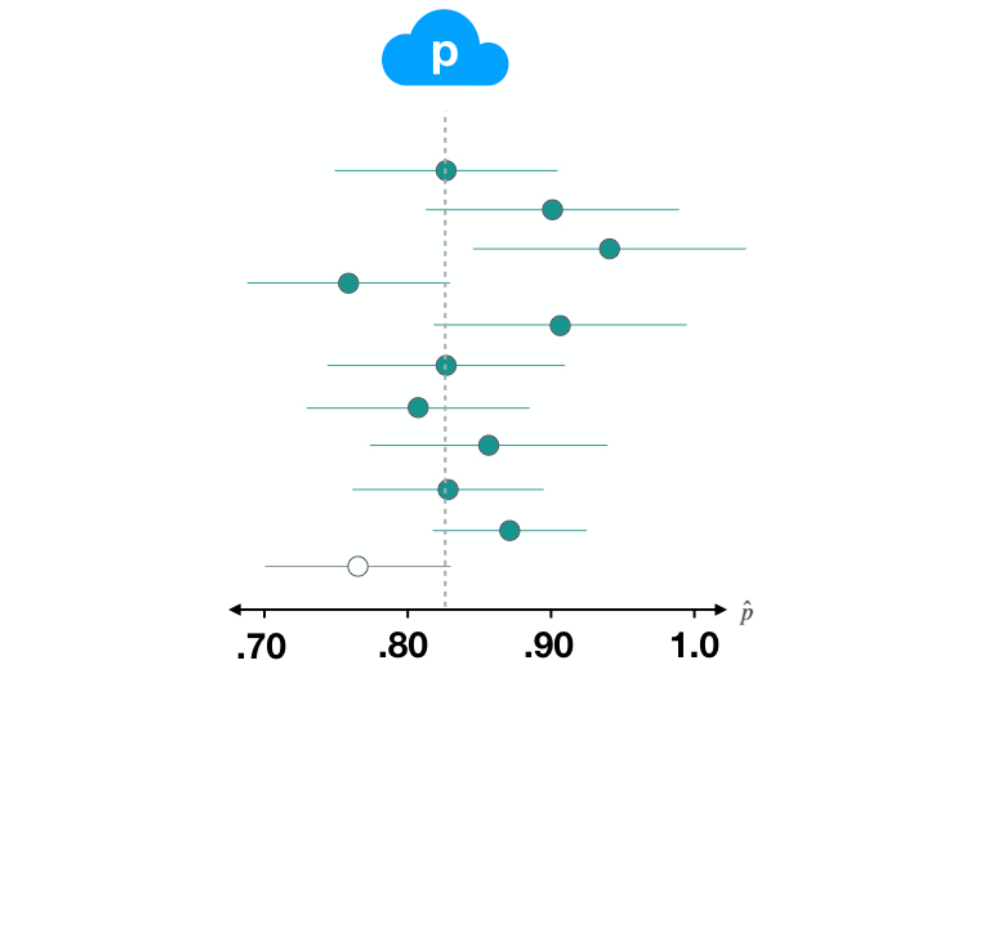
Veri Kümesi 3
R ile Kategorik Verilerde Çıkarım
Andrew Bray
Assistant Professor of Statistics at Reed College

