Adding more detail to summaries

R ile Trelliscope kullanarak Büyük Veriyi Görselleştirme

Ryan Hafen

Author, TrelliscopeJS

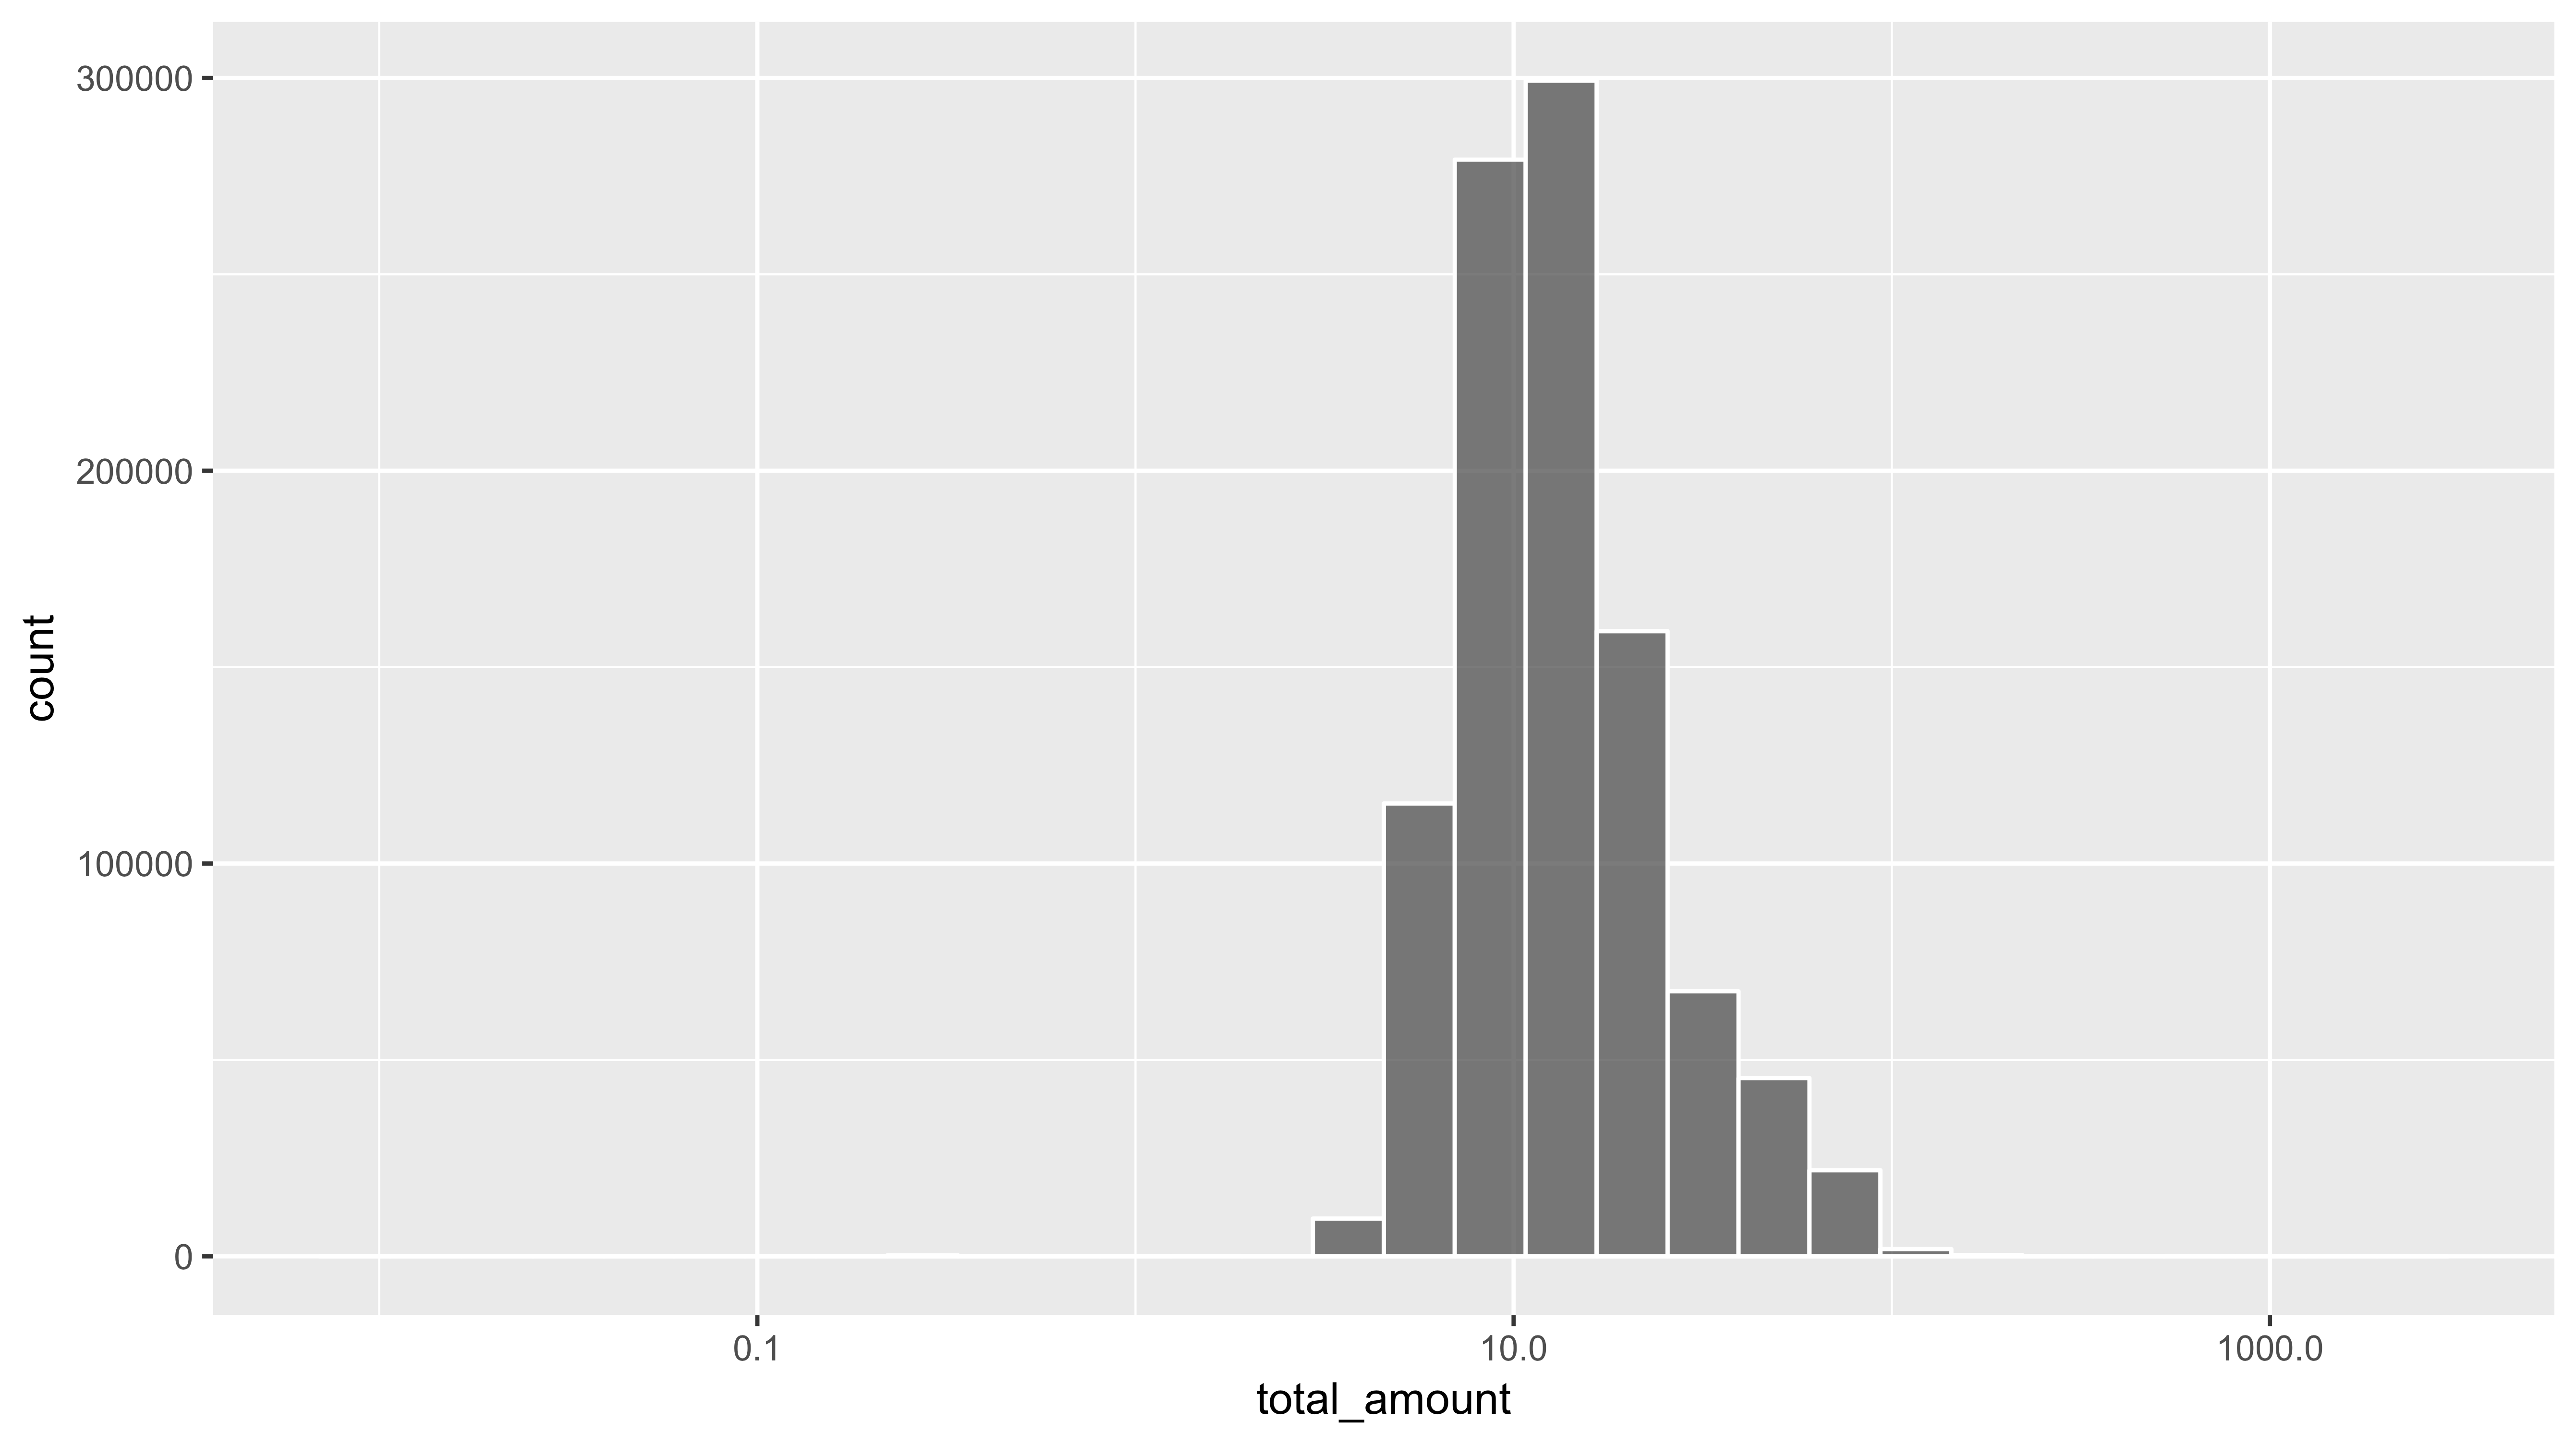
Distribution of total fare amount

R ile Trelliscope kullanarak Büyük Veriyi Görselleştirme

Adding more detail to summaries

Introduce more variables into the summary computations

  • Binning two or more continuous variables to visualize joint distribution
  • Grouping or faceting summary computations by additional variables
R ile Trelliscope kullanarak Büyük Veriyi Görselleştirme

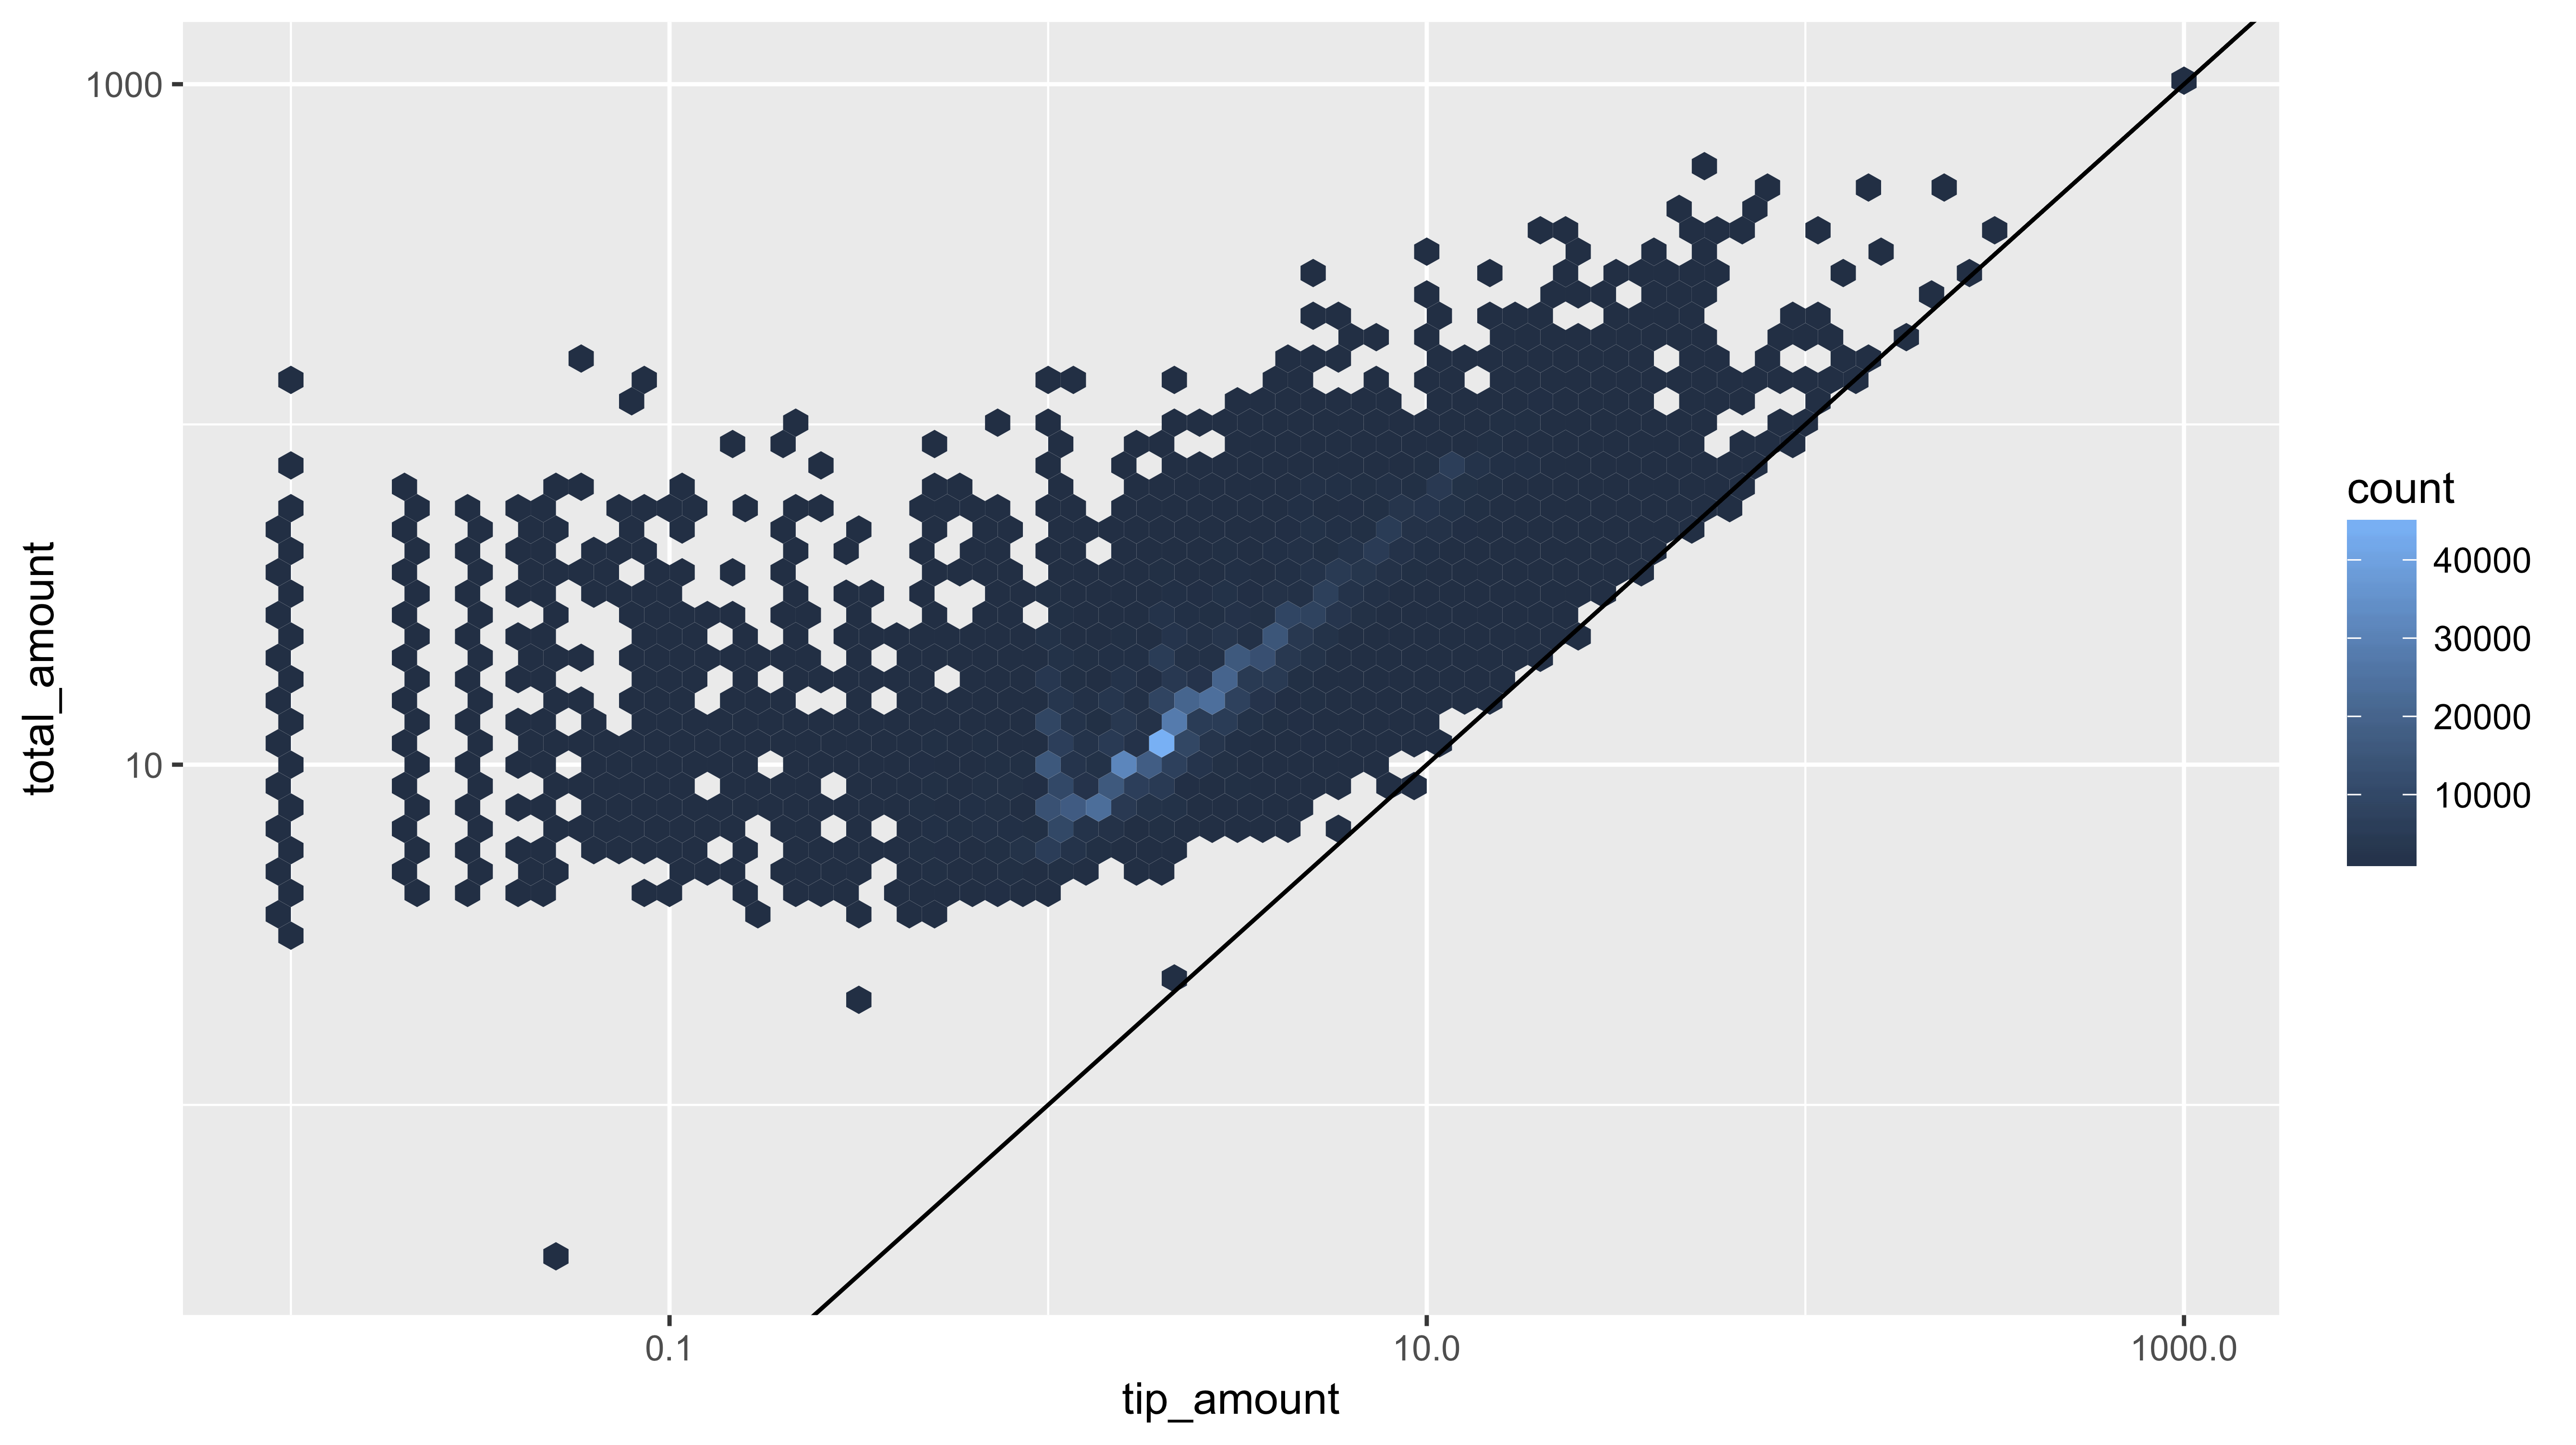
Binning continuous variables using geom_hex()

ggplot(tx, aes(tip_amount, total_amount)) +

geom_hex(bins = 75) + scale_x_log10() + scale_y_log10() + geom_abline(slope = 1, intercept = 0)

R ile Trelliscope kullanarak Büyük Veriyi Görselleştirme

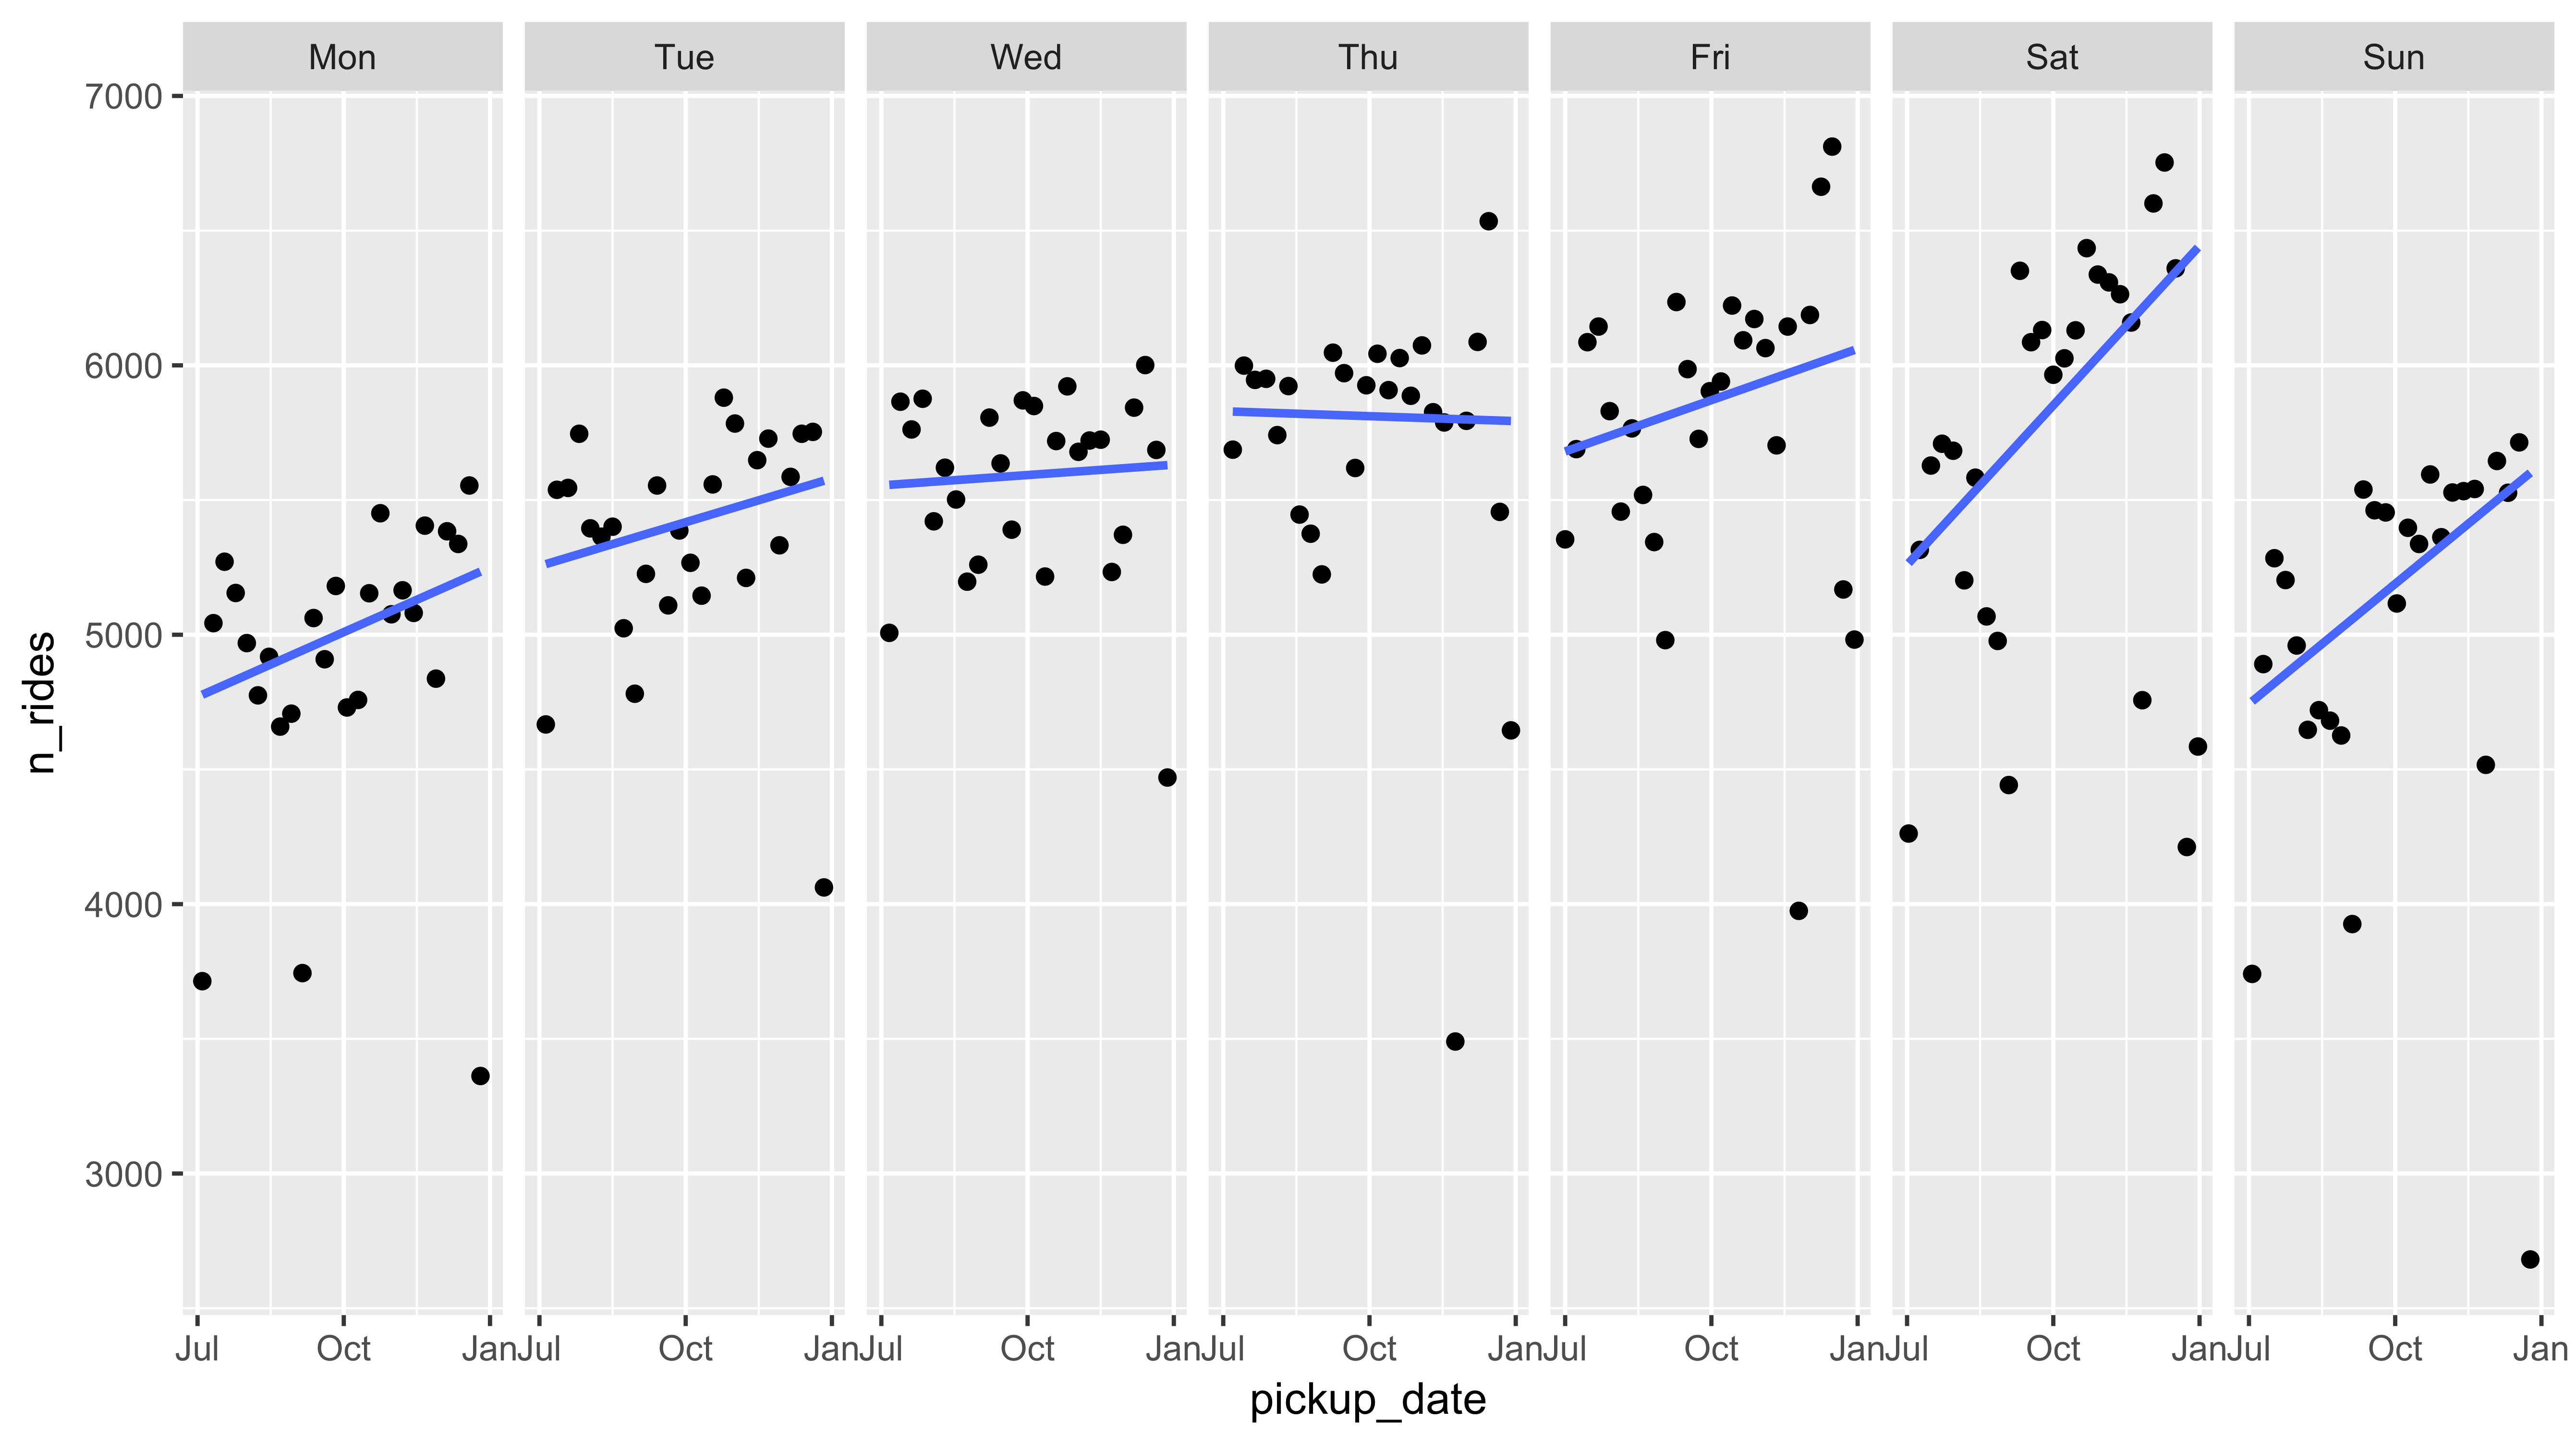
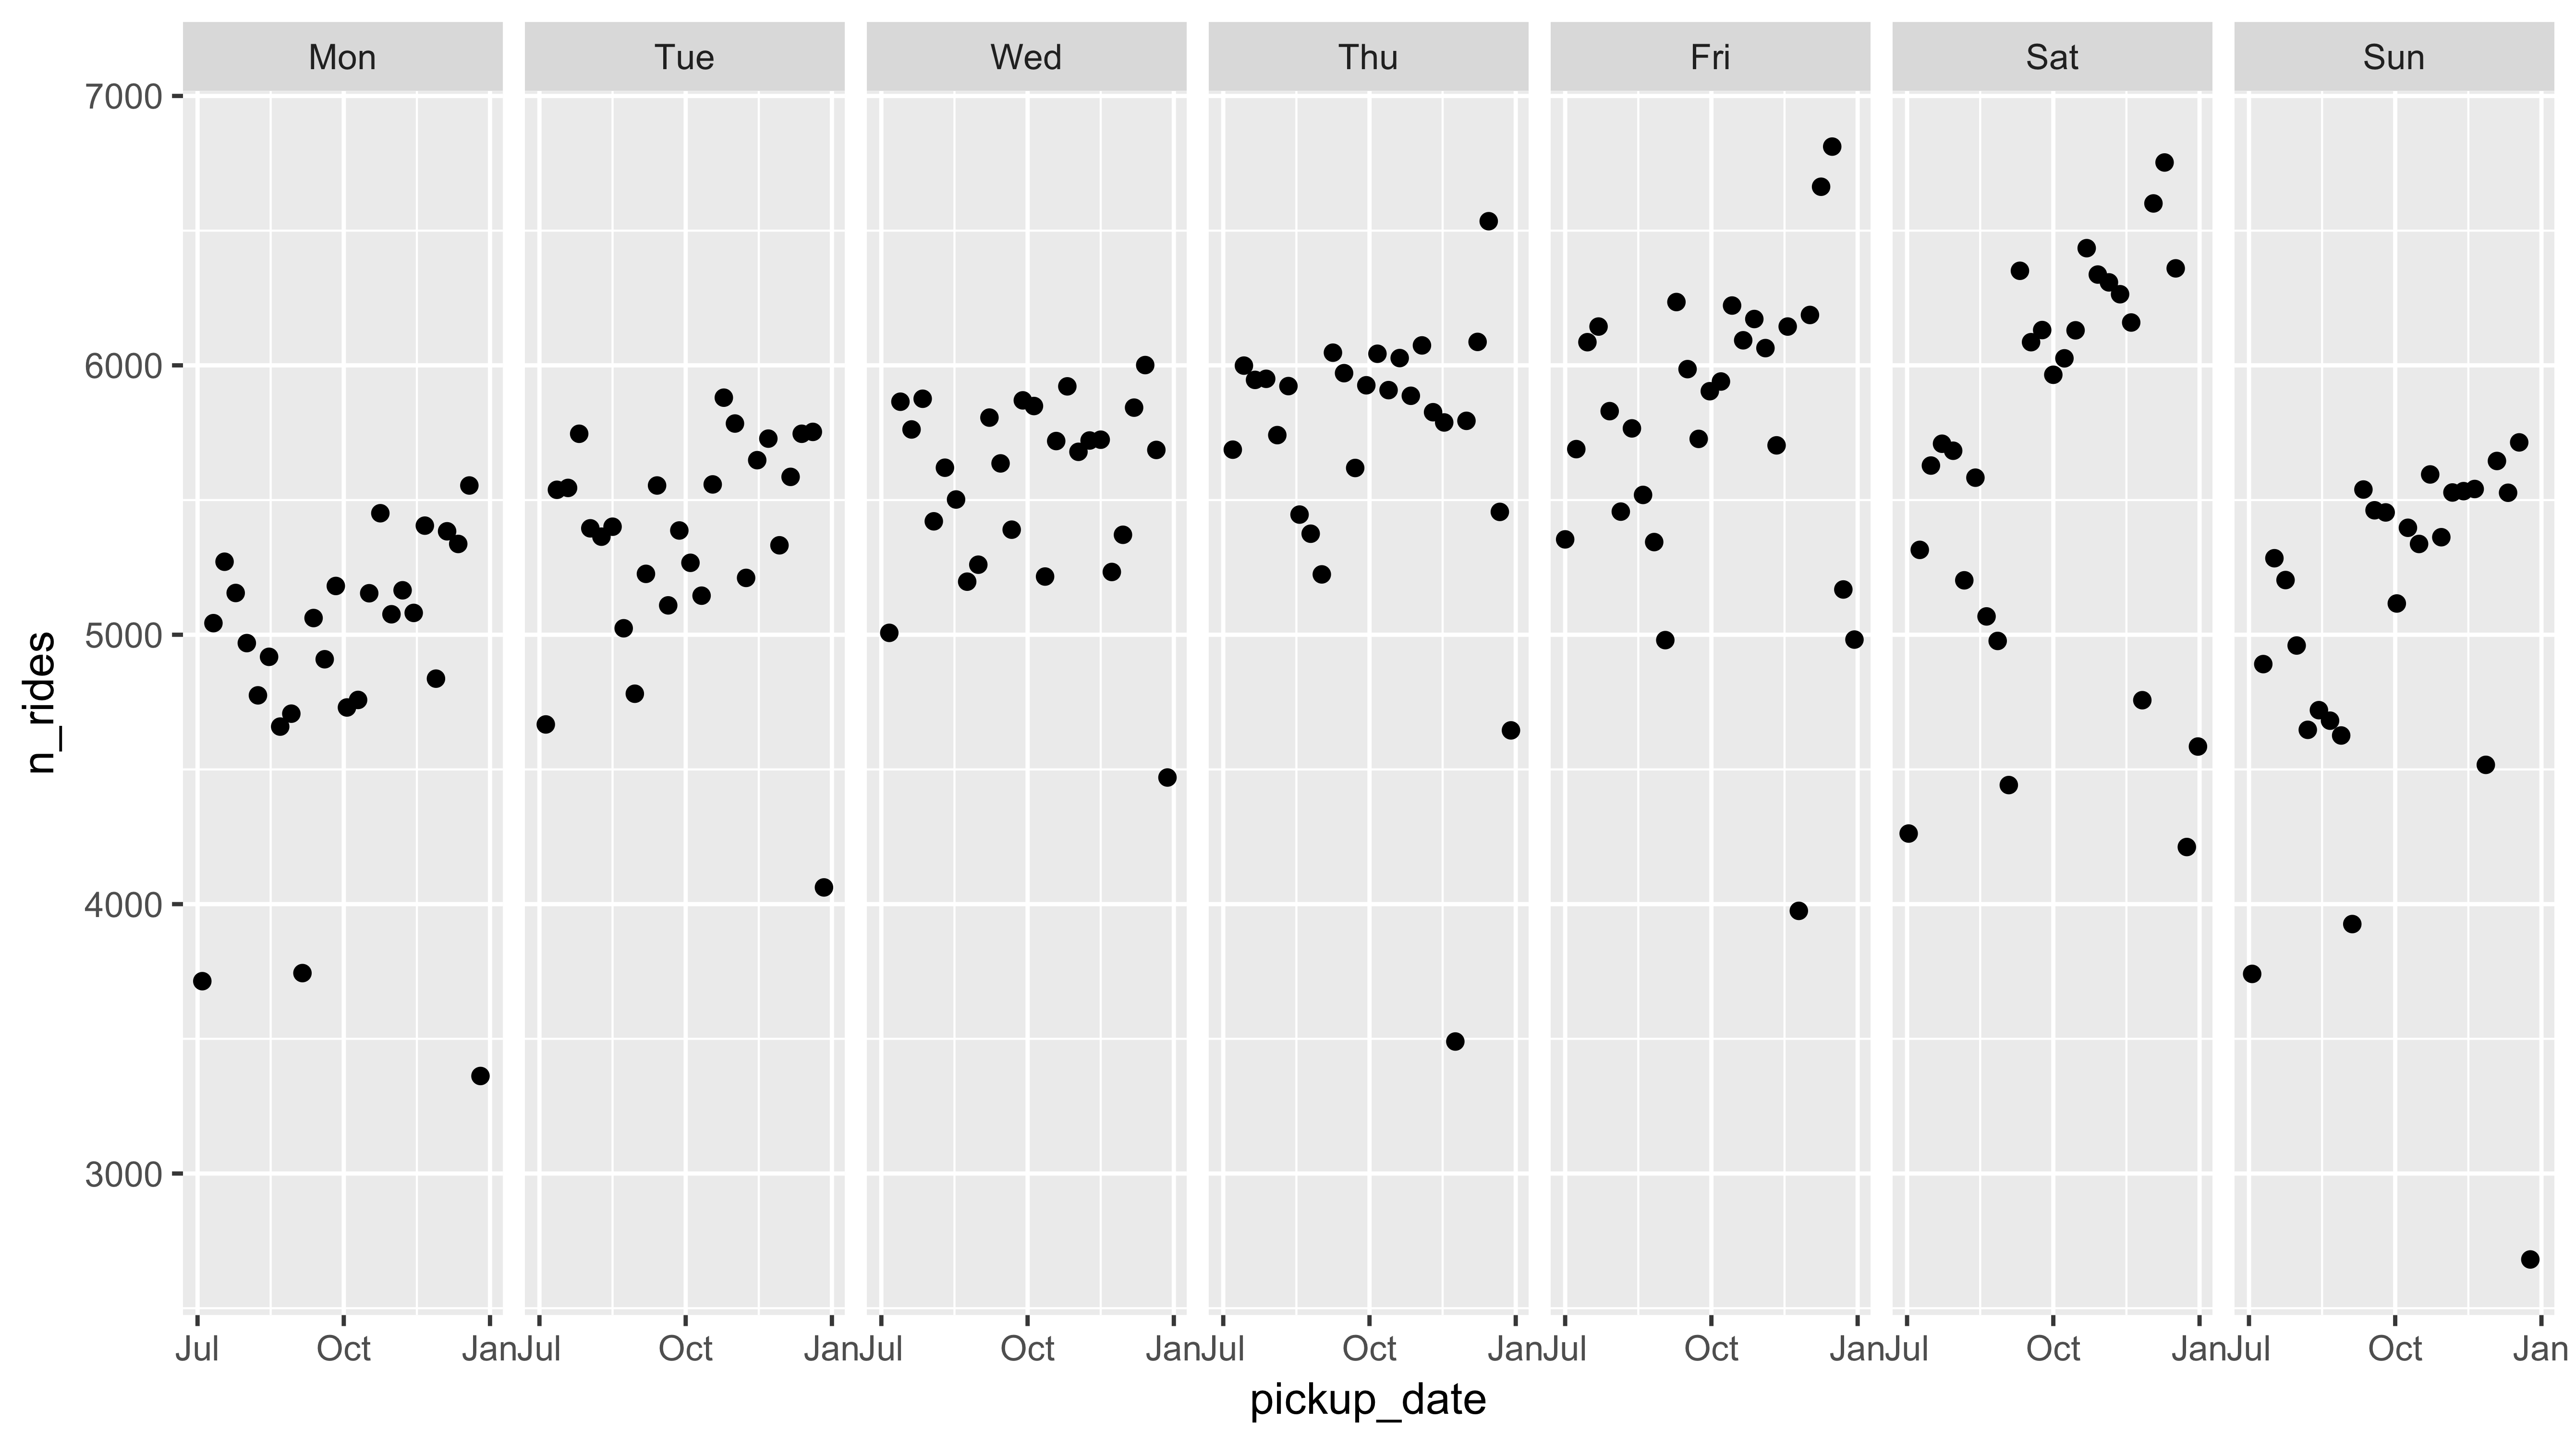
Faceting using facet_wrap()

ggplot(daily_count, aes(pickup_date, n_rides)) +
  geom_point() +
  facet_wrap(~ pickup_dow)

R ile Trelliscope kullanarak Büyük Veriyi Görselleştirme

Faceting

ggplot(daily_count, aes(pickup_date, n_rides)) +
  geom_point() +
  facet_grid(~ pickup_dow) +
  geom_smooth(method = "rlm", se = FALSE)

R ile Trelliscope kullanarak Büyük Veriyi Görselleştirme

Let's practice!

R ile Trelliscope kullanarak Büyük Veriyi Görselleştirme

Preparing Video For Download...