Harika bir ggplot dokunuşu
dplyr ile Programlama

Dr. Chester Ismay
Educator, Data Scientist, and R/Python Consultant
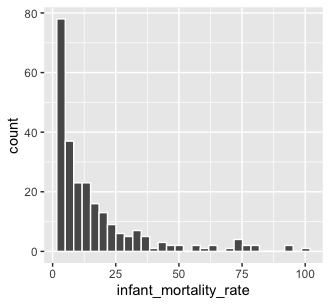
ggplot2 temelleri
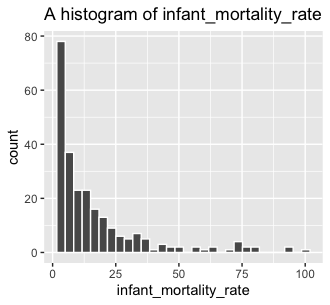
Başlık eklemek
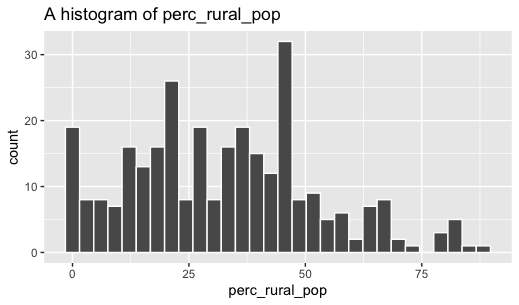
Fonksiyonumuzu kullanmak
dplyr ile Programlama
Dr. Chester Ismay
Educator, Data Scientist, and R/Python Consultant

