Julia ile Veri Görselleştirmeye Giriş
Gustavo Vieira Suñe
Data Analyst

tomato DataFrame'i| Date | Fiyat (Rupi) |
|---|---|
| FEB-2004 | 10.0 |
| MAR-2004 | 12.0 |
| APR-2004 | 6.0 |
| MAY-2004 | 8.0 |
| ... | ... |
tomato.Date = sort(
tomato.Date, :Date
)
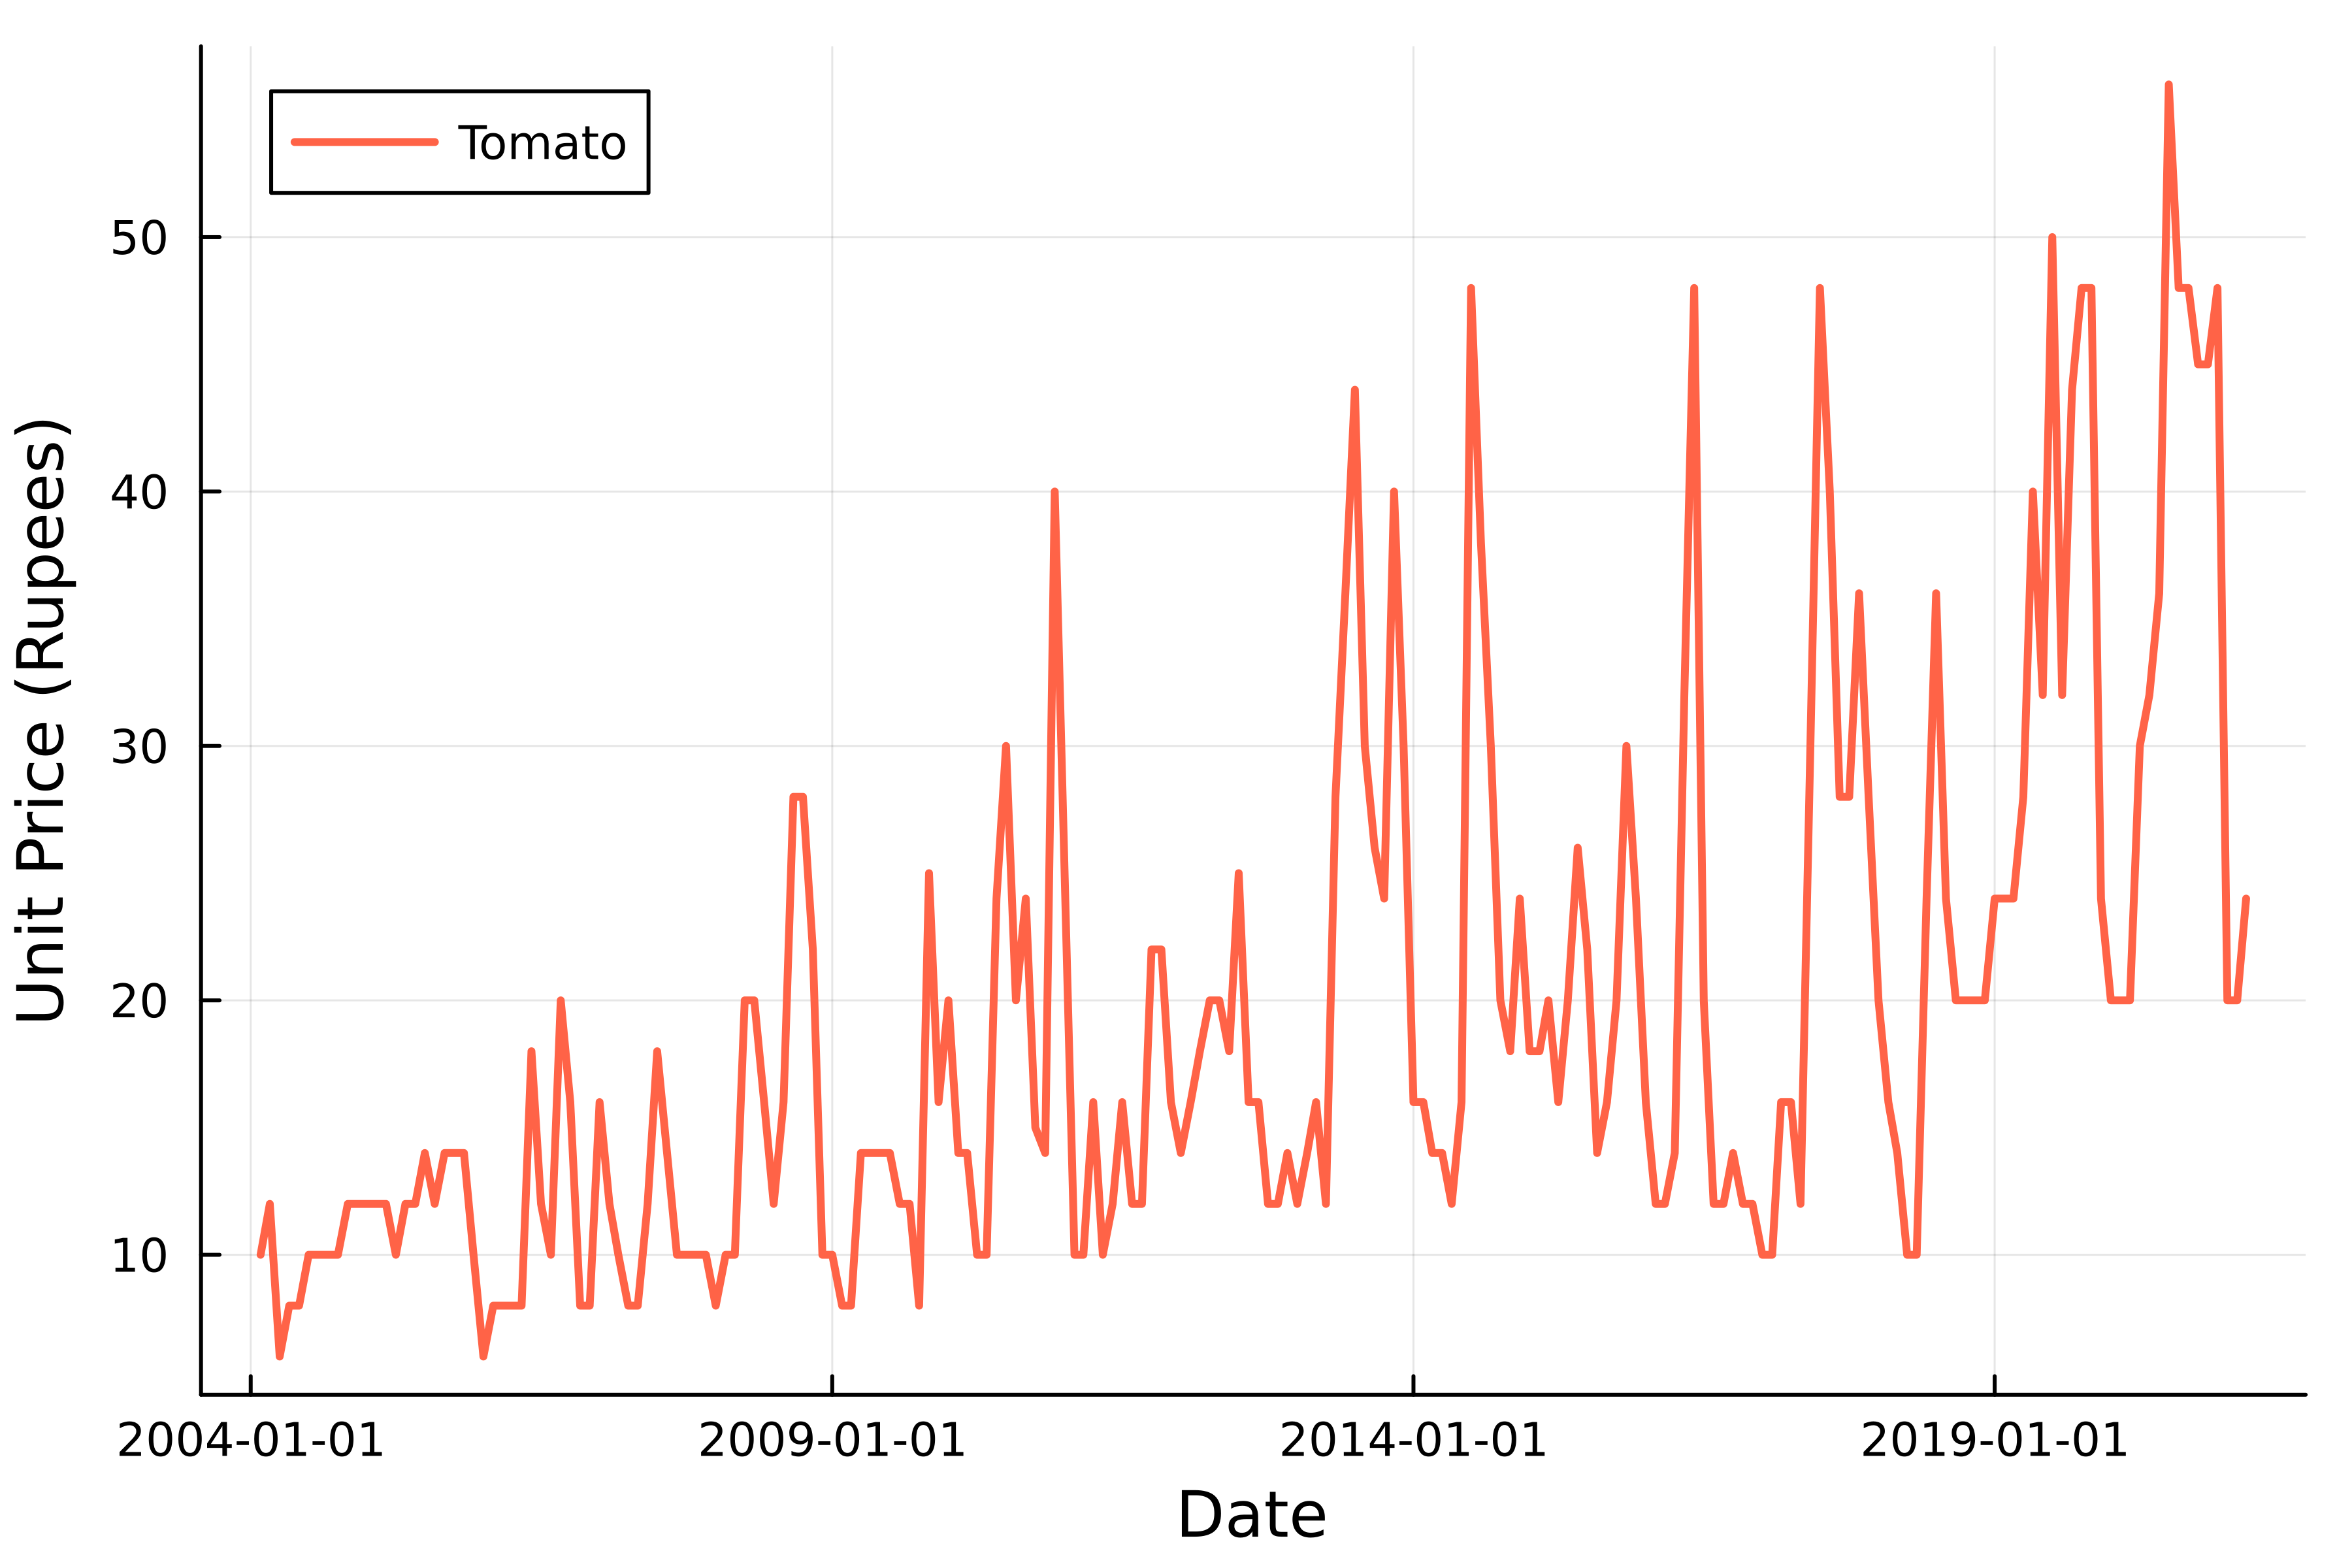
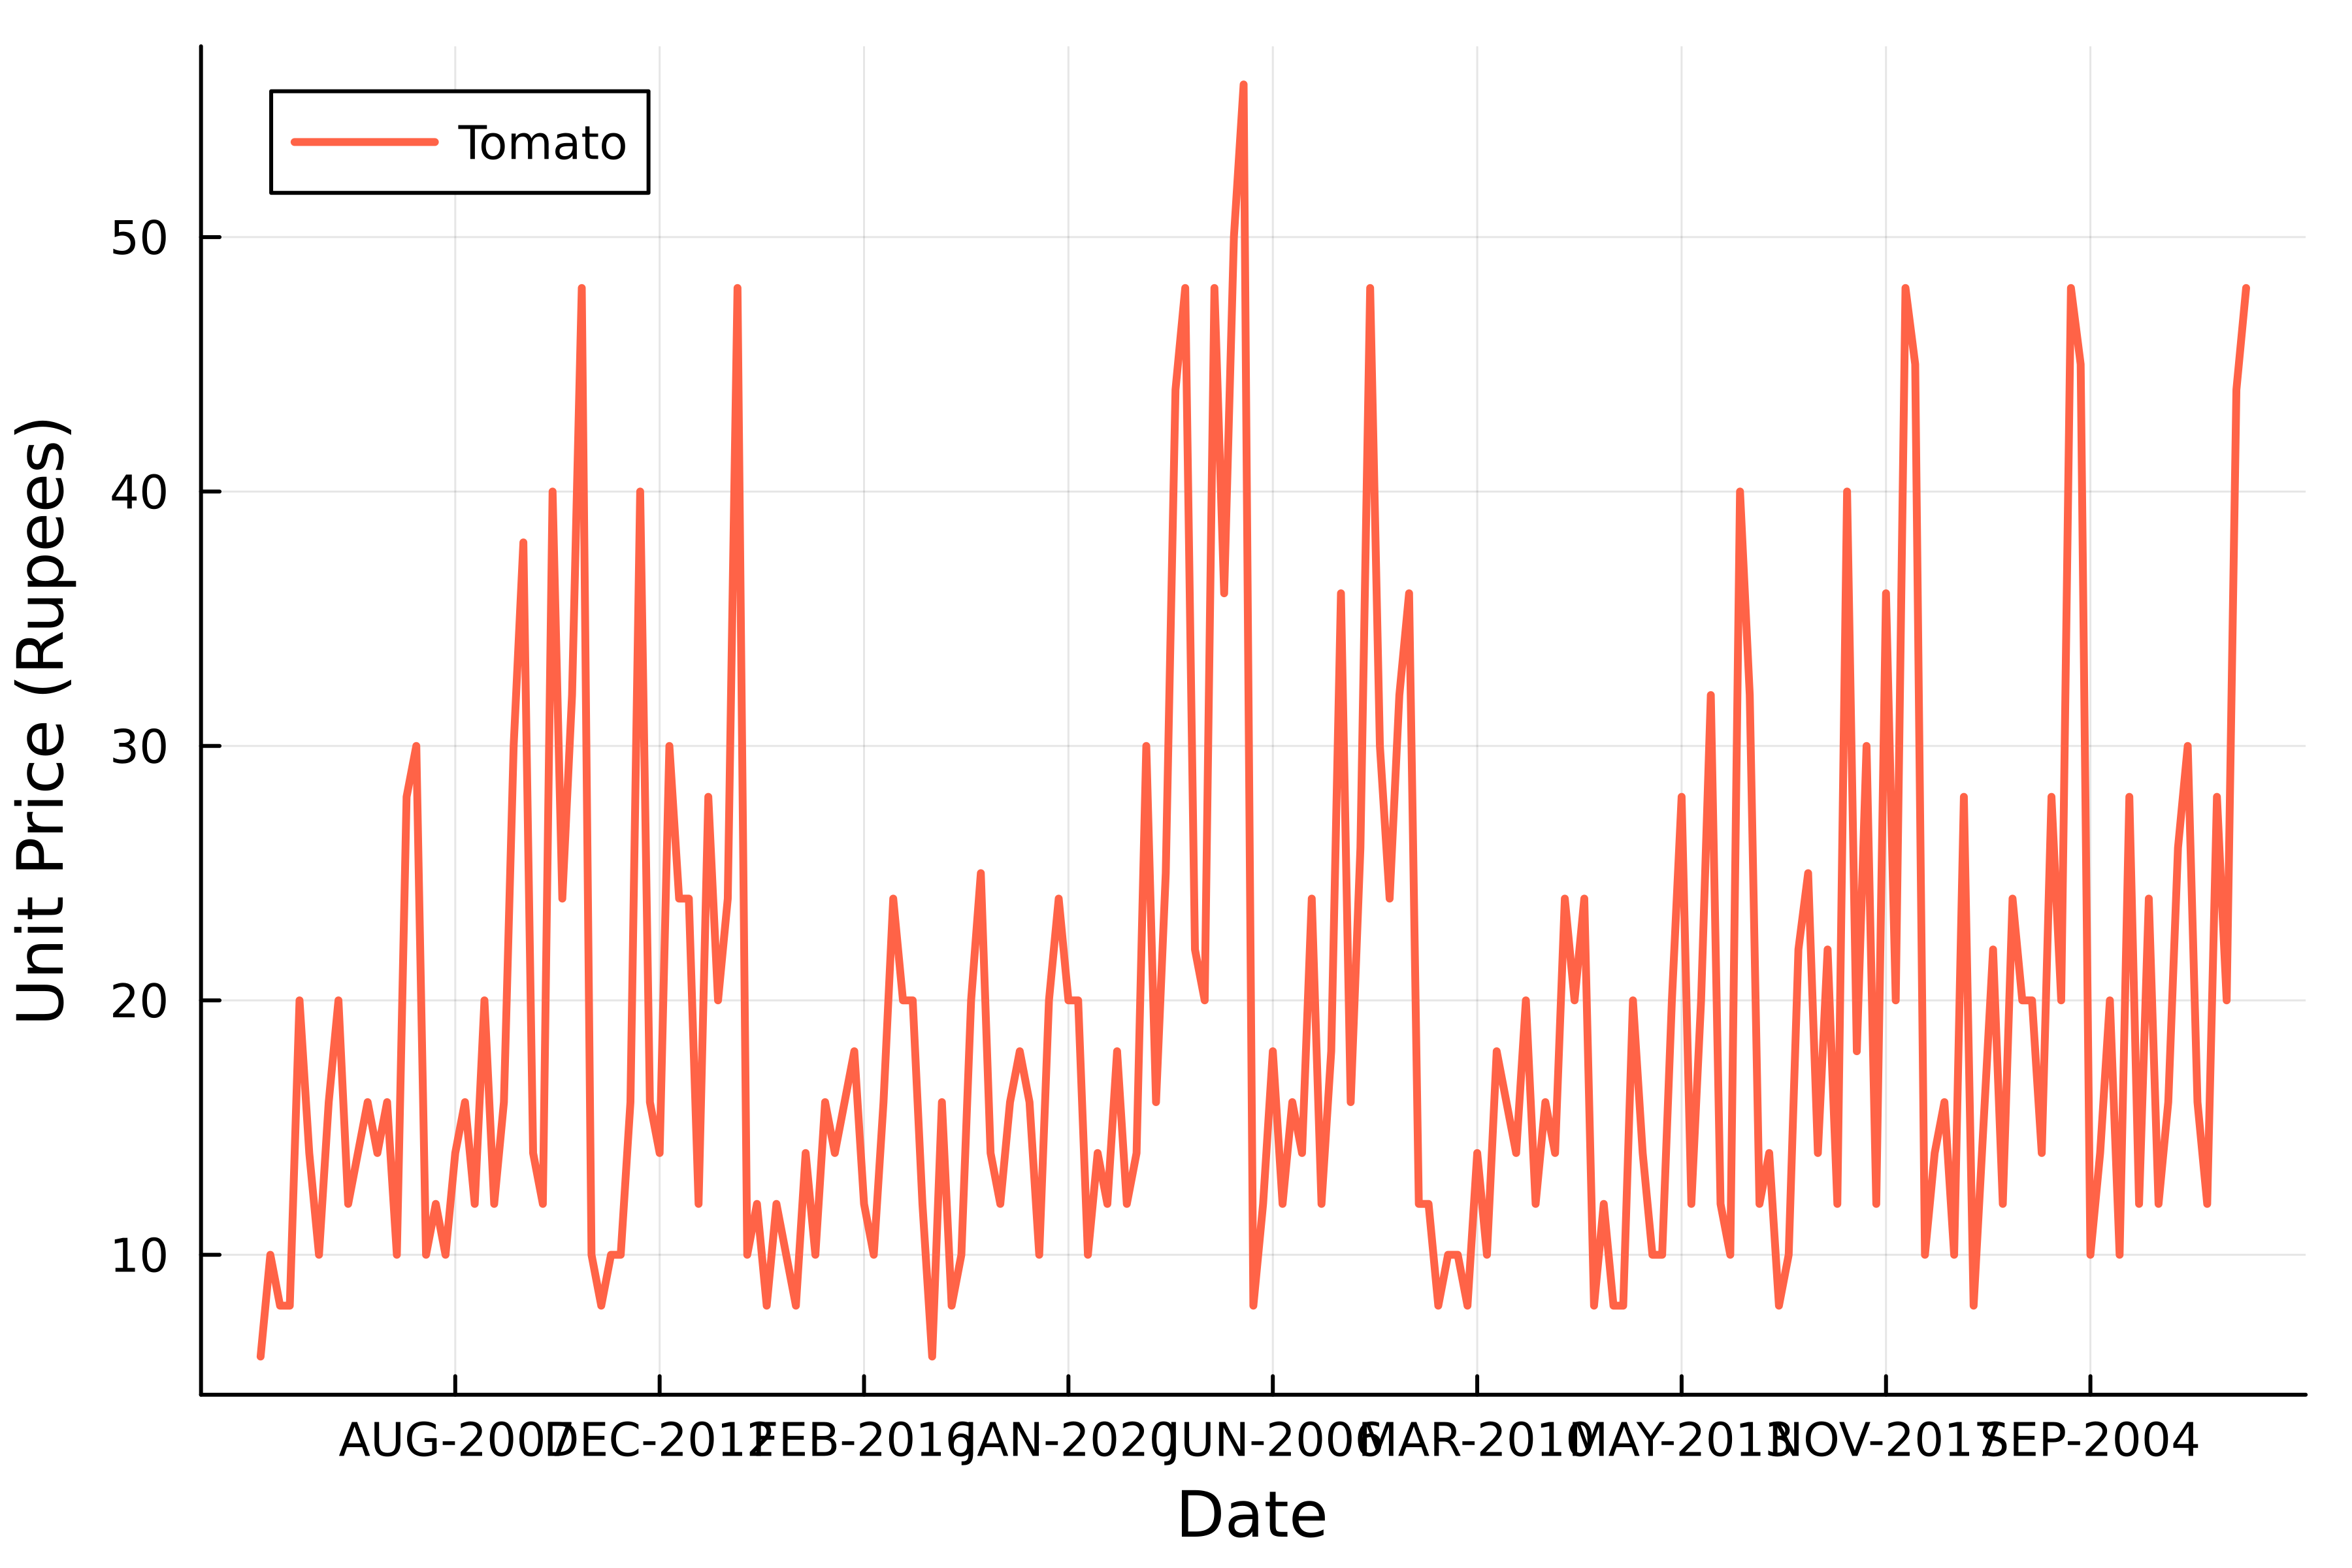
# Zaman serisini çiz plot( tomato.Date, tomato.Price,# Grafiği özelleştir linewidth=2, linecolor=:tomato, label="Tomato" ) xlabel!("Date") ylabel!("Birim Fiyat (Rupi)")

tomato DataFrame'i| Date | Fiyat (Rupi) |
|---|---|
| APR-2004 | 6.0 |
| APR-2005 | 10.0 |
| APR-2006 | 8.0 |
| APR-2007 | 8.0 |
| ... | ... |
using Dates
birthday = Date("1989-12-04")
birthday = Date(
"1989/DEC/04", dateformat"y/u/d"
)
birthday = Date(
"Dec 4, 1989", dateformat"u d, y"
)
| Kod | Eşleşme | Örnekler |
|---|---|---|
| Y/y | Yıl (YYYY) | 1989, 2023 |
| m | Ay (MM) | 1, 10 |
| u | Kısaltılmış Ay | Jan, DEC |
| U | Ay Adı | January, DECEMBER |
| d | Gün (DD) | 4, 28 |
| H | Saat (HH) | 12, 22 |
| M | Dakika (MM) | 05, 25 |
| S | Saniye (SS) | 10, 59 |
tomato.Date = Date.(
tomato.Date, dateformat"u-y"
)
tomato.Date = sort(
tomato.Date, :Date
)
| Date | Fiyat (Rupi) |
|---|---|
| 2004-02-01 | 10.0 |
| 2004-03-01 | 12.0 |
| 2004-04-01 | 6.0 |
| 2004-05-01 | 8.0 |
| ... | ... |
# Zaman serisini çiz
plot(
tomato.Date,
tomato.Price,
# Grafiği özelleştir
linewidth=2,
linecolor=:tomato,
label="Tomato"
)
xlabel!("Date")
ylabel!("Birim Fiyat (Rupi)")

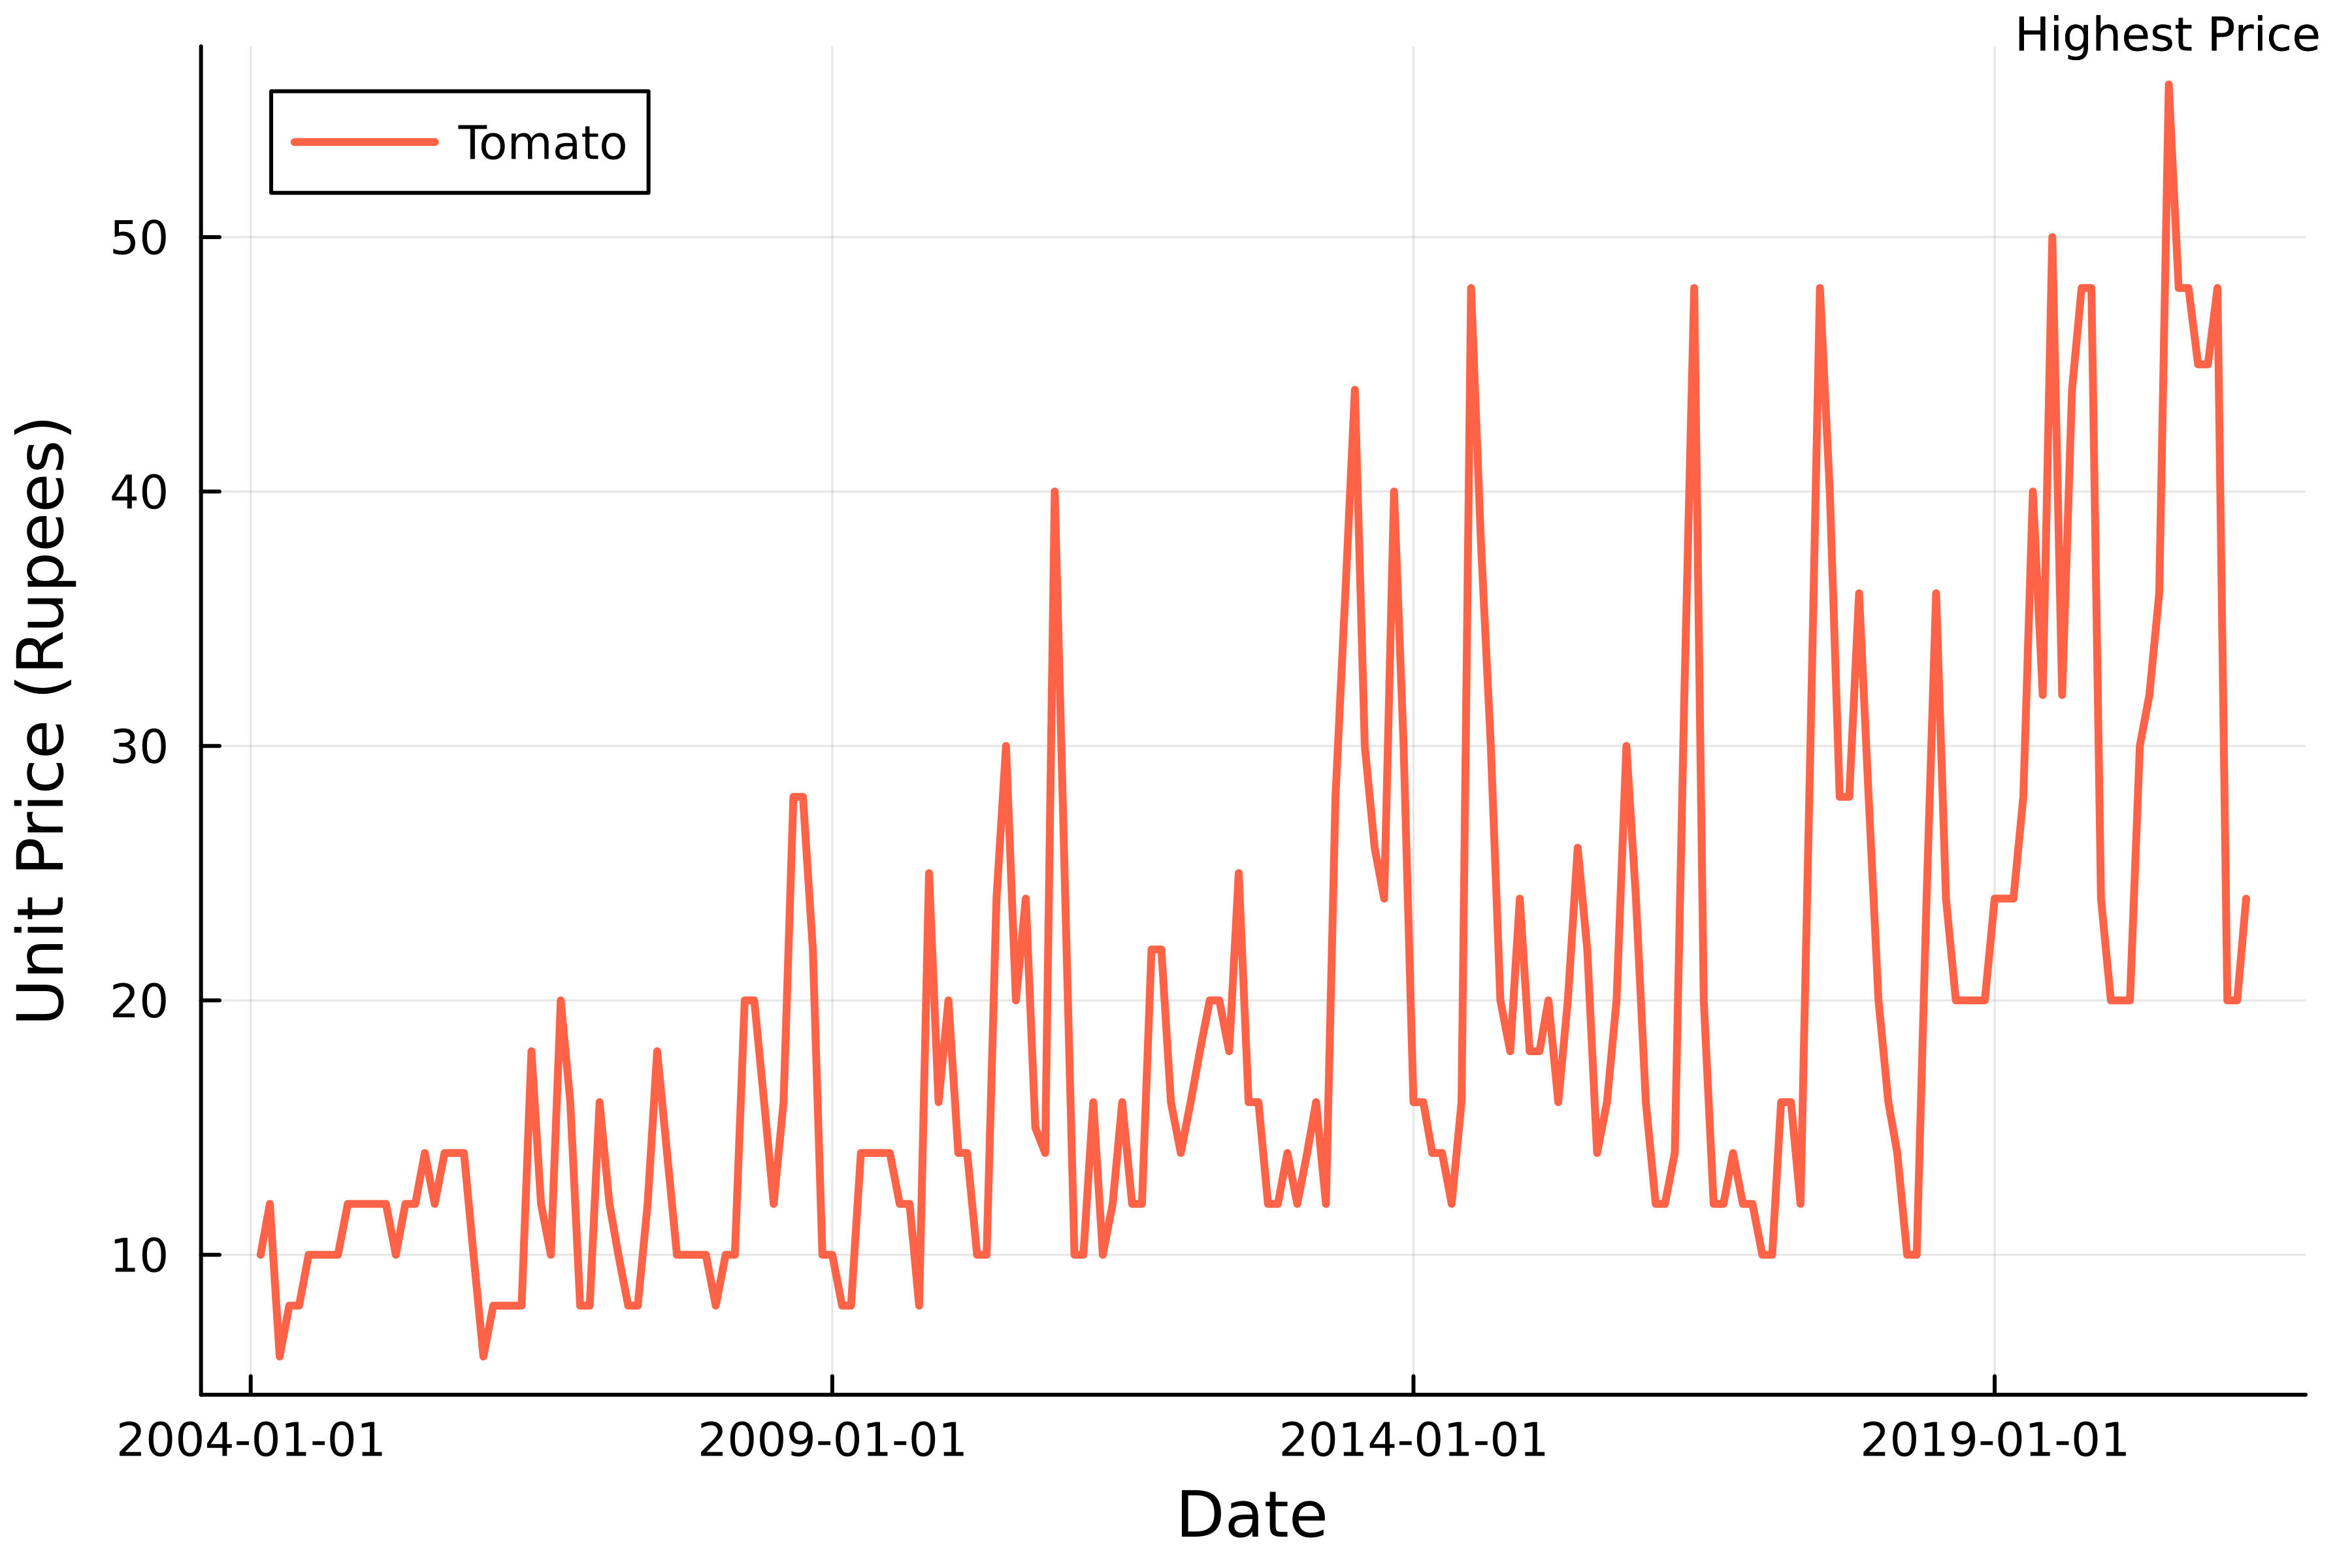
# En yüksek fiyatlı satır maximum_price = tomato[ argmax(tomato.Price), :]# Grafiğe açıklama ekle annotate!( # Koordinatlar maximum_price.Date, maximum_price.Price + 2,# Açıklama metni "Highest Price", annotationfontsize=8 )

Julia ile Veri Görselleştirmeye Giriş