Julia ile Veri Görselleştirmeye Giriş
Gustavo Vieira Suñe
Data Analyst

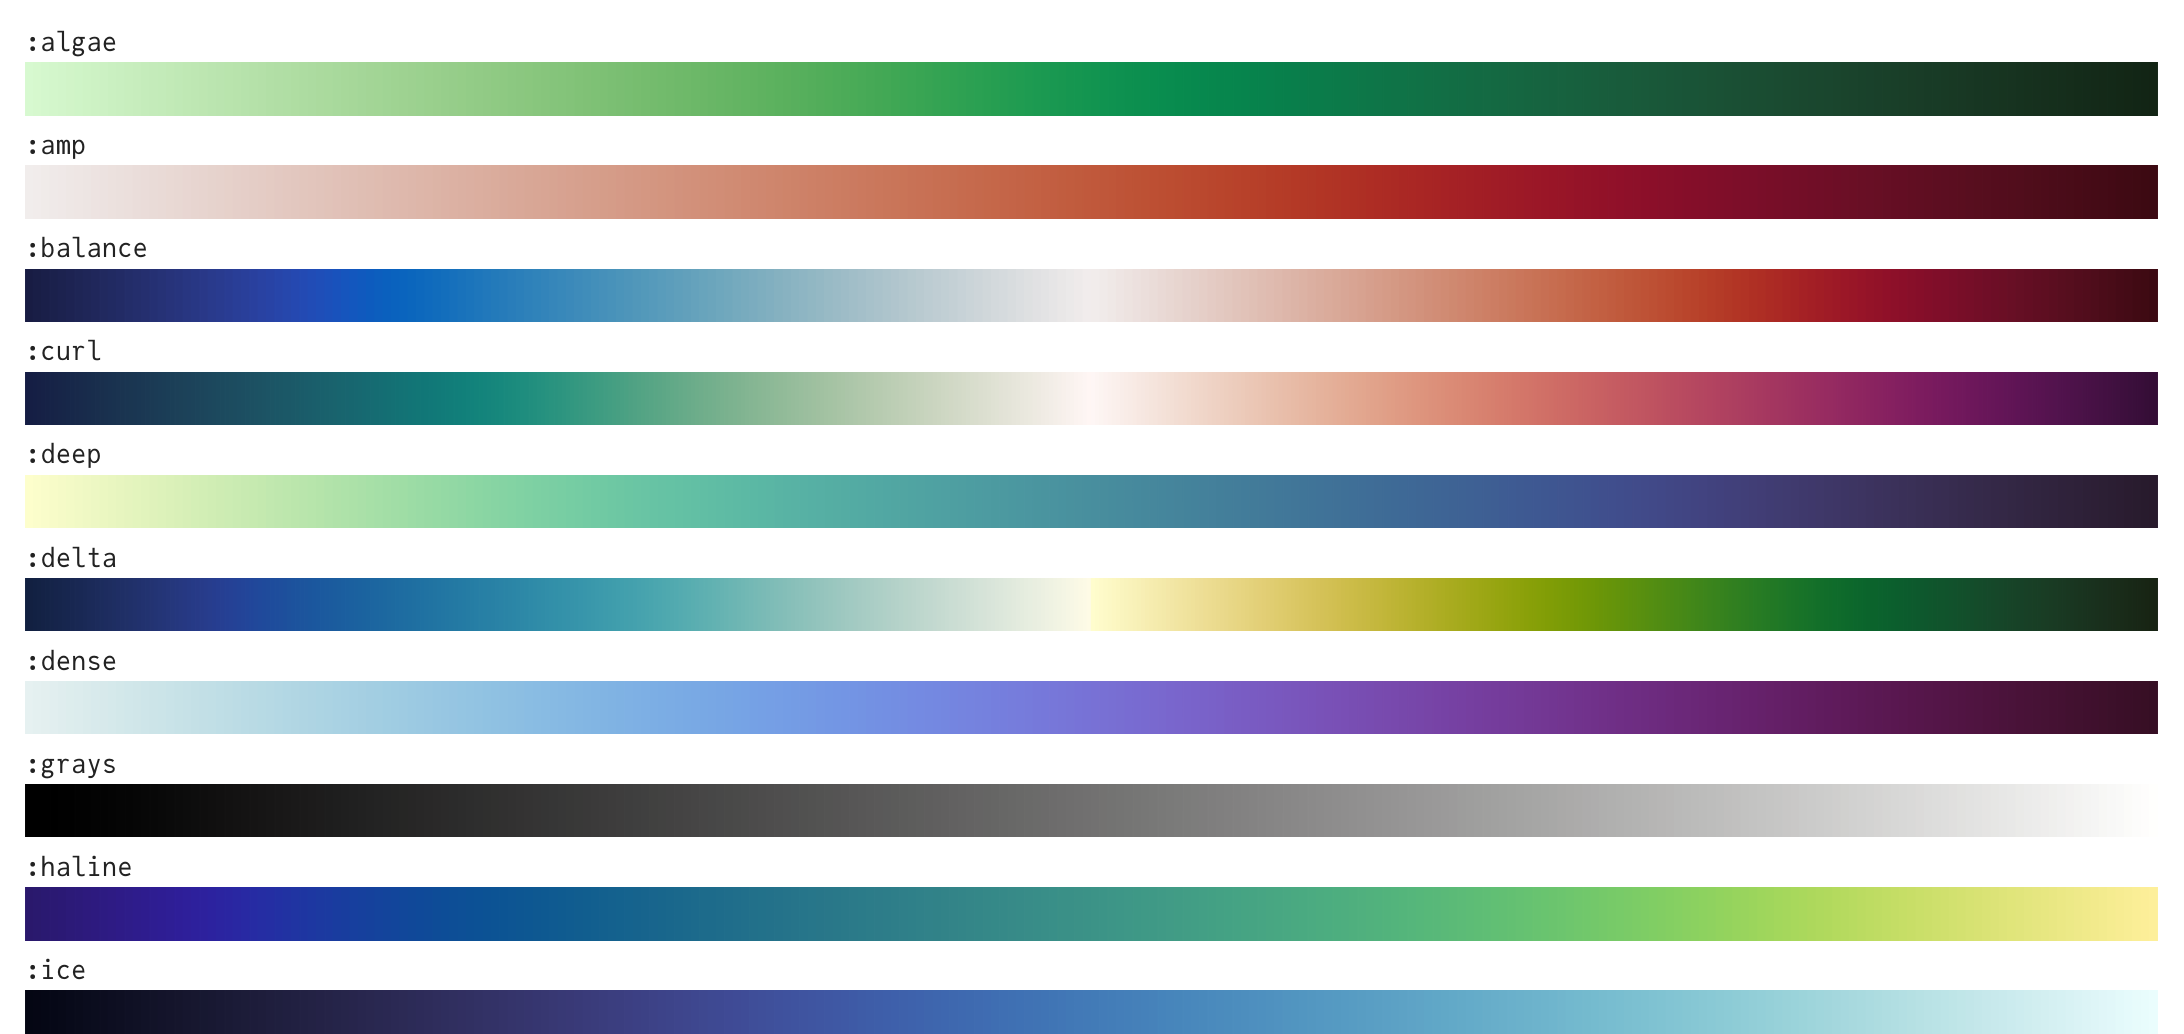
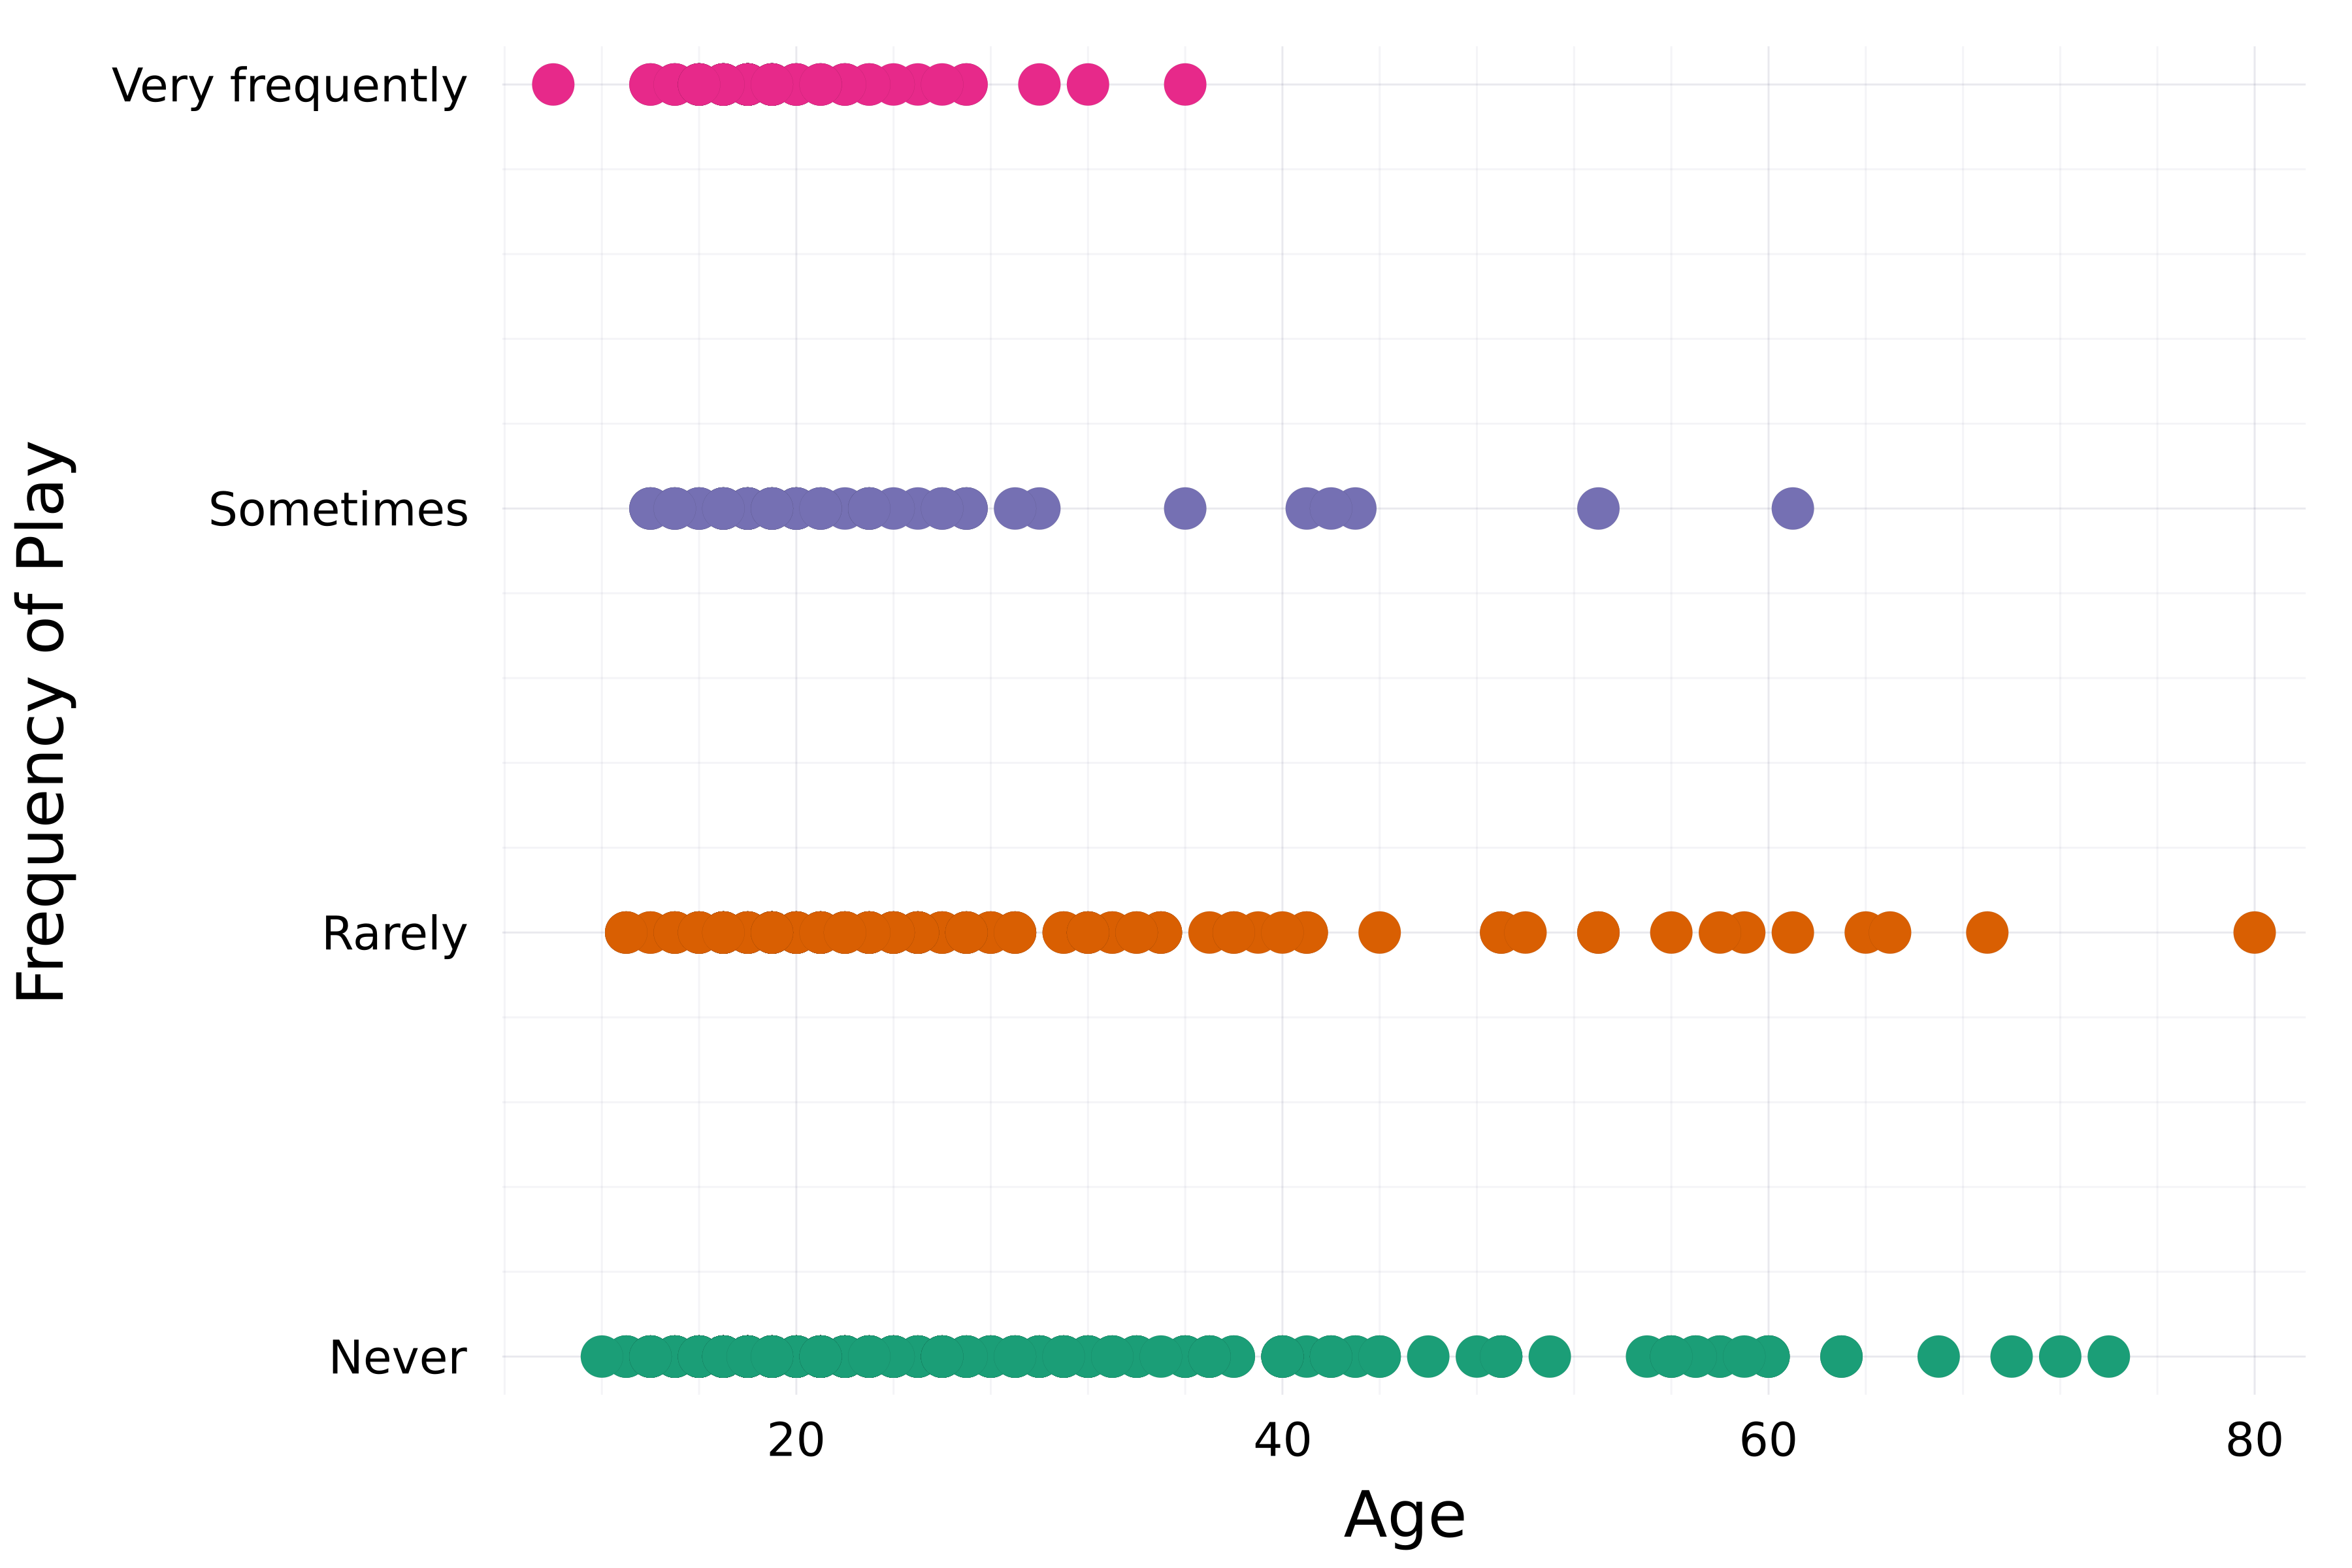
# Temayı ayarla theme(:bright)# Saçılım grafiği oluştur scatter( streaming.Age, streaming."Frequency [K pop]", group=streaming."Frequency [K pop]", label=false,# Renk paletini ayarla palette=:Dark2_5 )xlabel!("Age") ylabel!("Frequency of Play")

Daha önce gördük:
title, xlabel, ylabelxticks, ytickscolorlinecolor, linewidthmarkercolorframestyleDaha fazlası:
xlims, ylimsalphalinestylelegend_title, legend_positionmarkersize, markershape...
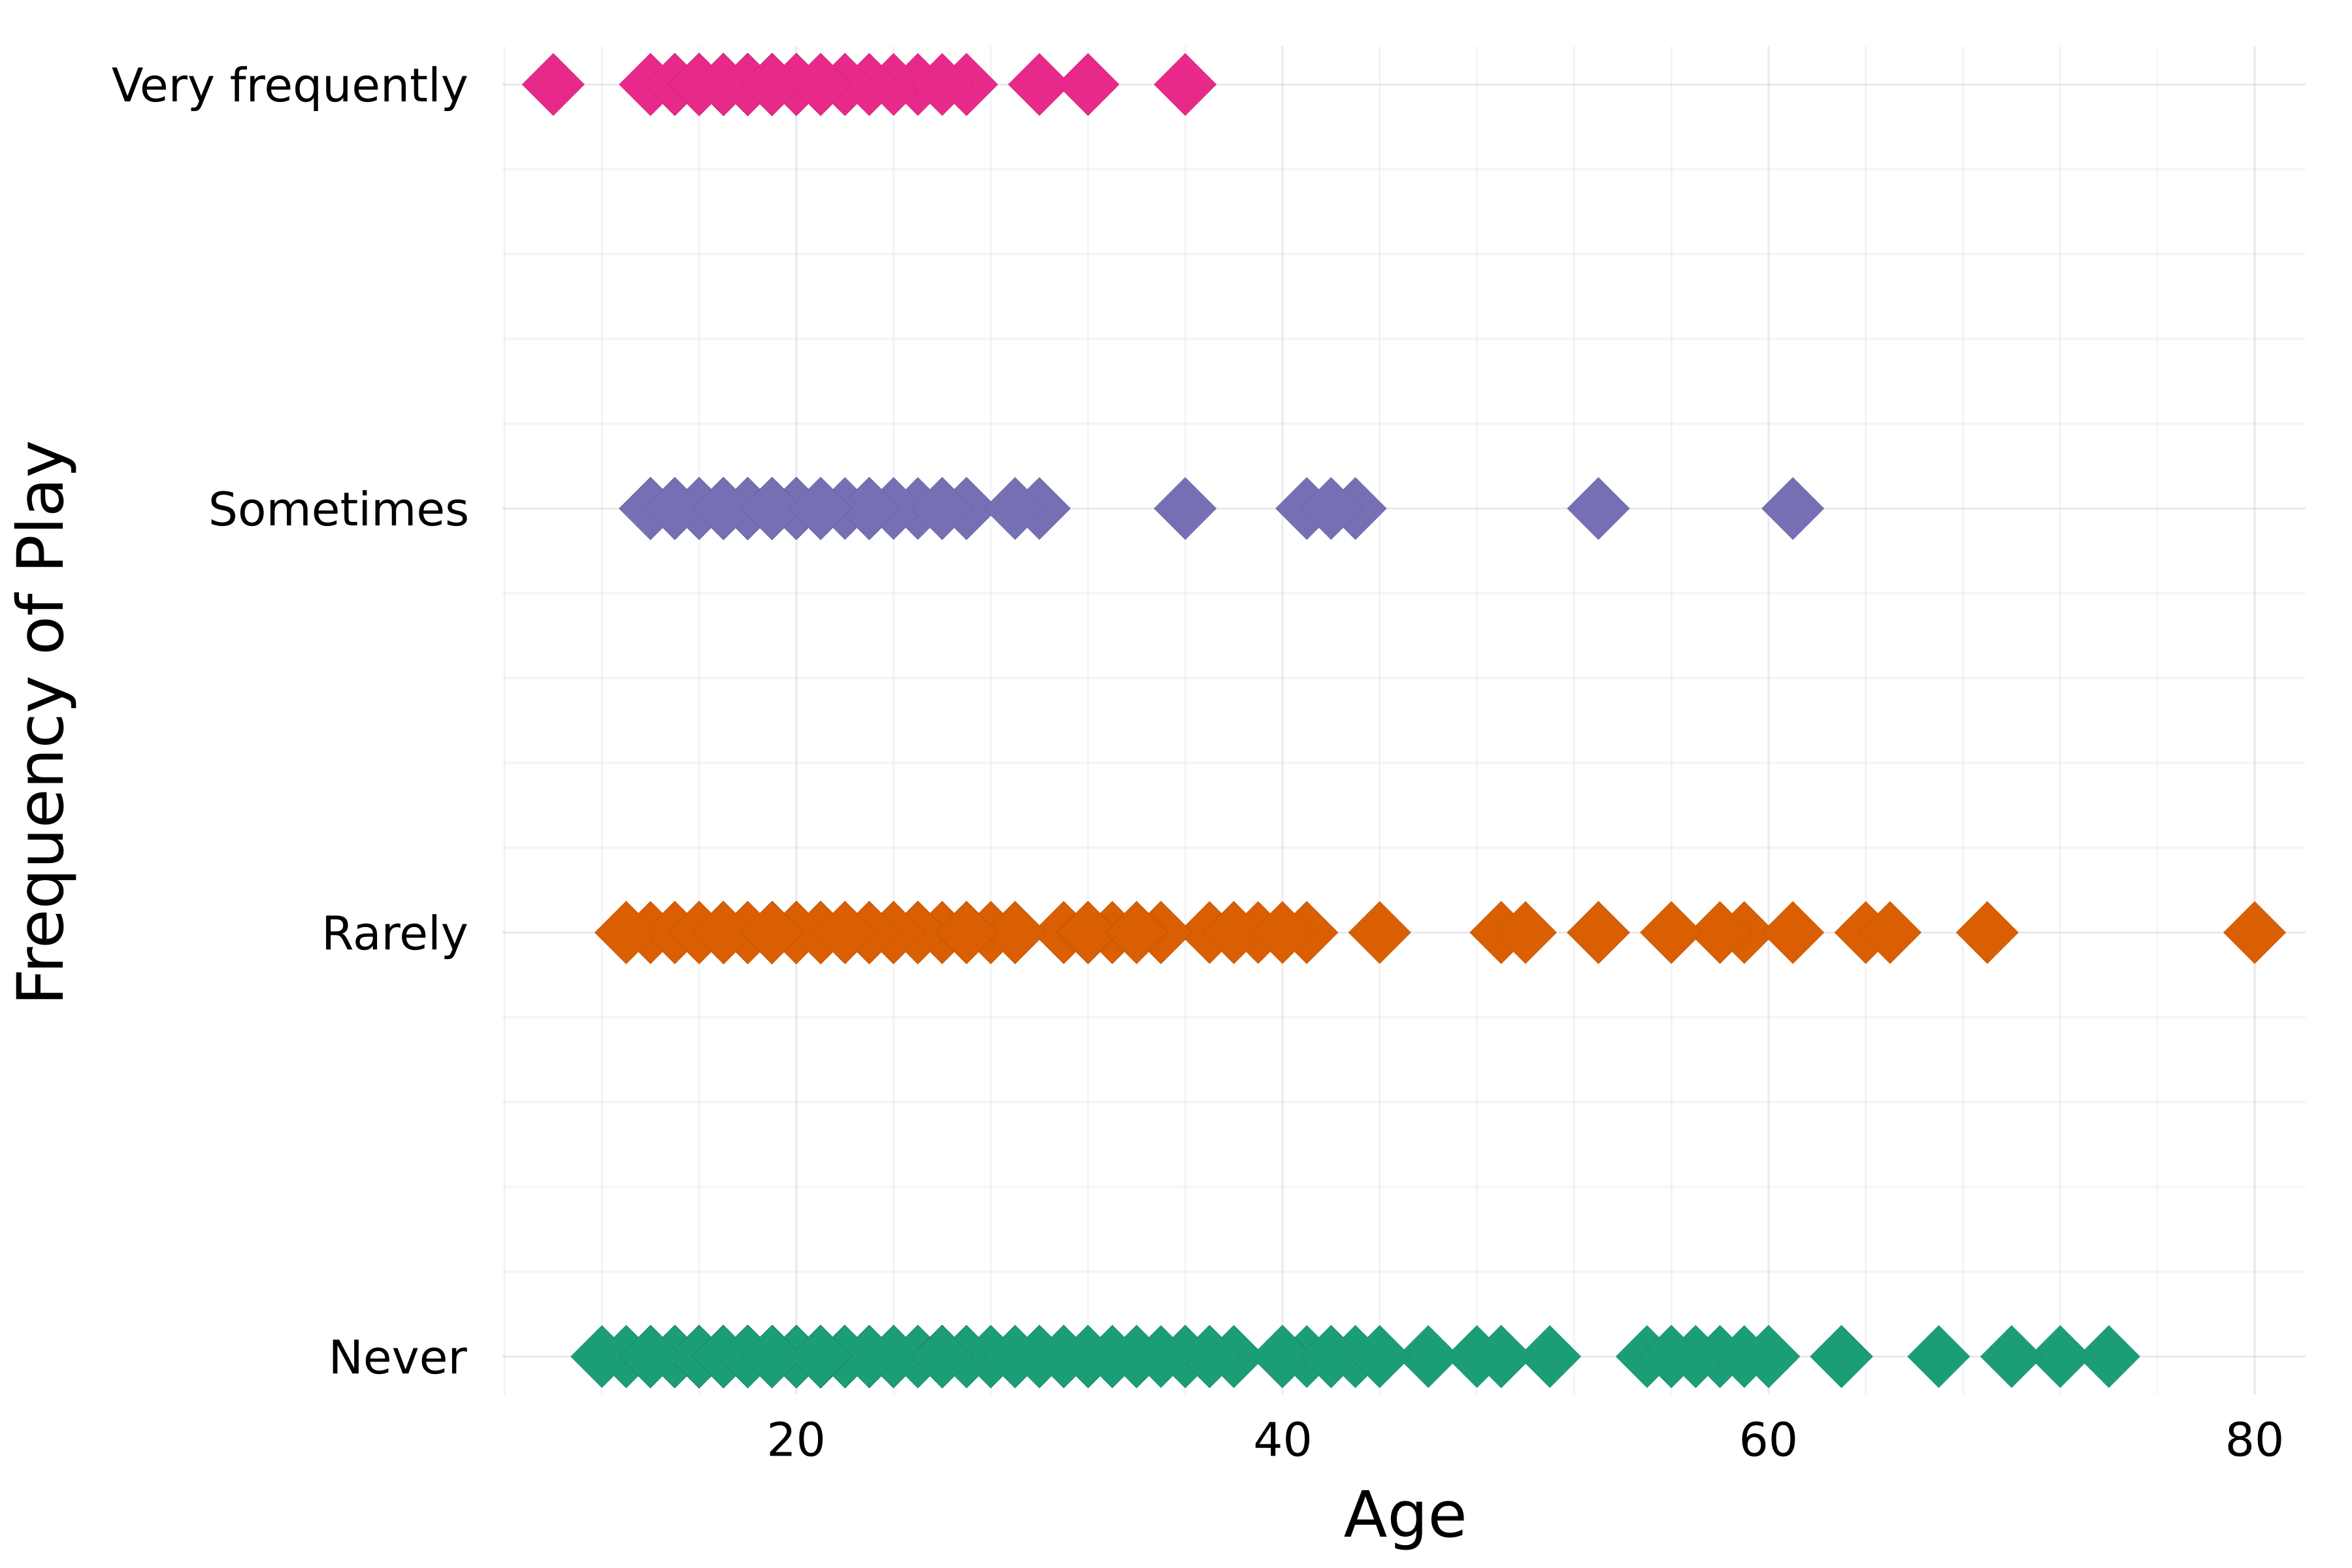
theme(:bright) scatter( streaming.Age, streaming."Frequency [K pop]", group=streaming."Frequency [K pop]", label=false, palette=:Dark2_5# Marker attributes markershape=:diamond, markersize=8, )xlabel!("Age") ylabel!("Frequency of Play")

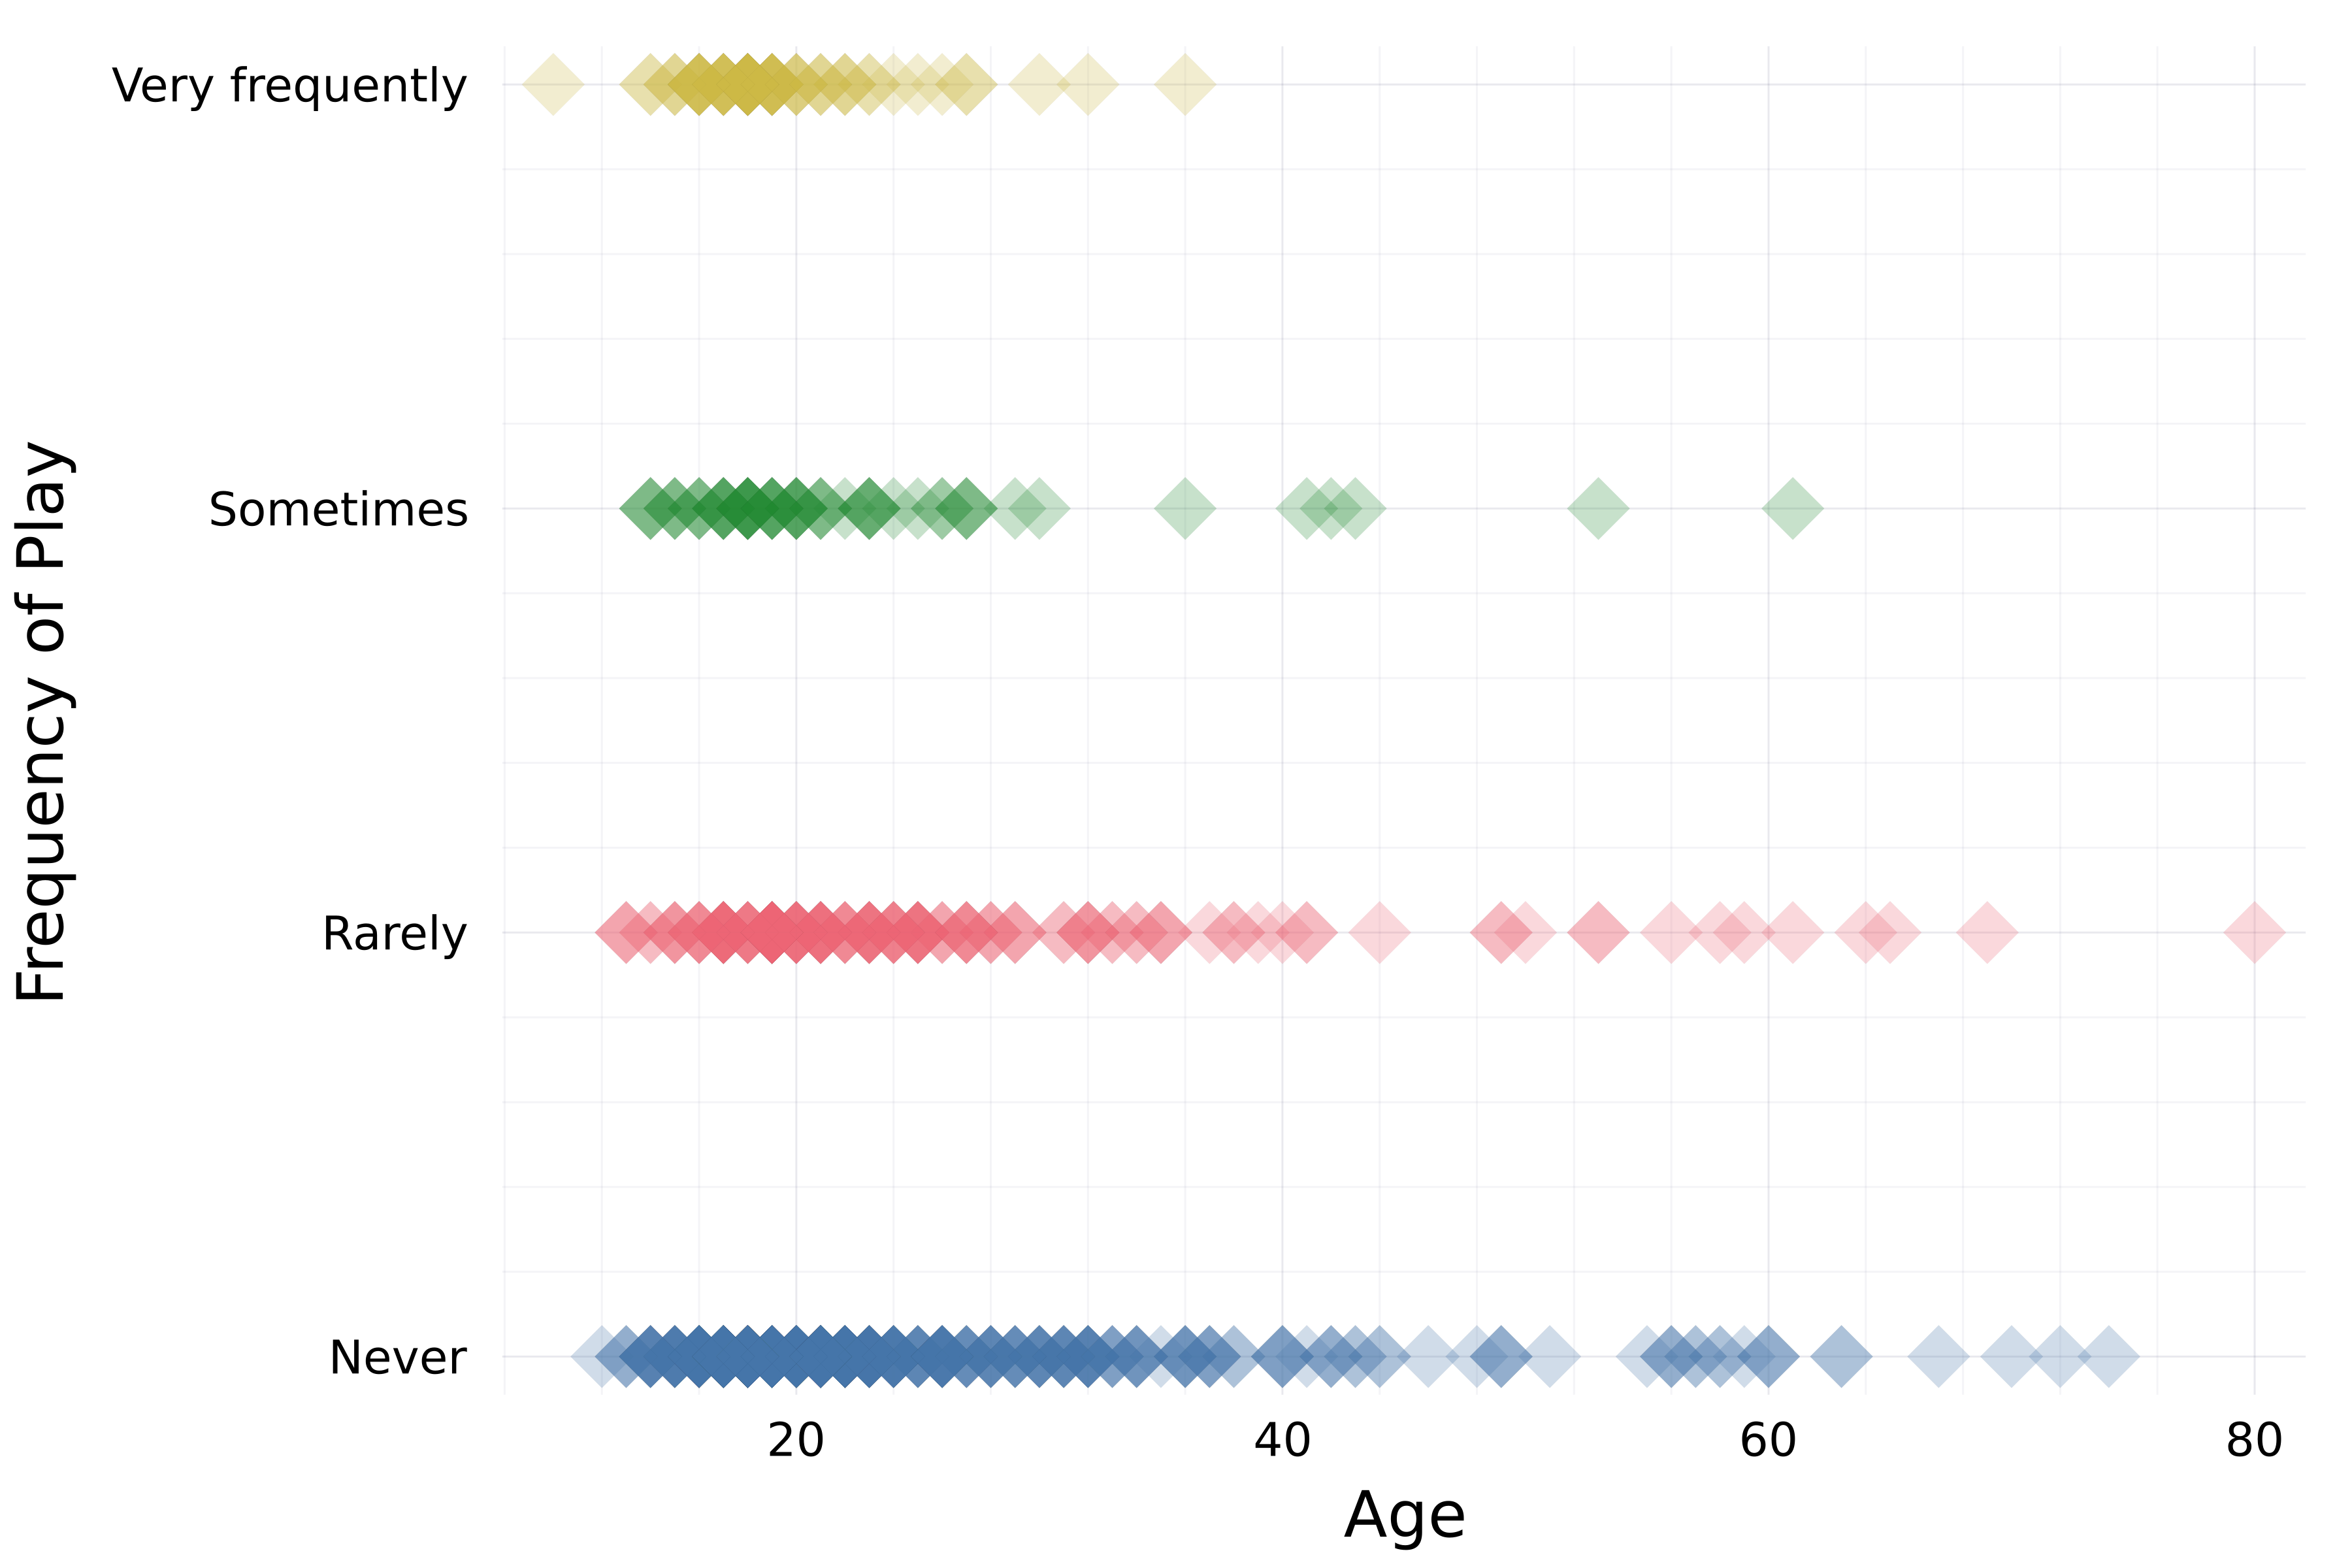
theme(:bright) scatter( streaming.Age, streaming."Frequency [K pop]", group=streaming."Frequency [K pop]", label=false, palette=:Dark2_5 markershape=:diamond, markersize=8,# Opacity alpha=0.25 )xlabel!("Age") ylabel!("Frequency of Play")

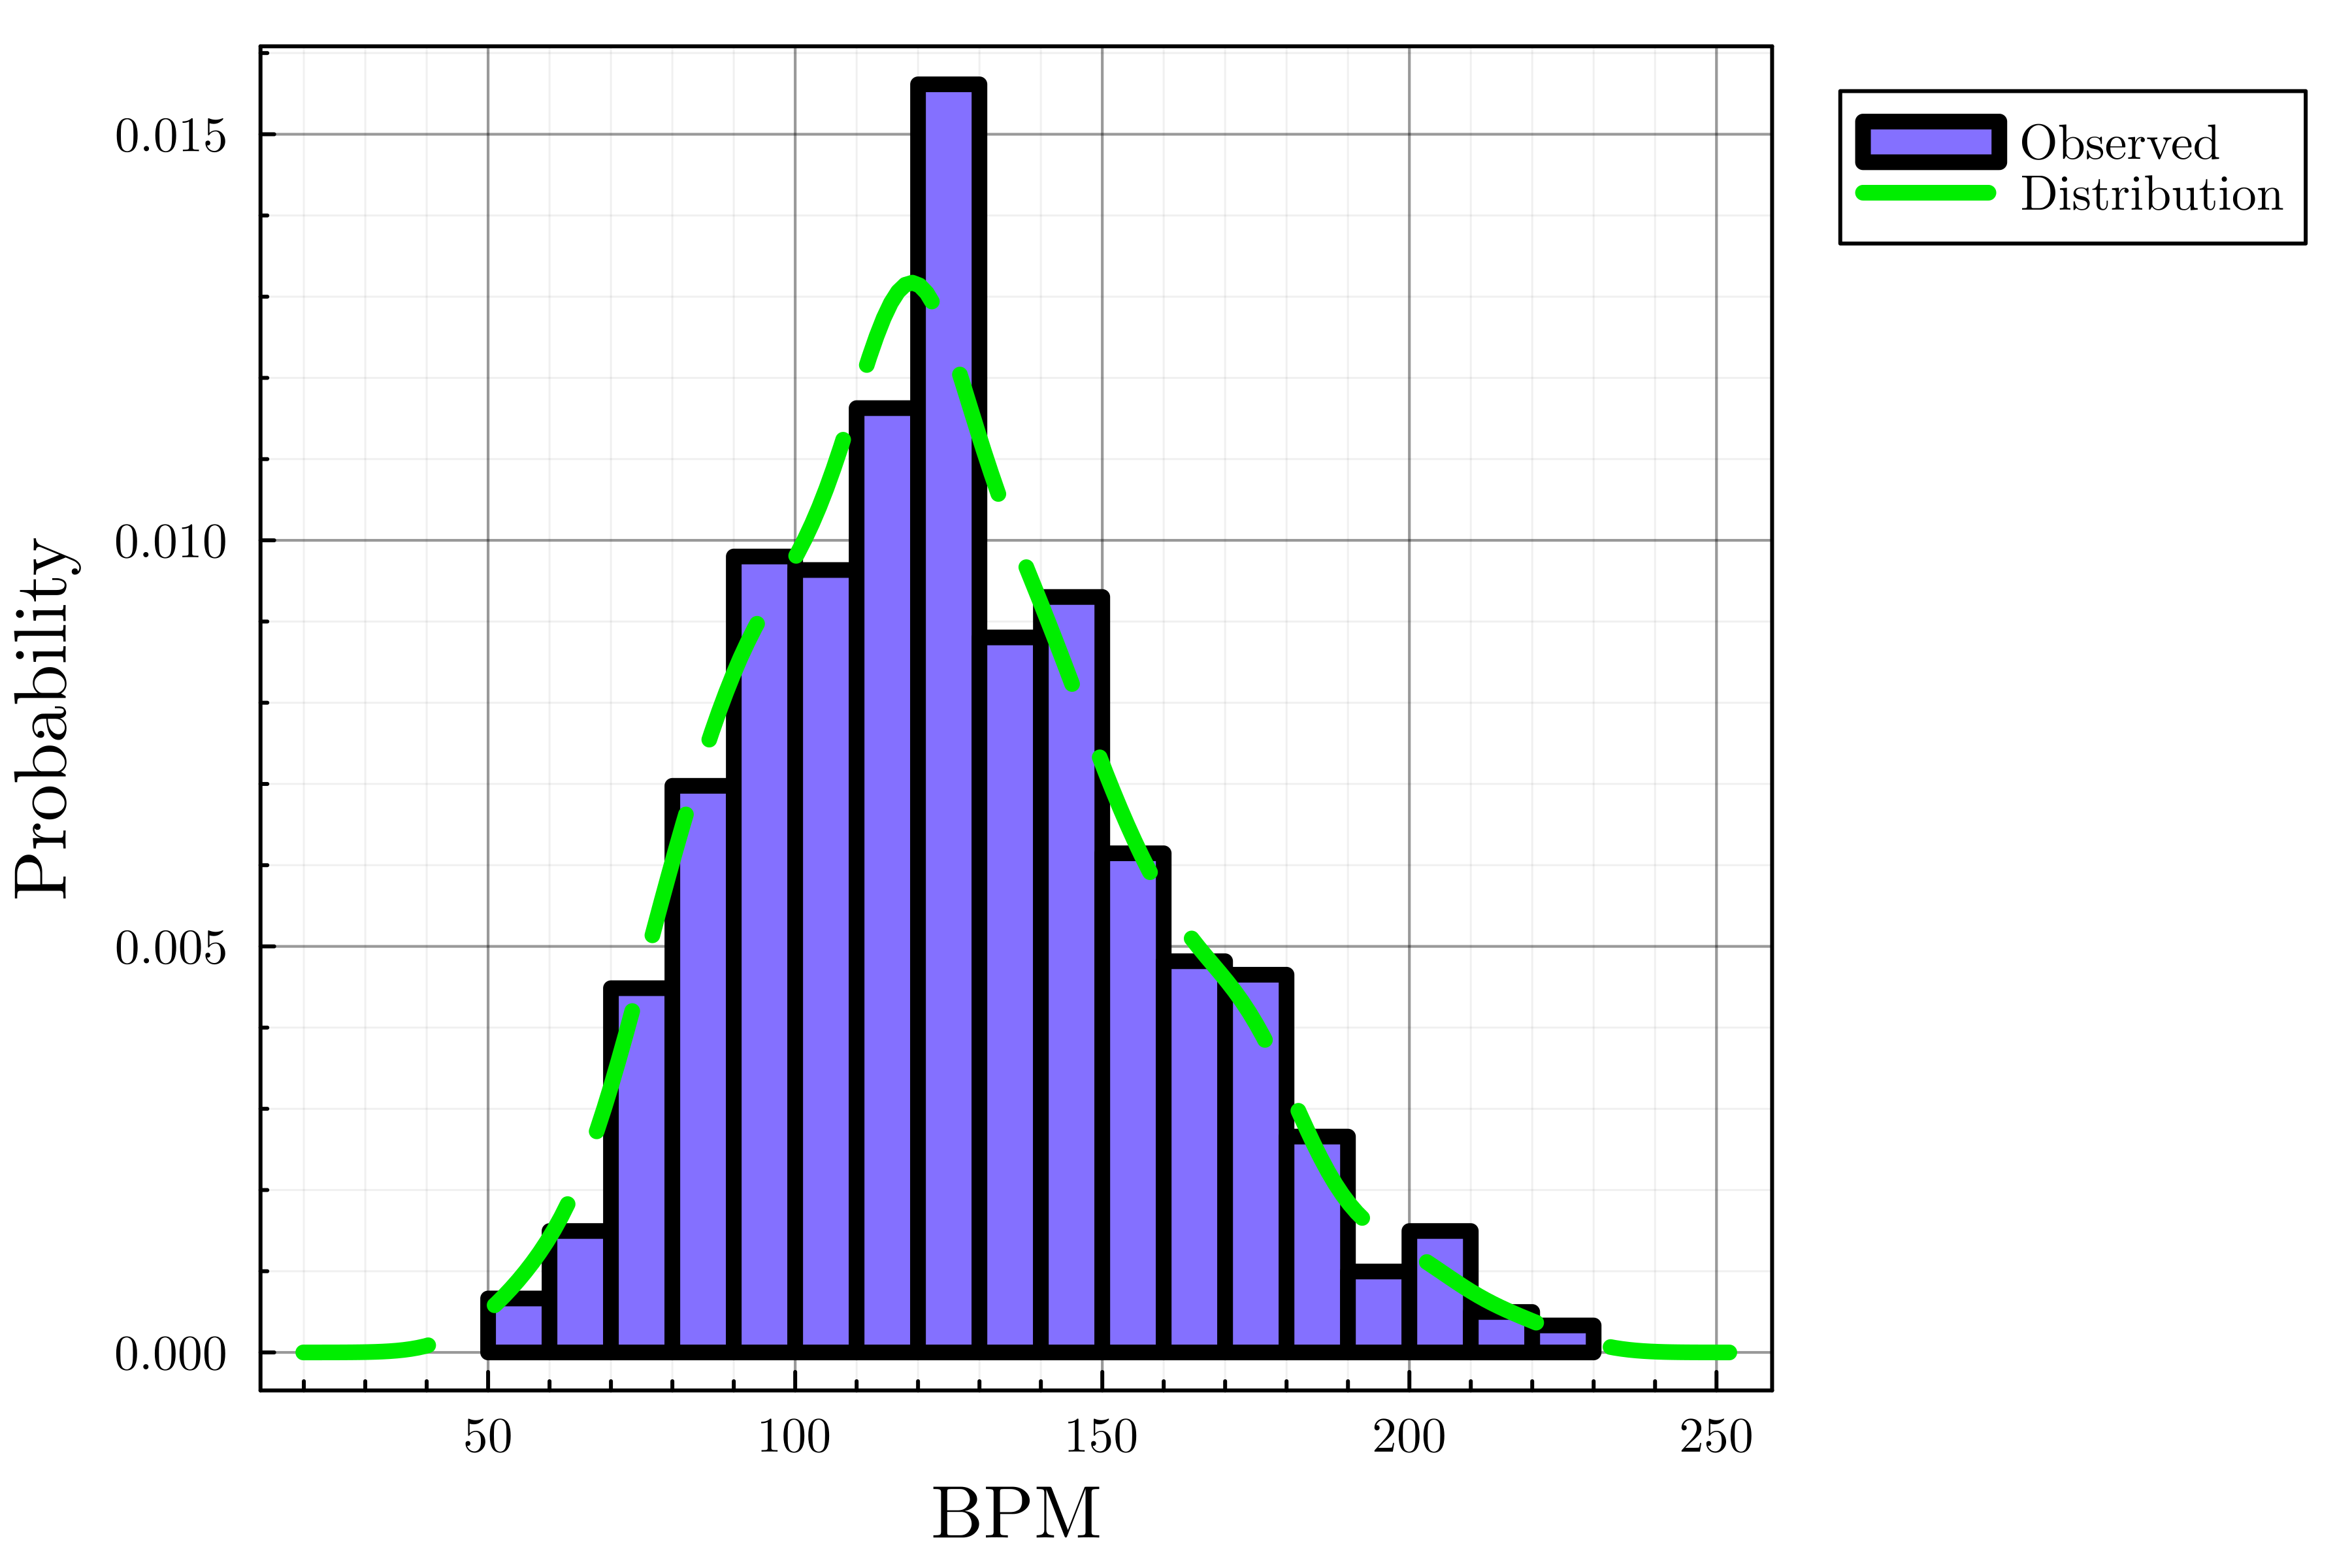
# Tema ve varsayılan çizgi kalınlığını ayarla theme(:dao, linewidth=4)# Histogram oluştur histogram(streaming.BPM, label="Observed", color=:lightslateblue, normalize=true)# Yoğunluk eğrisi ekle density!(streaming.BPM, label="Distribution", linecolor=:green2,# Çizgi stili linestyle=:dash)xlabel!("BPM") ylabel!("Probability")

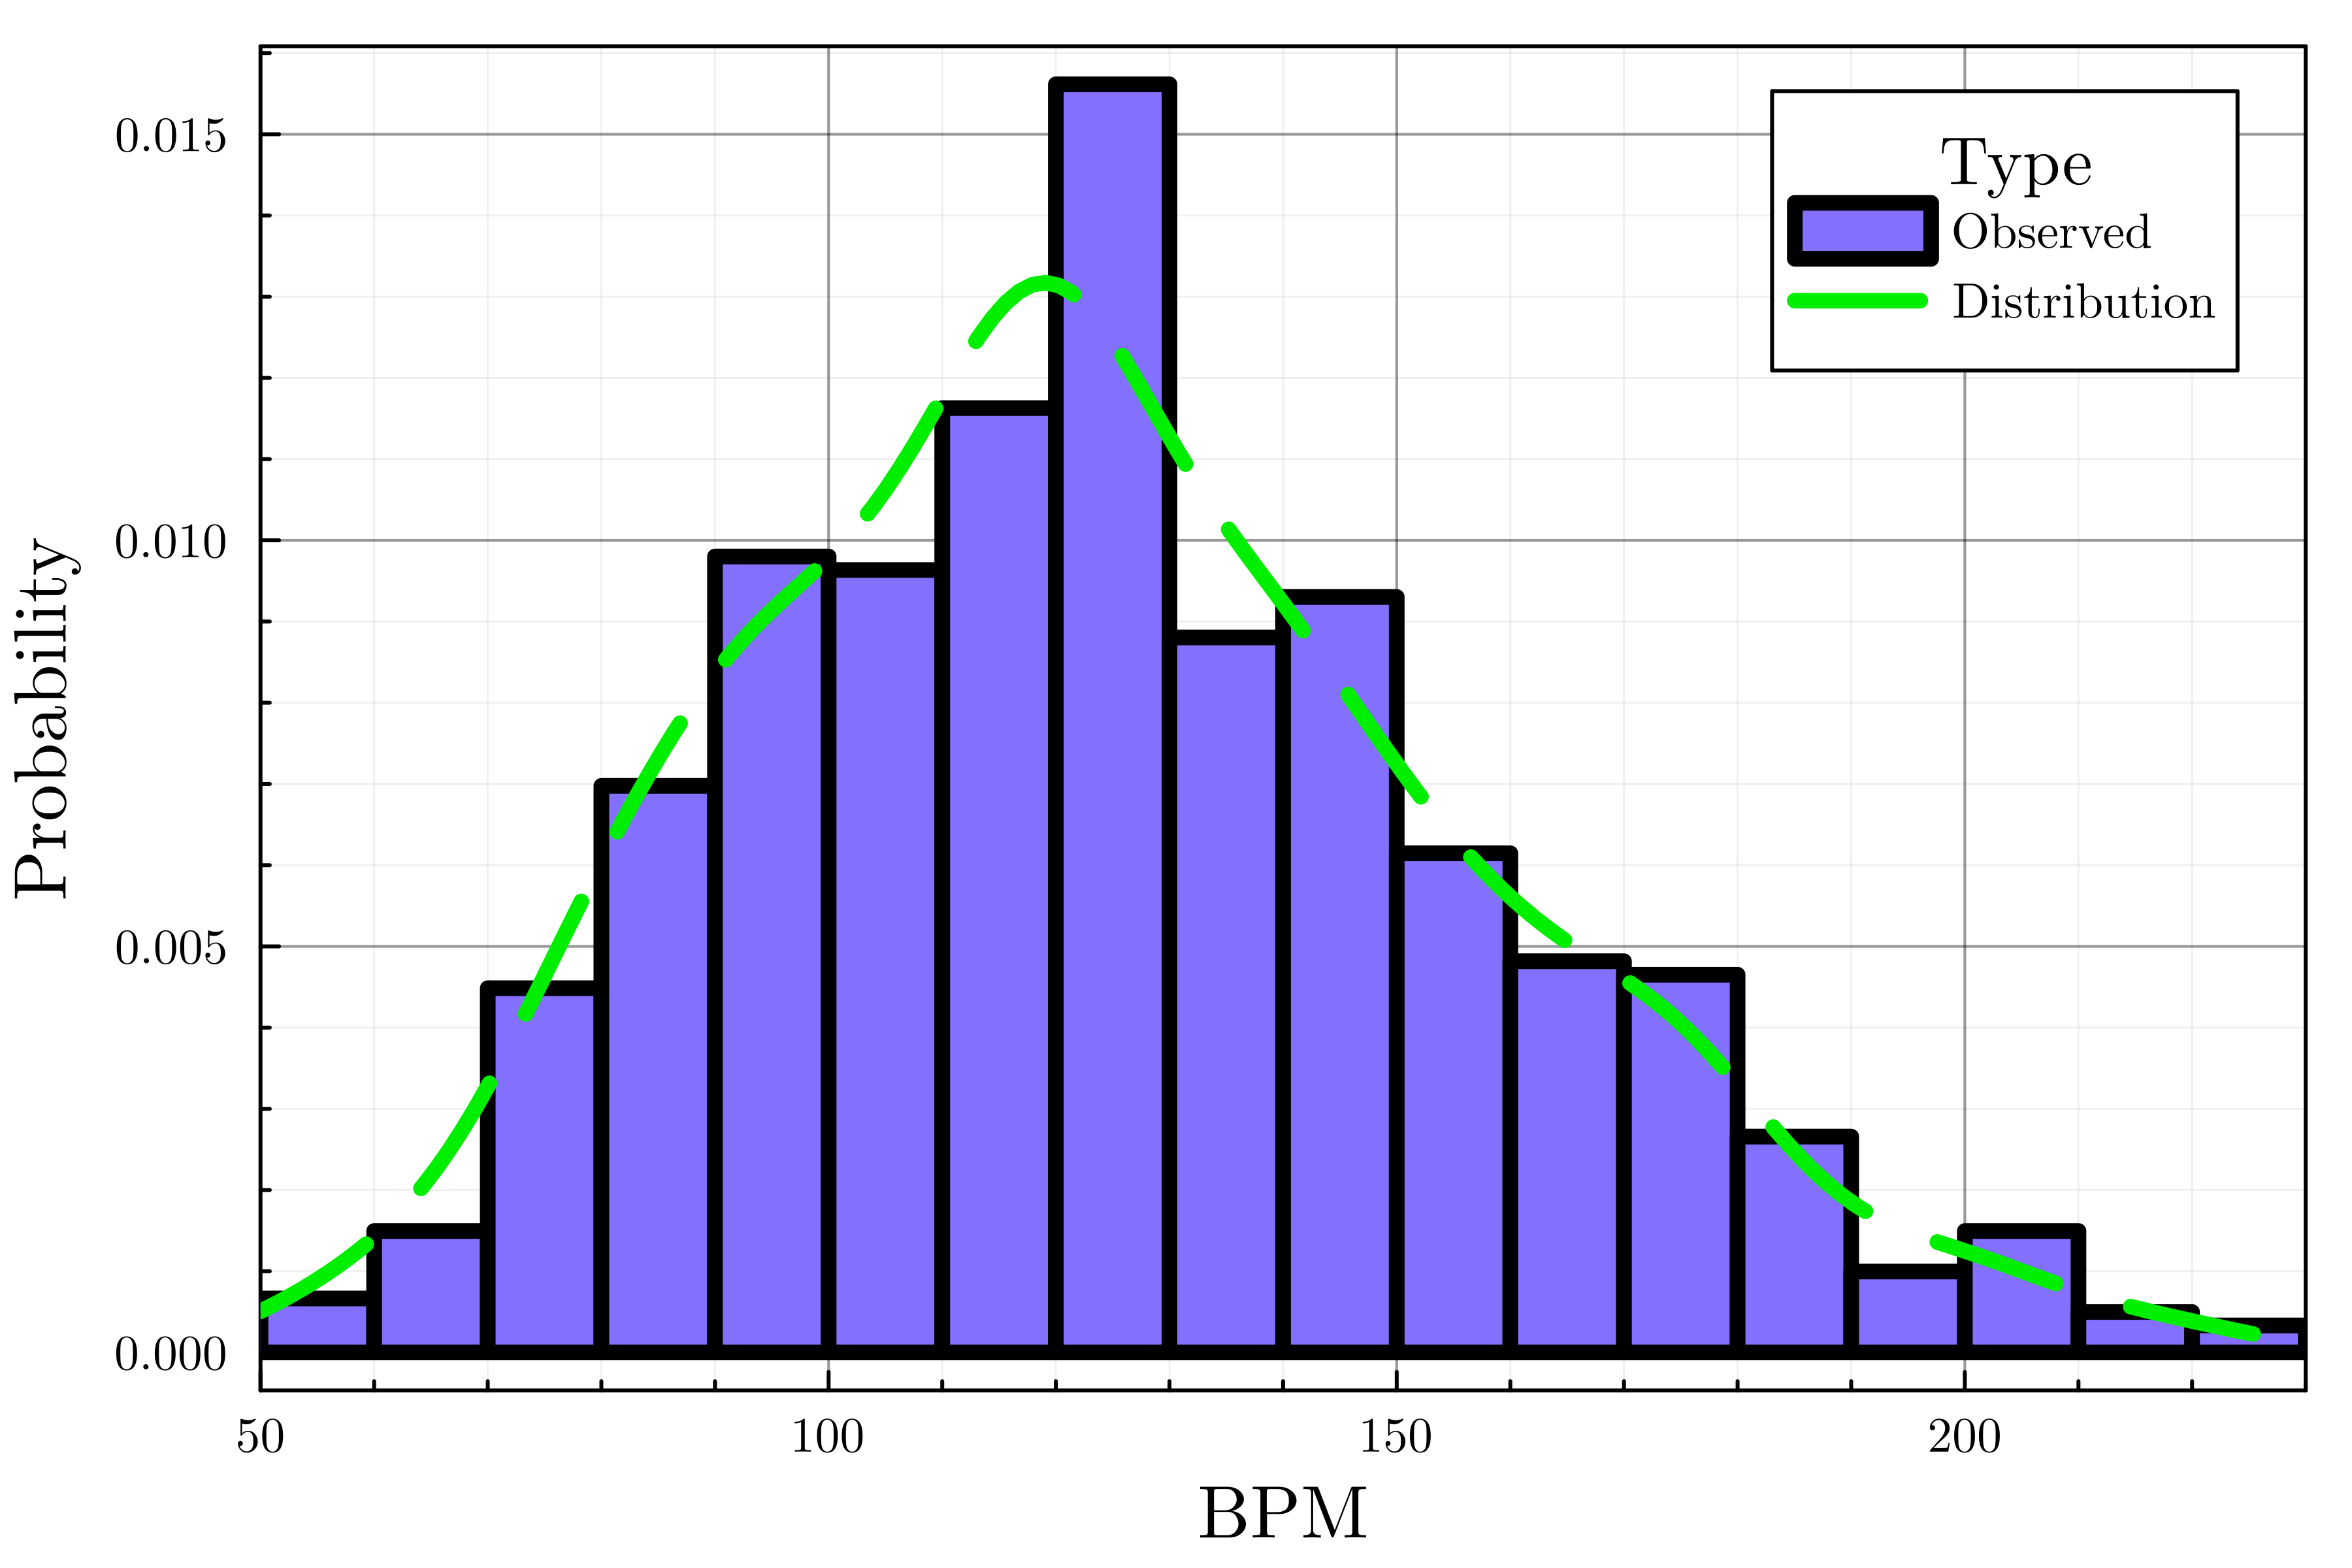
theme(:dao, linewidth=4) histogram(streaming.BPM, label="Observed", color=:lightslateblue, normalize=true) density!(streaming.BPM, label="Distribution", linecolor=:green2, linestyle=:dash# Göstergeyi özelleştir legend_title="Type", legend_position=:topright)# x ekseni sınırlarını ayarla xlims!(50, 230)xlabel!("BPM") ylabel!("Probability")

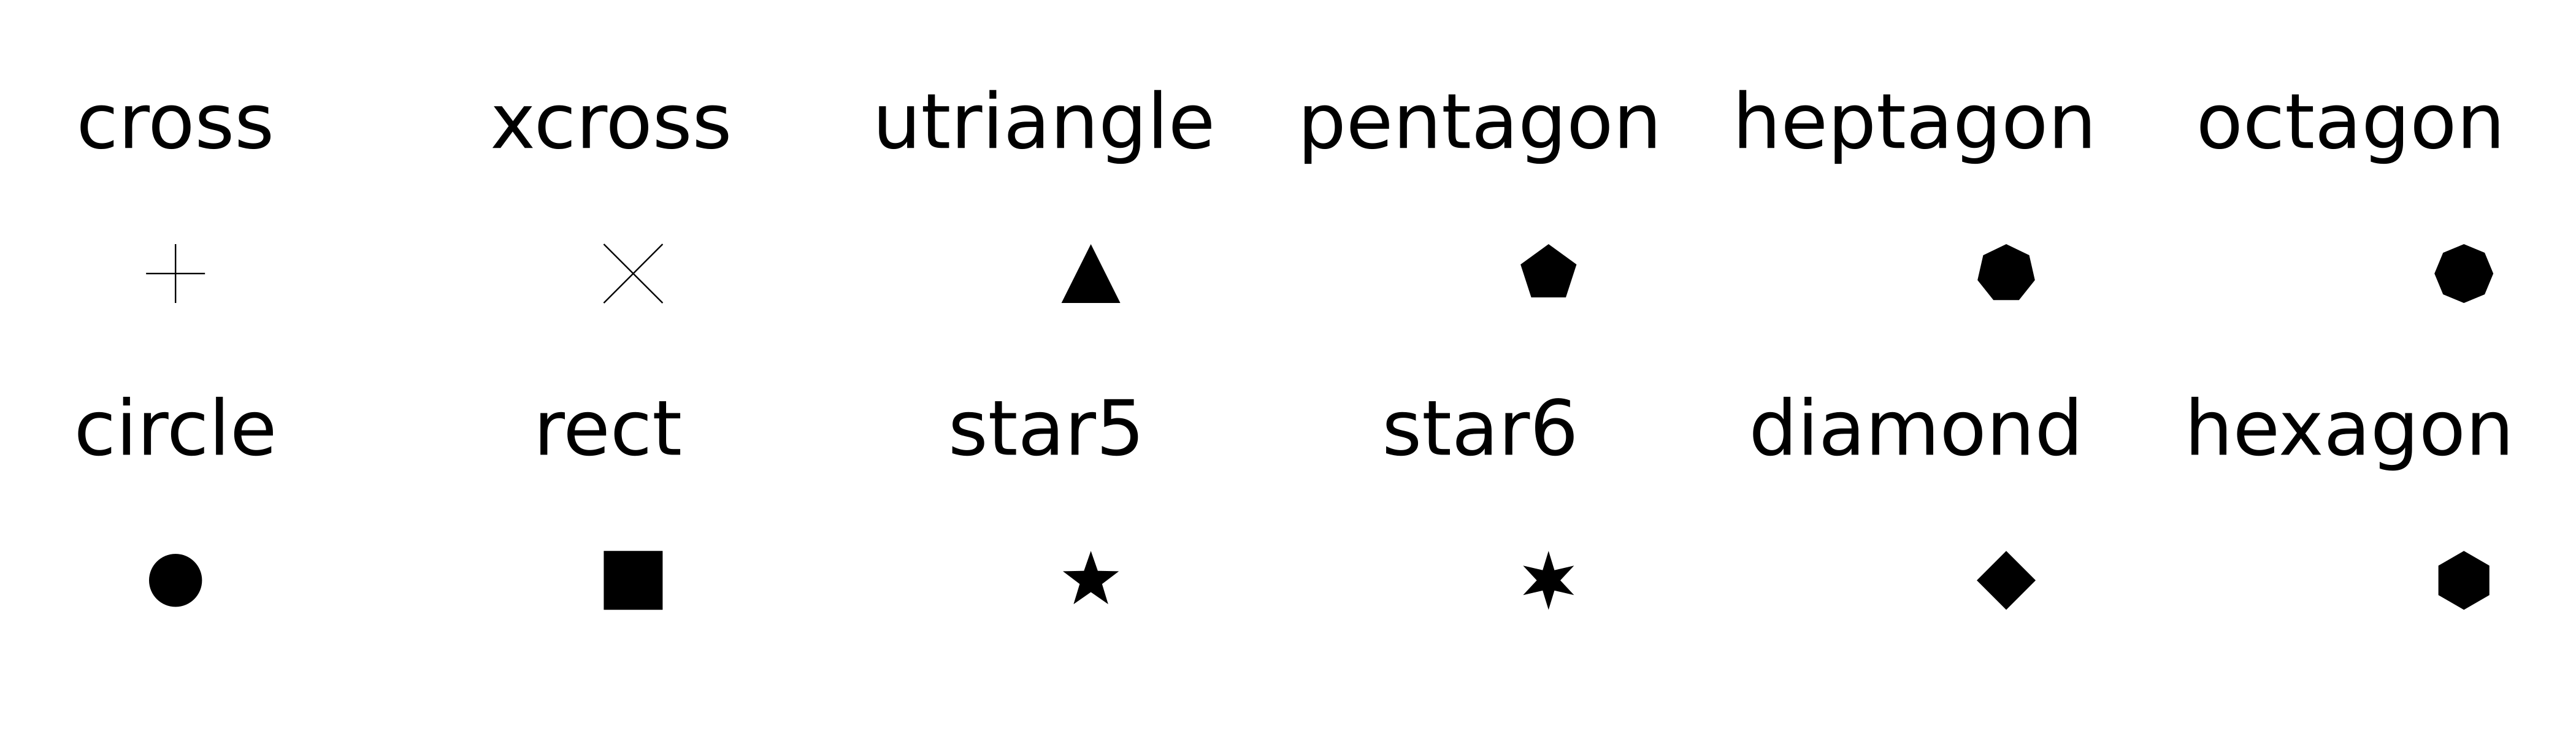
plot(..., palette=palette_symbol)markersizemarkershape
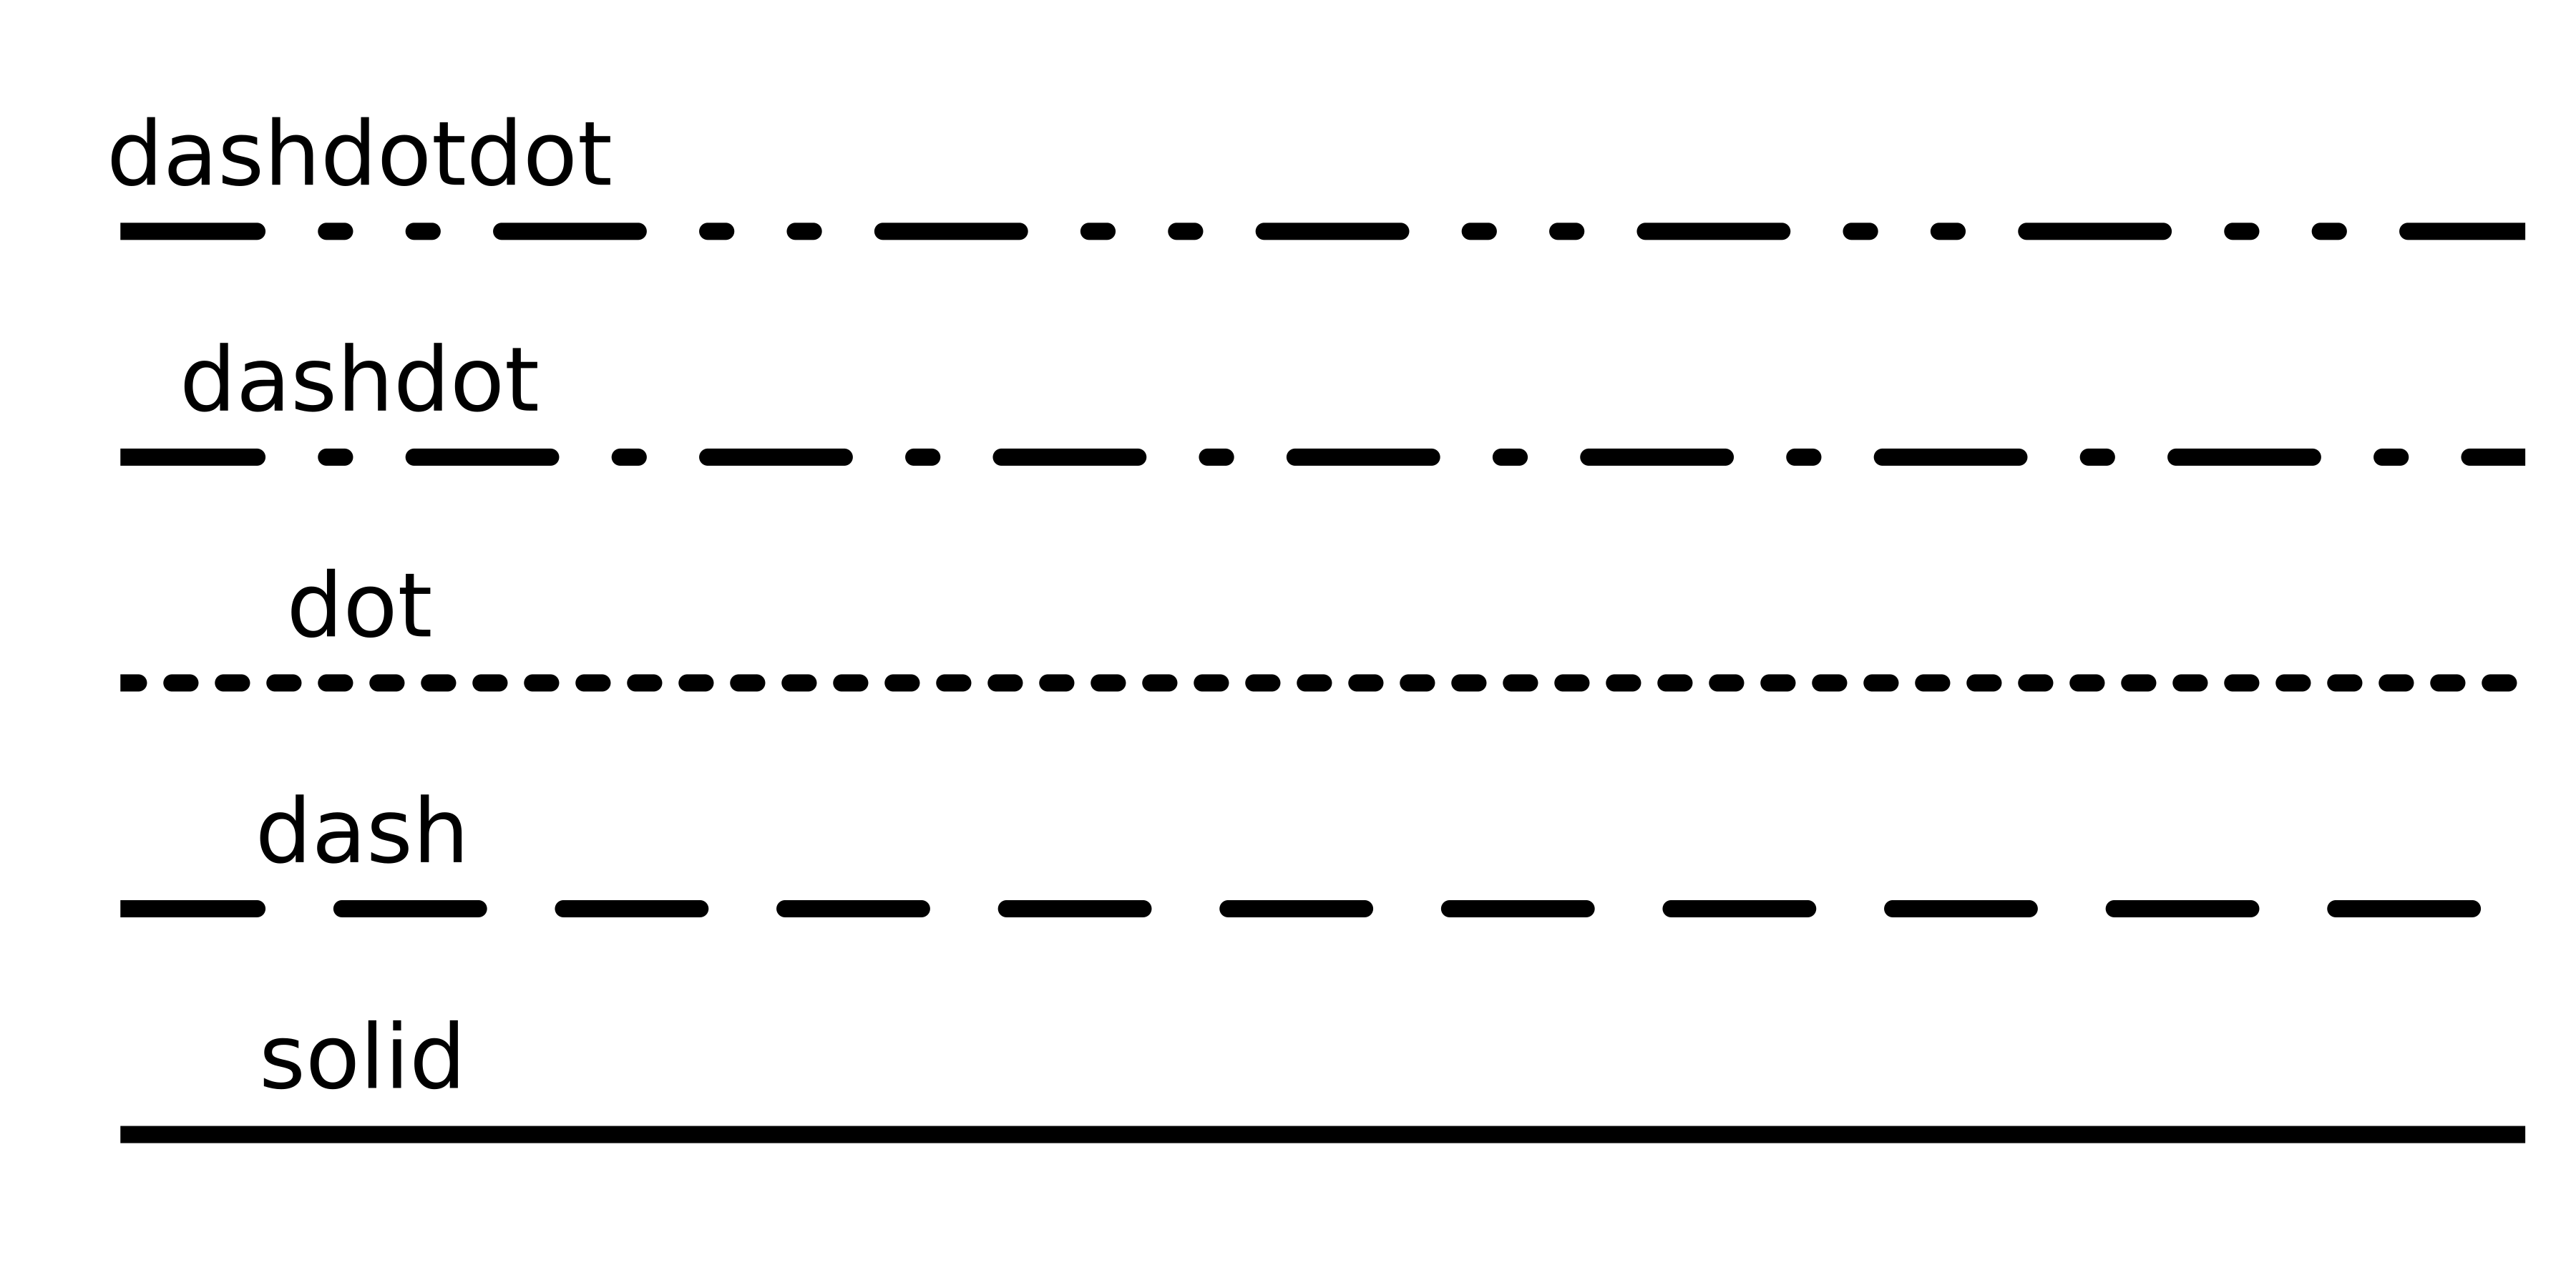
alpha=opacity_valuexlims!(), ylims!()Çizgi özniteliği: linetyle

Gösterge öznitelikleri
legend_titlelegend_position (:right, :left, :top, :bottom, :topright, :topleft, ...)Julia ile Veri Görselleştirmeye Giriş