İzolasyon skorunu görselleştirme
R ile Anomali Tespitine Giriş

Alastair Rushworth
Data Scientist
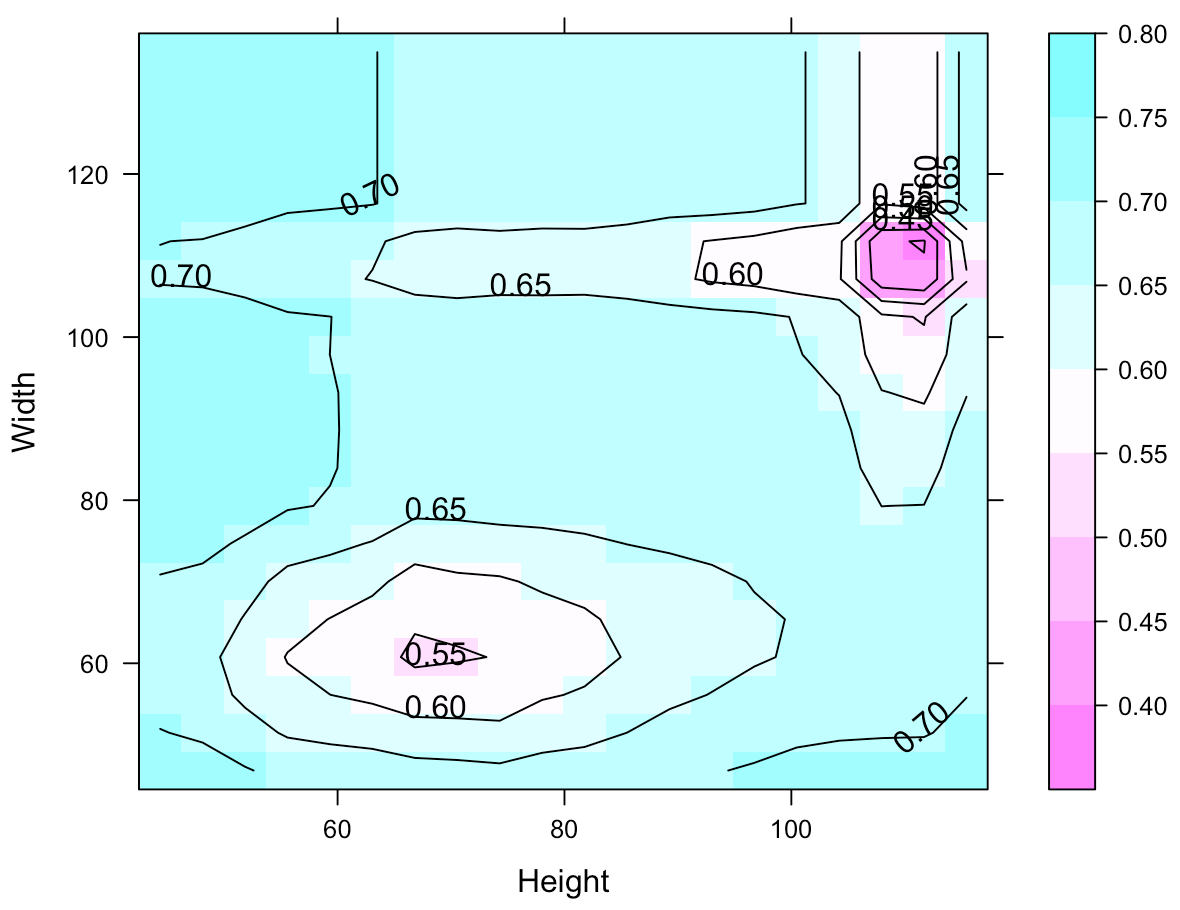
Kontur grafiği oluşturun!
library(lattice)
contourplot(score ~ Height + Width, data = furniture_grid,
            region = TRUE)
R ile Anomali Tespitine Giriş
Alastair Rushworth
Data Scientist
library(lattice)
contourplot(score ~ Height + Width, data = furniture_grid,
region = TRUE)

