Mevsimsel zaman serilerinde birden çok anomali tespiti
R ile Anomali Tespitine Giriş

Alastair Rushworth
Data Scientist
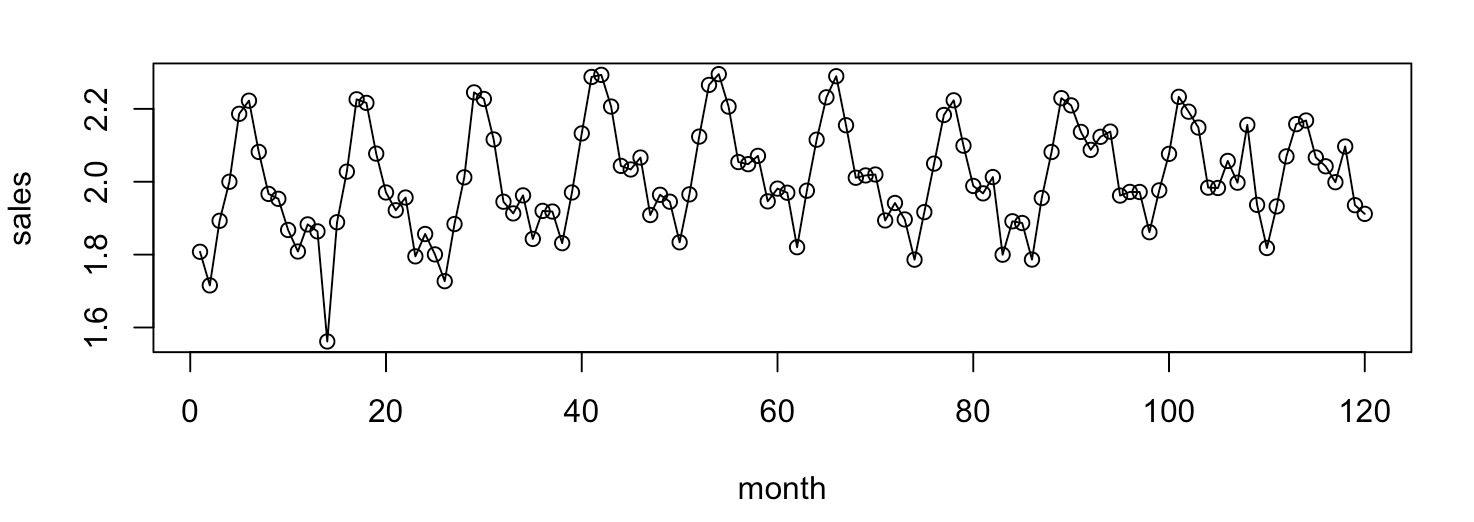
Aylık gelirin görselleştirilmesi
plot(sales ~ month, data = msales, type = 'o')
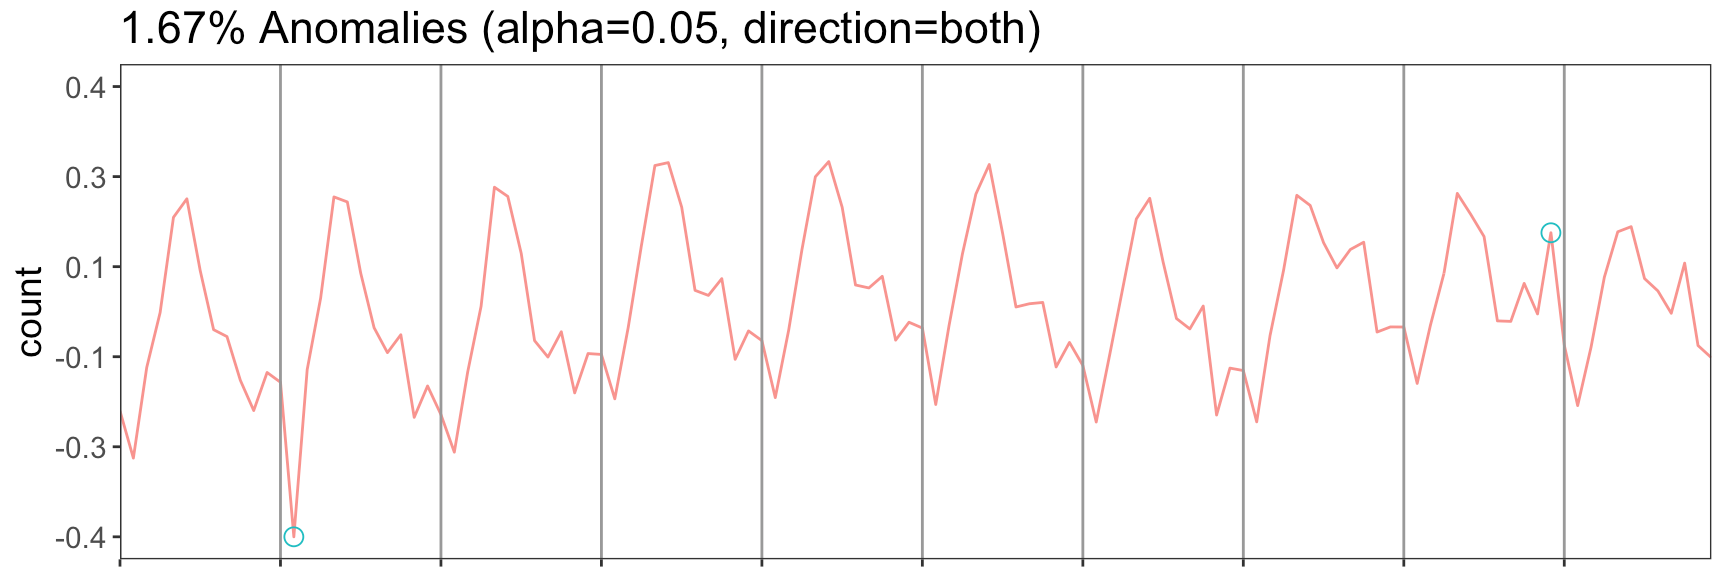
Mevsimsel-Hibrit ESD algoritması grafiği
AnomalyDetectionVec(x = msales$sales, period = 12,
                    direction = 'both', plot = T)