Visualisatie-opties
Introductie tot Power BI

Sara Billen
Senior Data Analyst, DataCamp
Visualisatietypen
1 https://learn.datacamp.com/courses/data-visualization-for-everyone
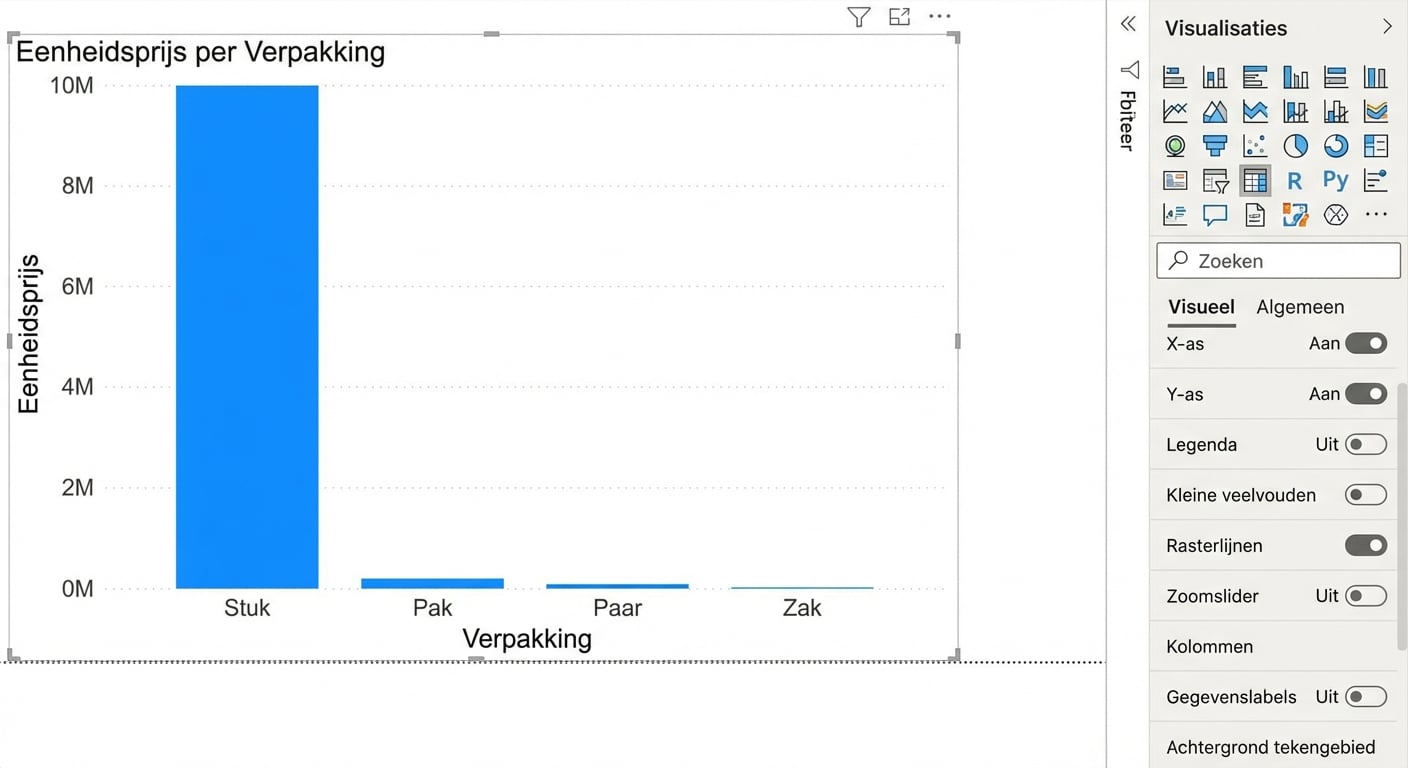
Kolom- en balkdiagrammen
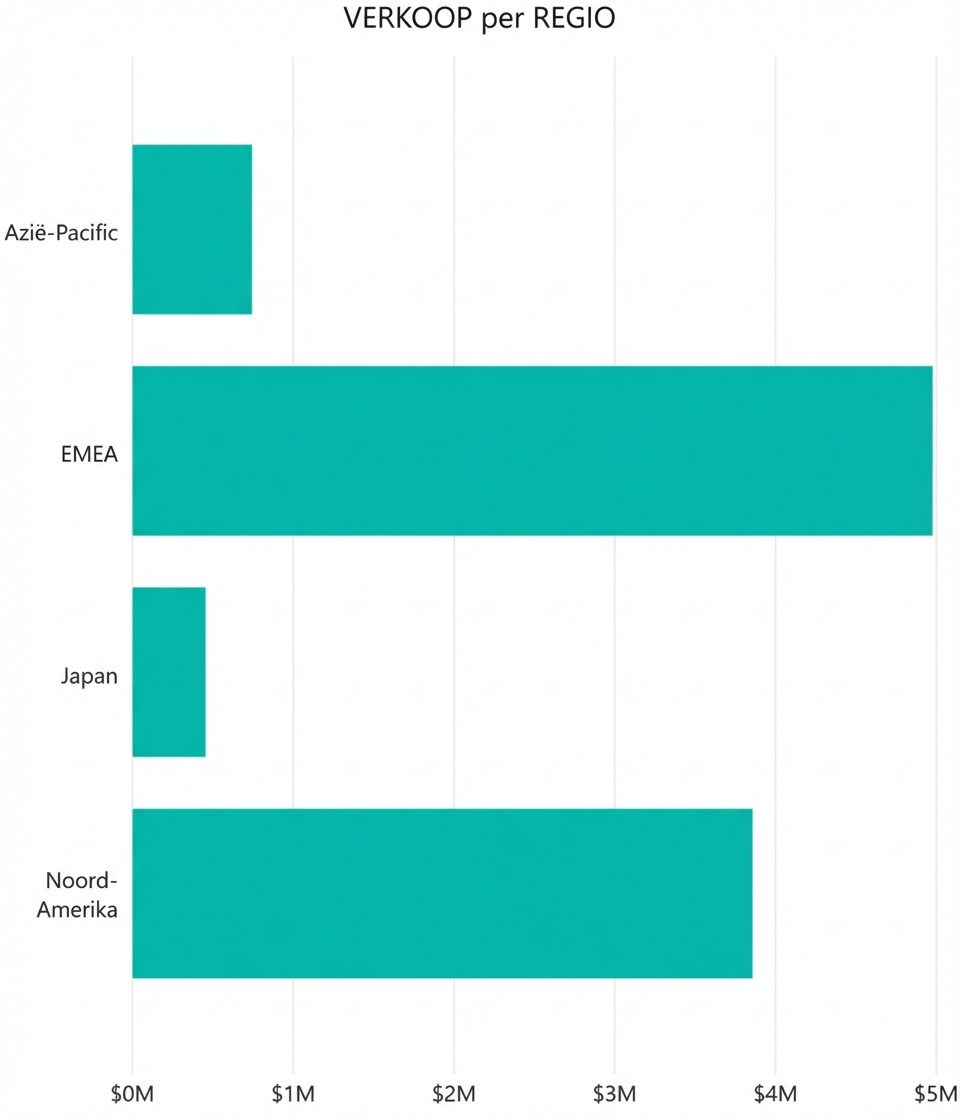
Balkdiagram
- Horizontale rechthoeken
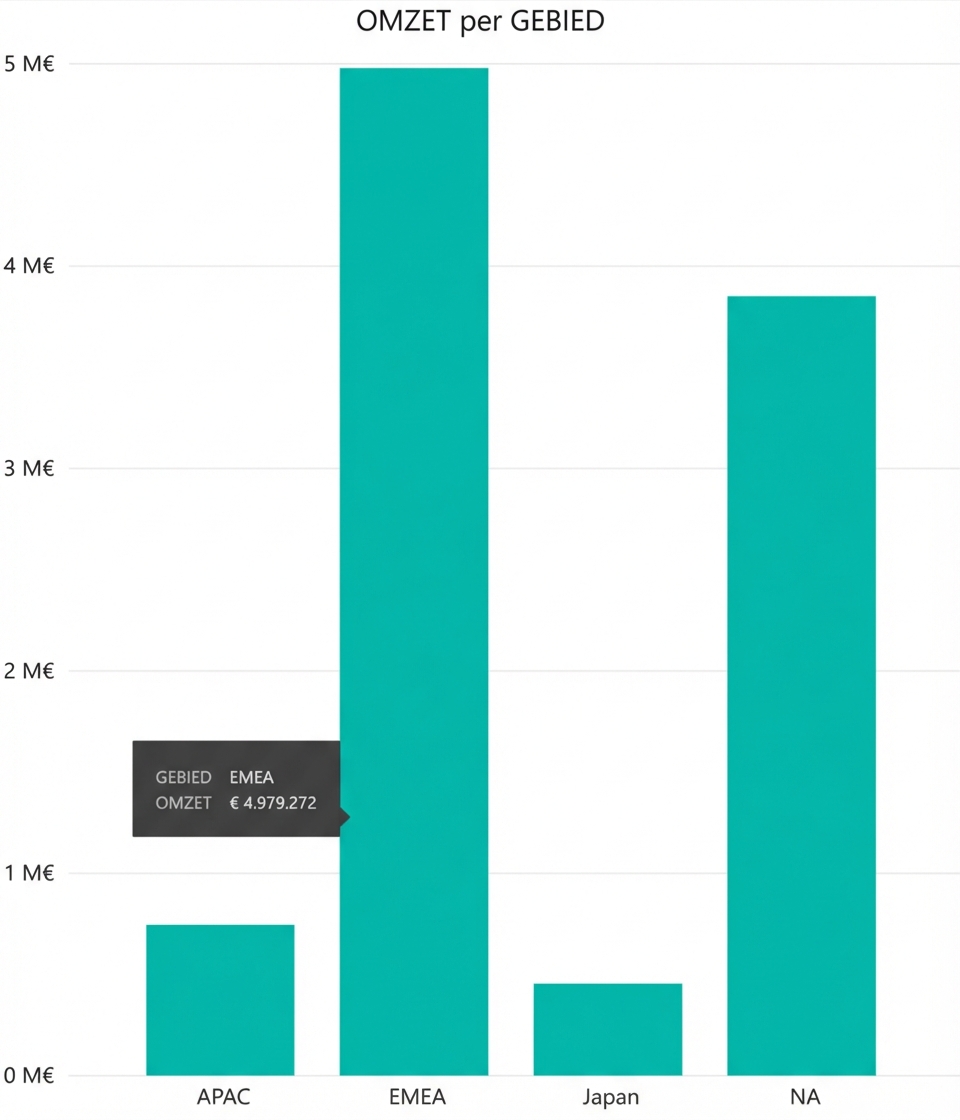
Kolomdiagram
- Verticale rechthoeken
Kolom- en balkdiagrammen
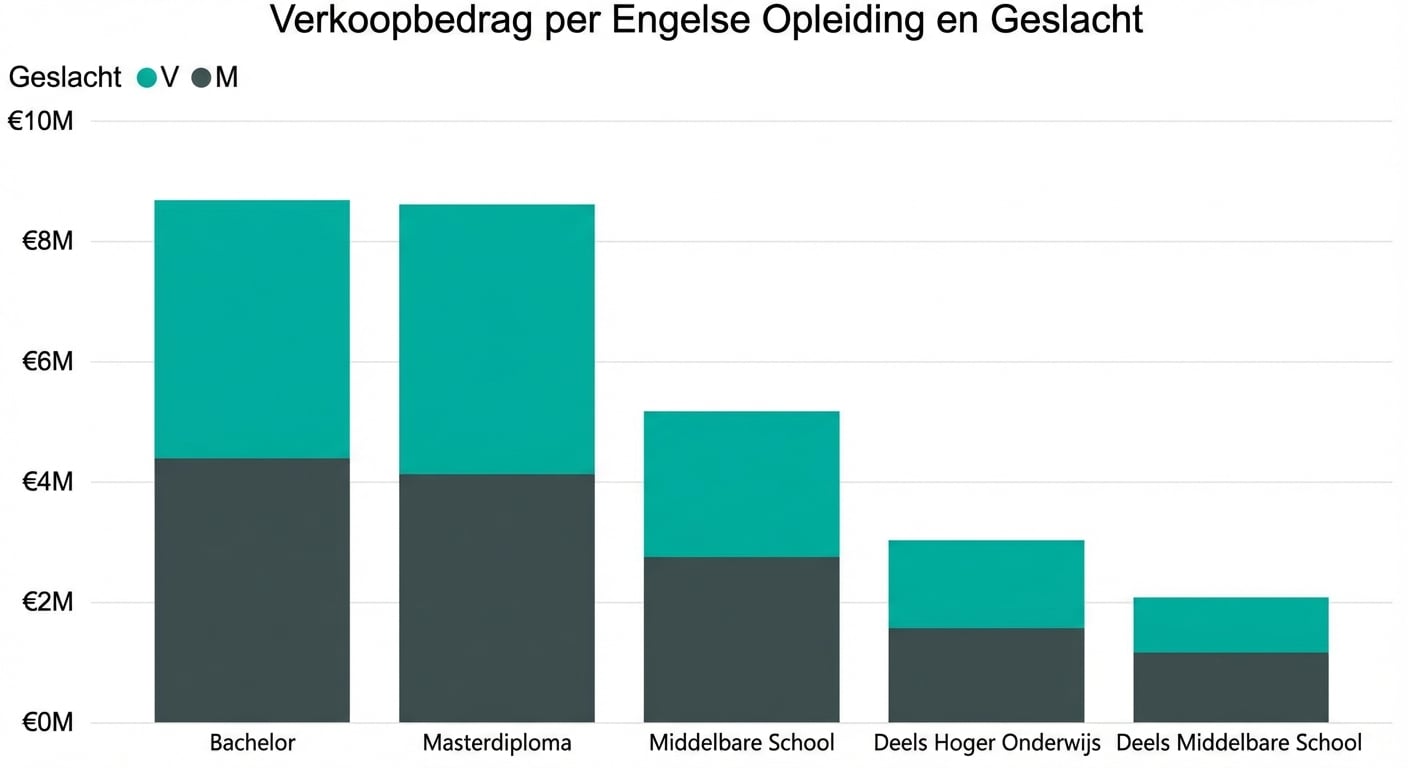
Gestapeld balk- en kolomdiagram
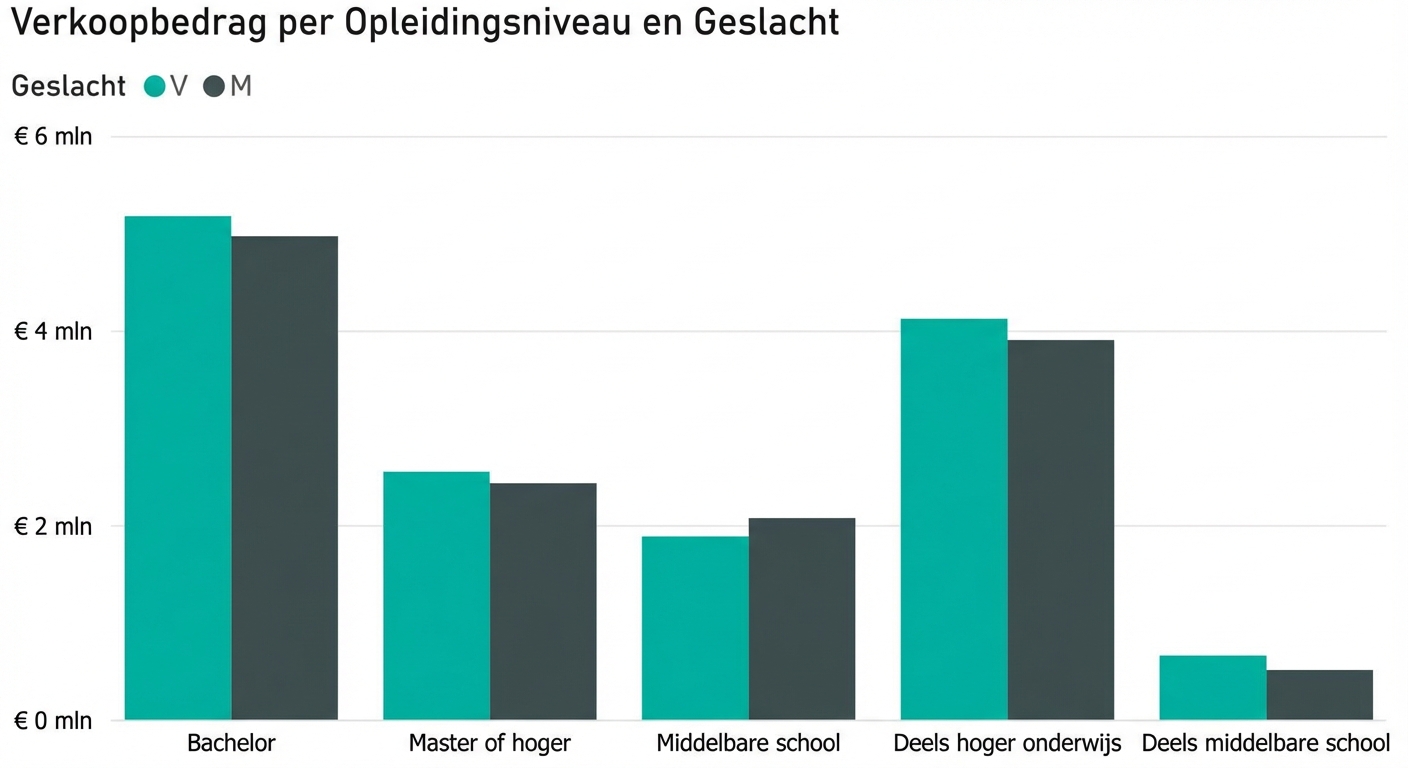
Gegroepeerd balk- en kolomdiagram
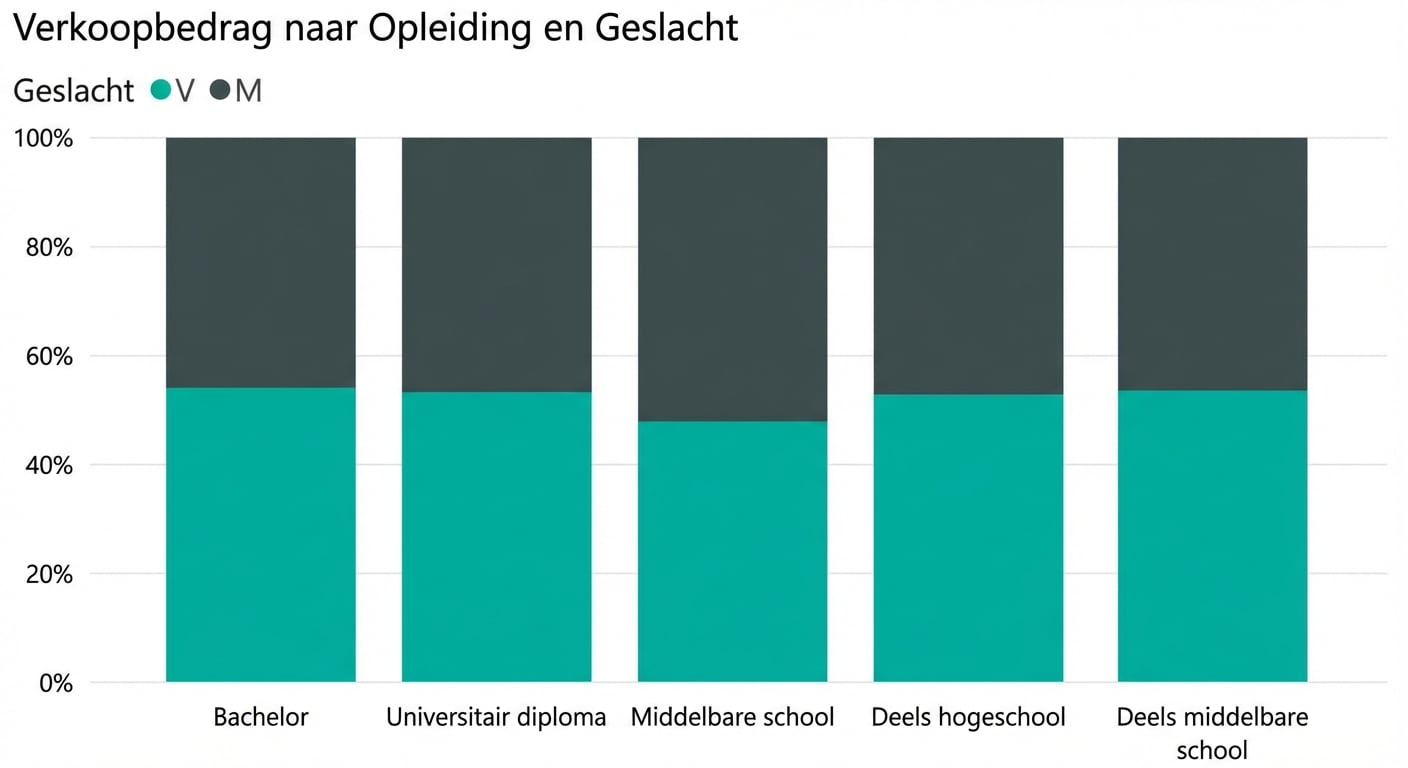
100% gestapeld balk- en kolomdiagram
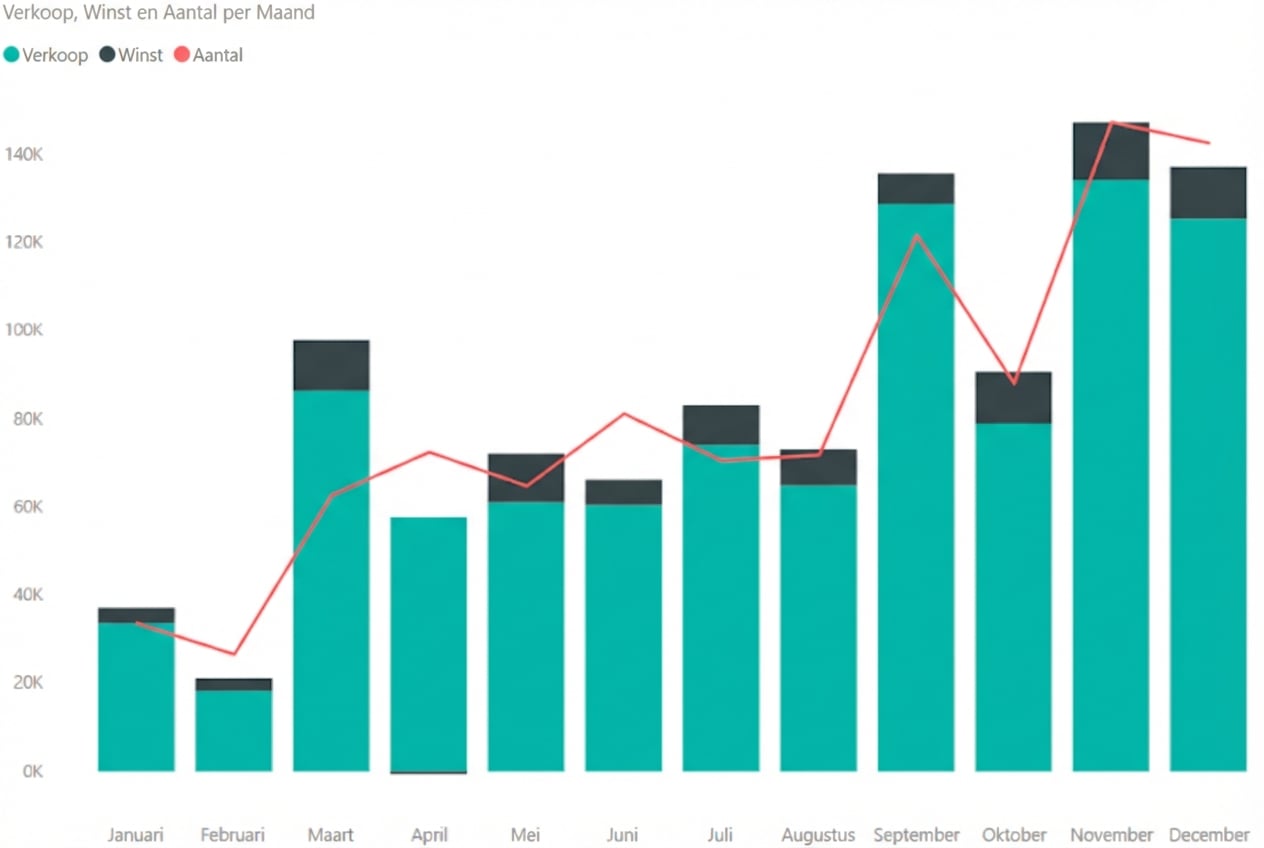
Combinatiediagram
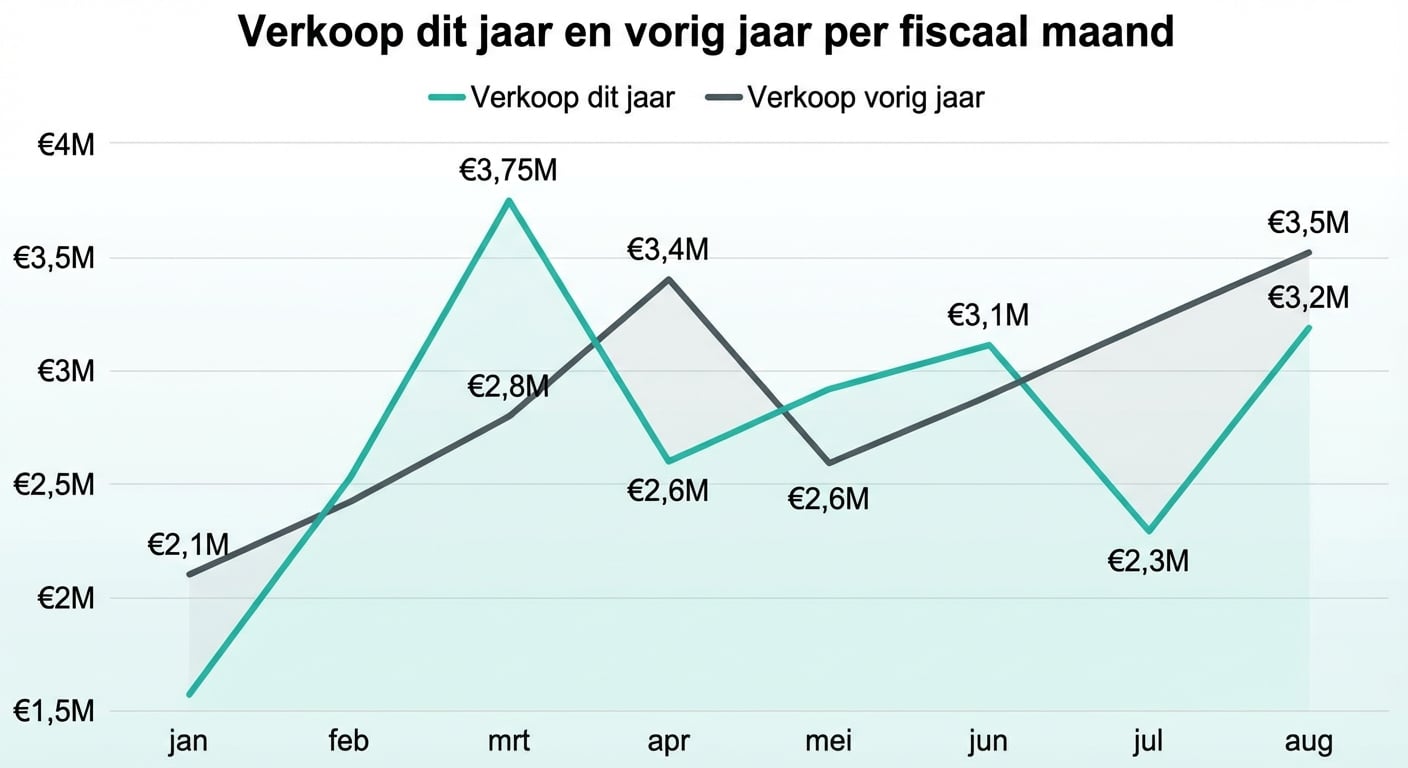
Lijndiagrammen
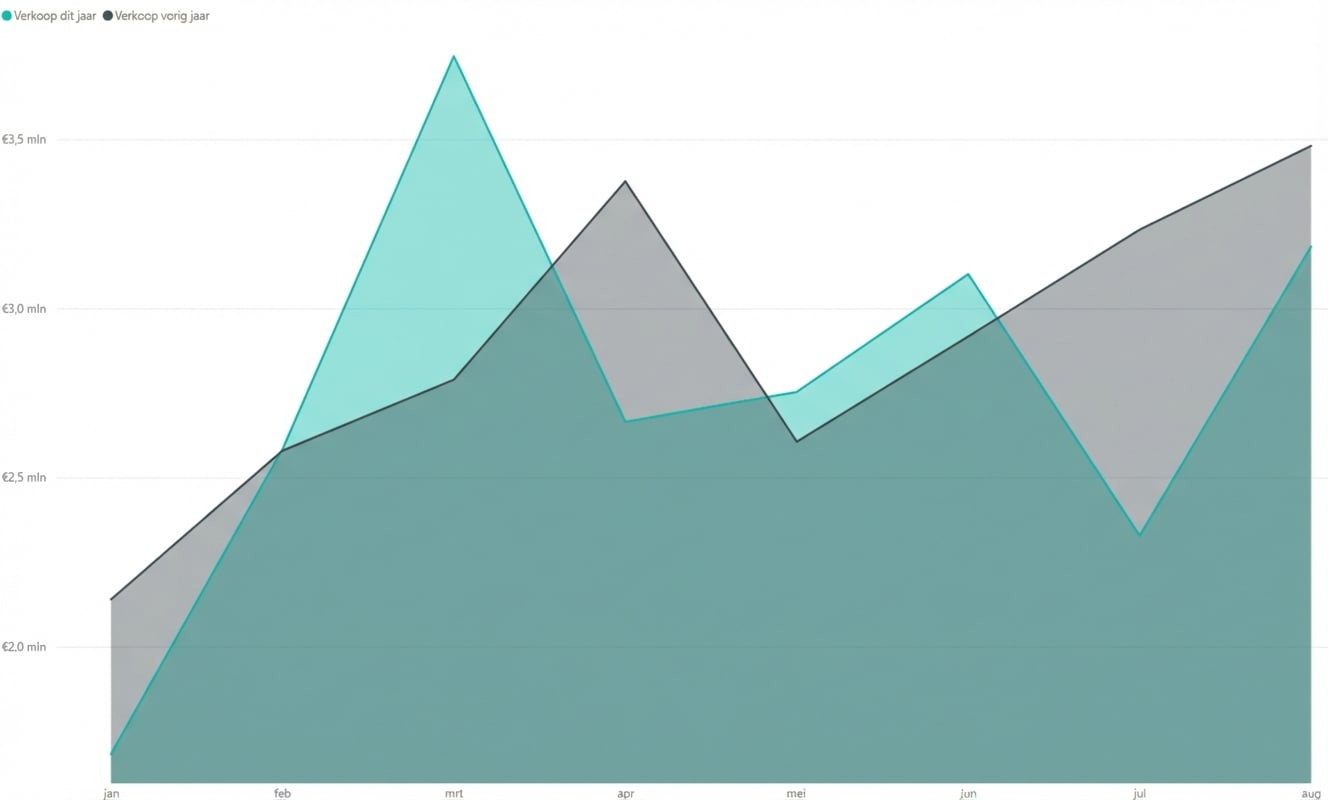
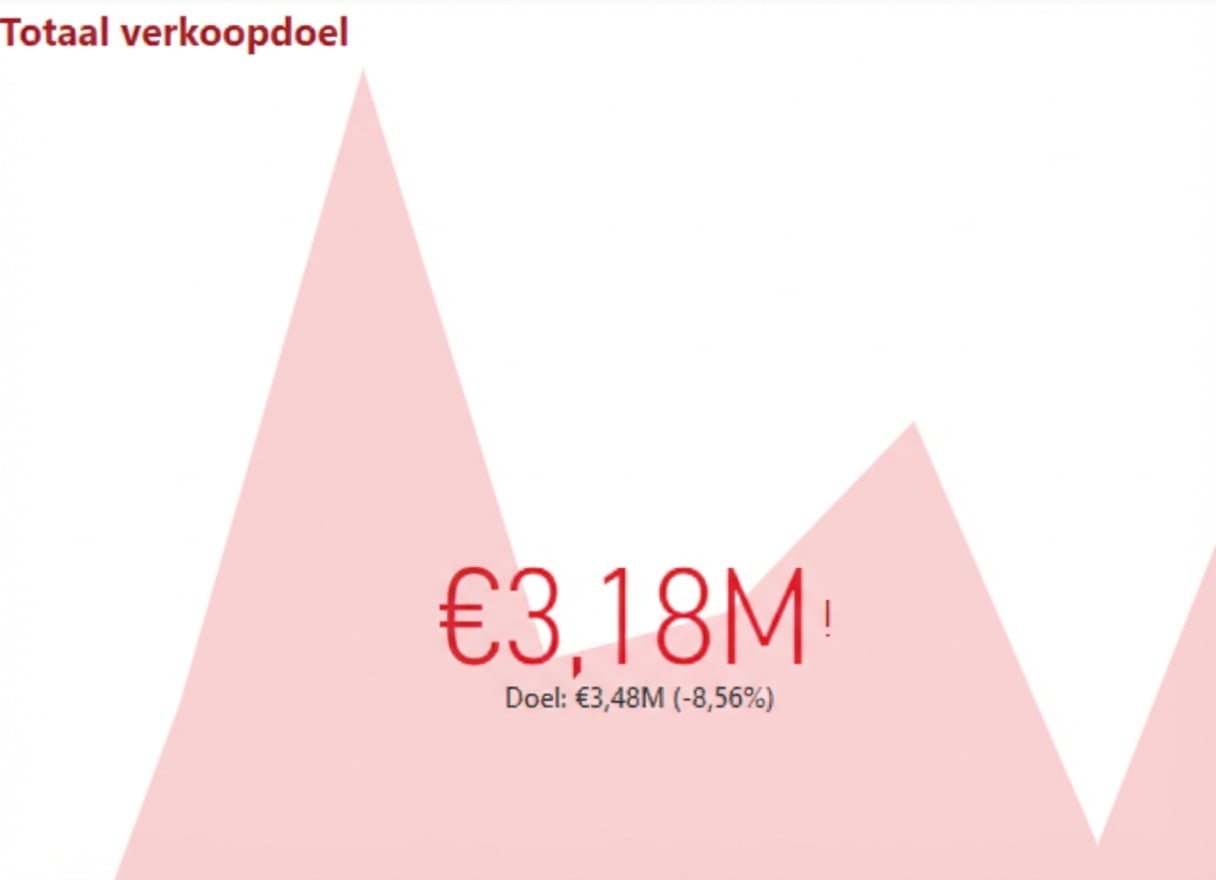
Vlakdiagrammen
Cirkel- en donutdiagrammen
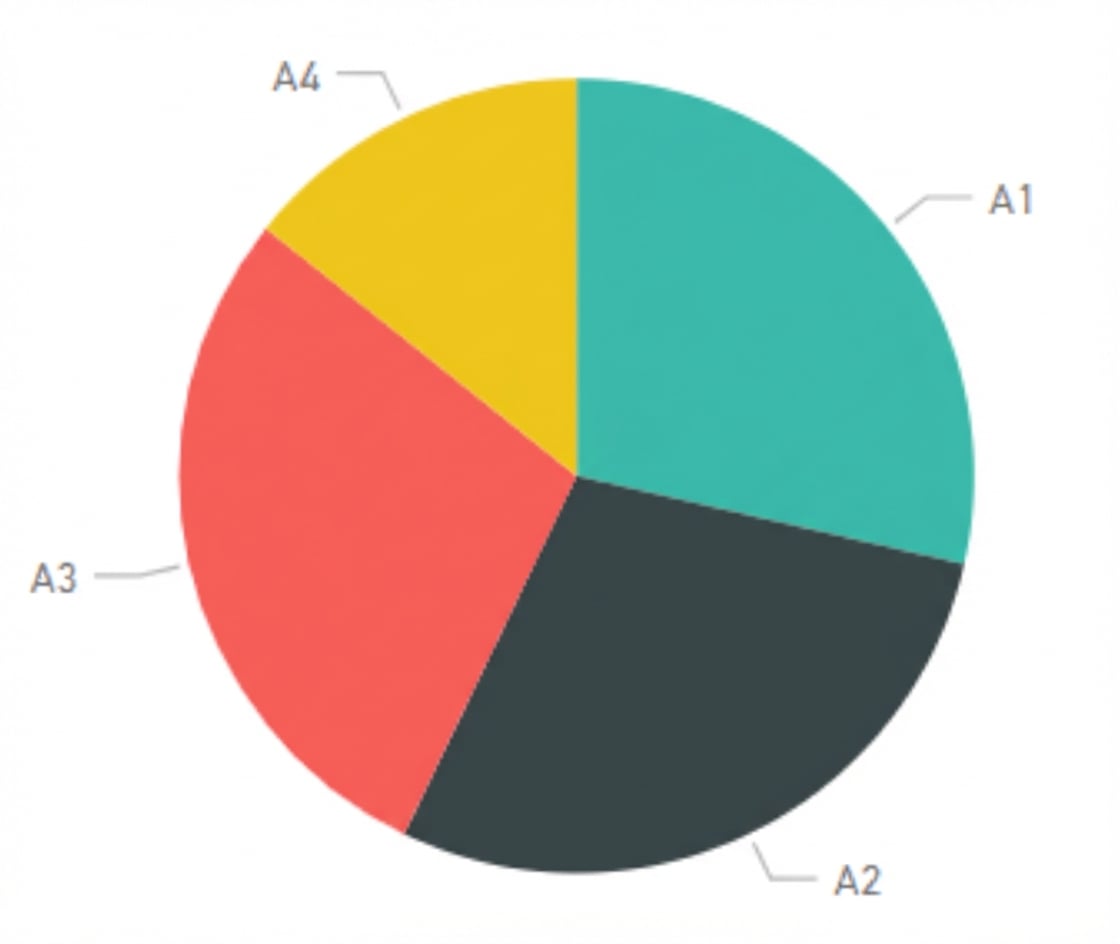
Cirkeldiagram
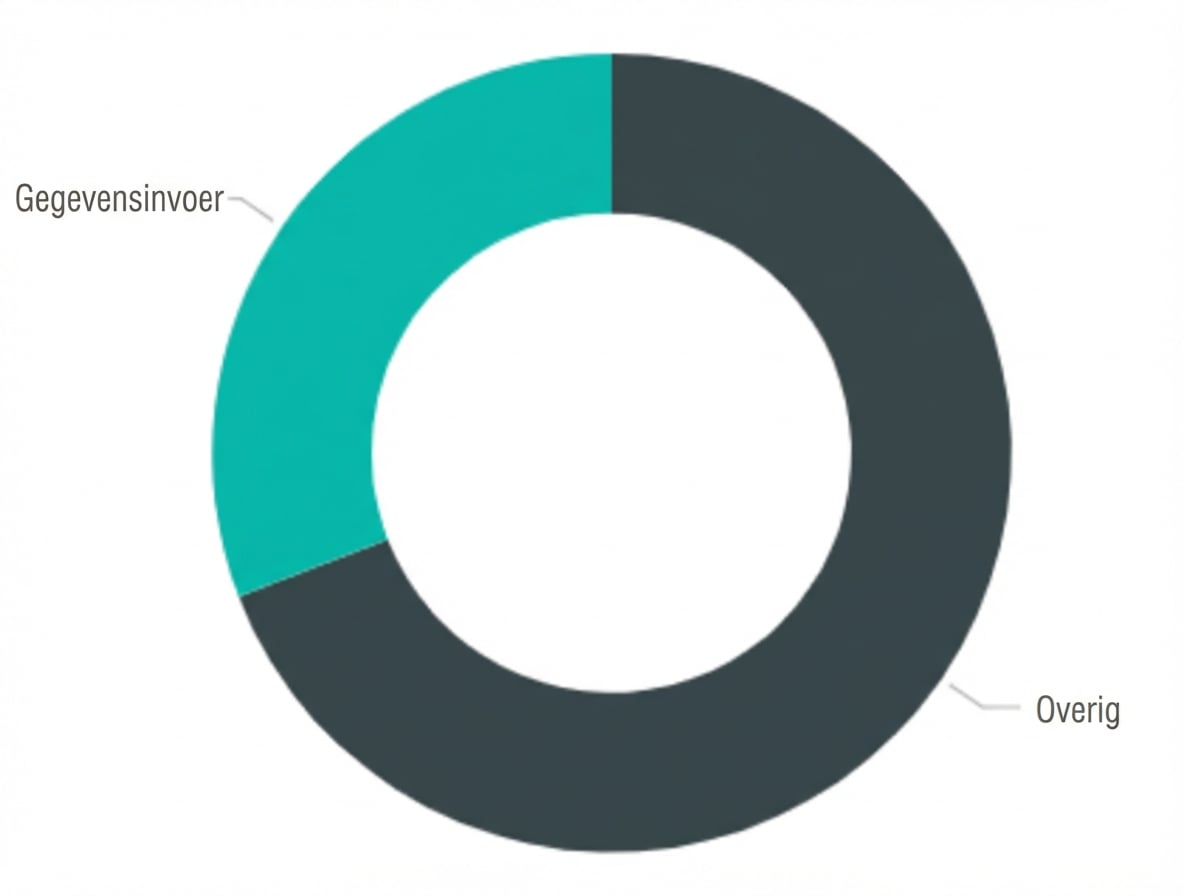
Donutdiagram
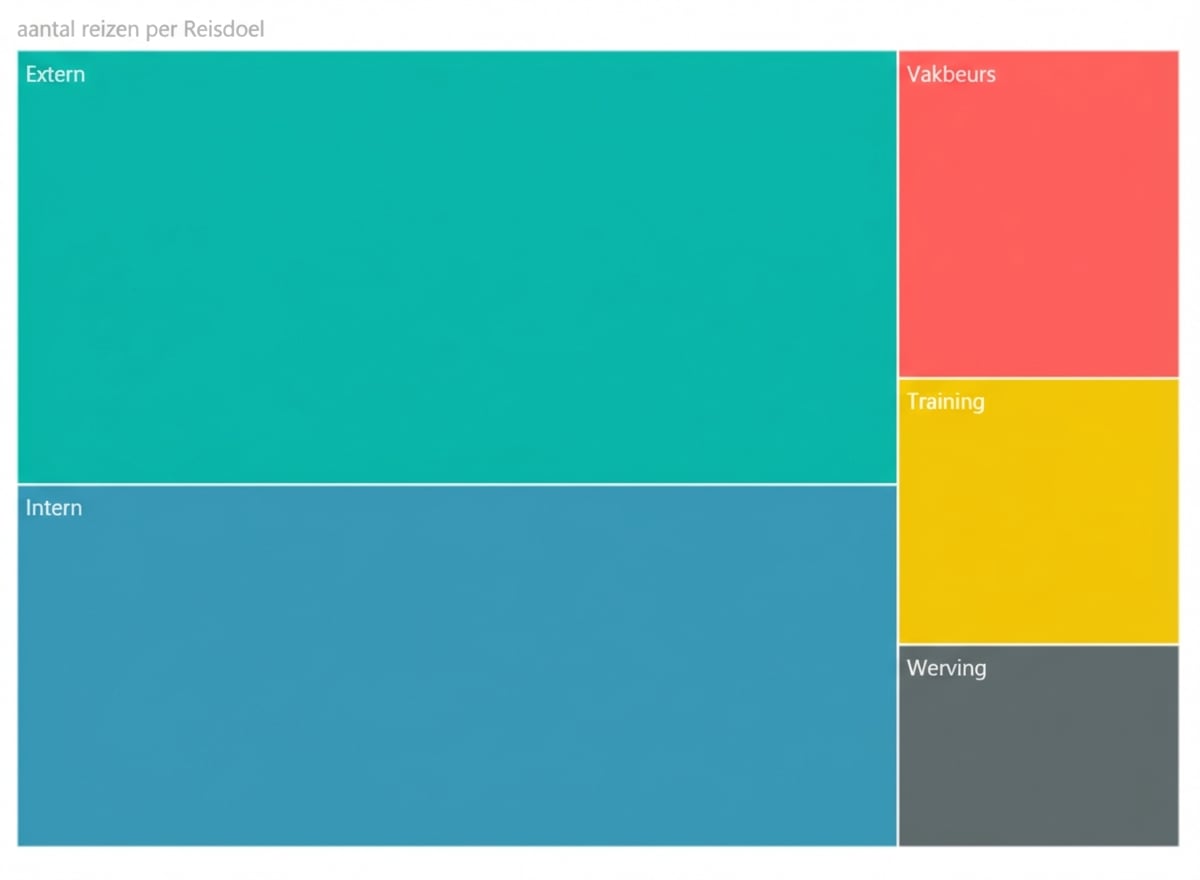
Boomkaarten
Andere visualisatietypen
Kaart
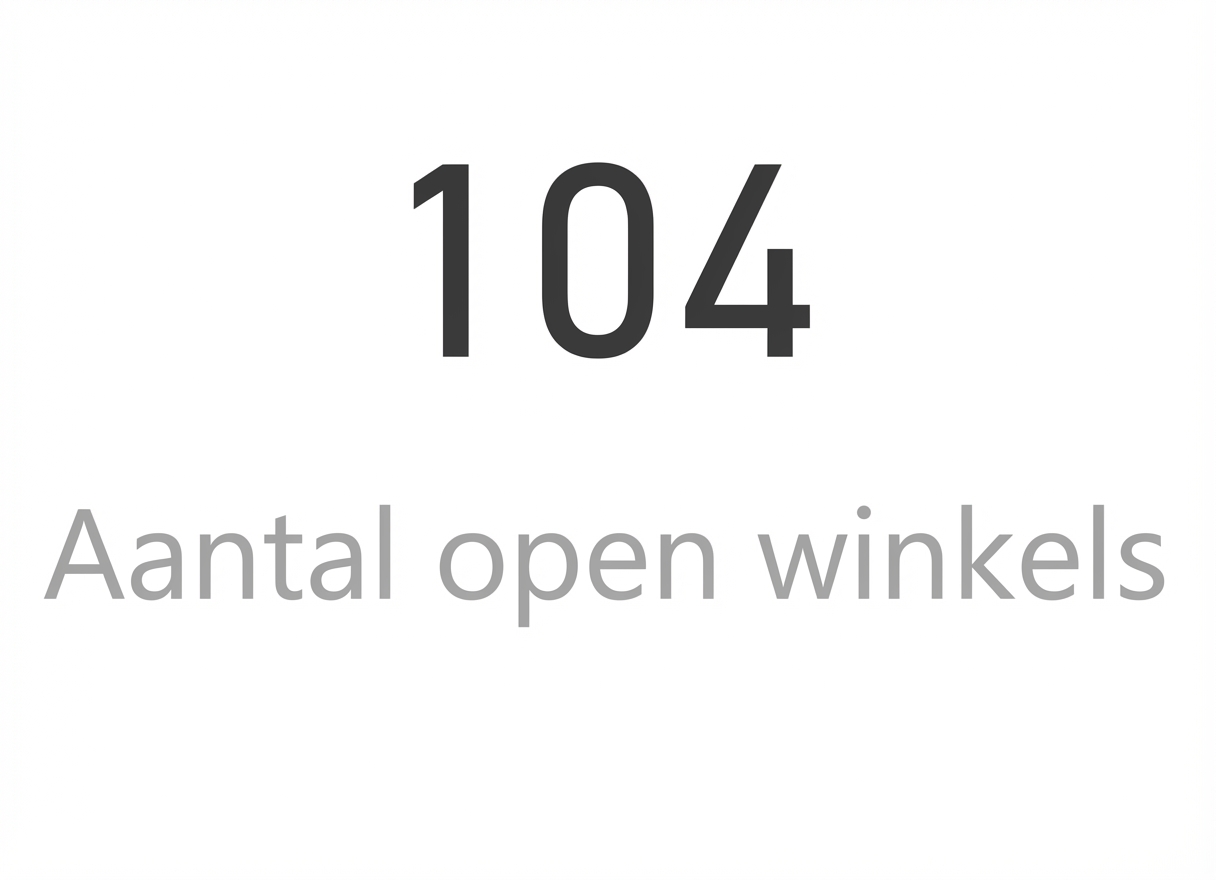
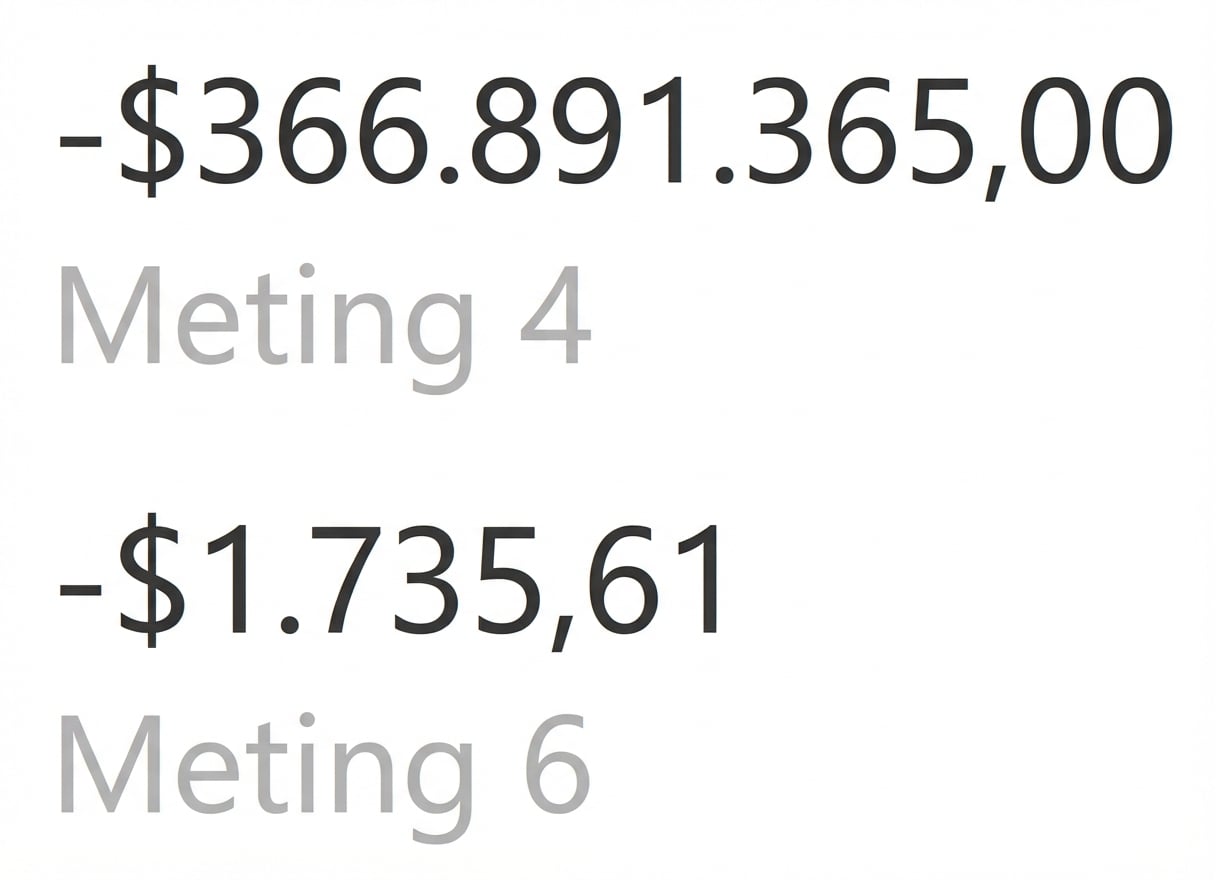
Kaart met meerdere rijen
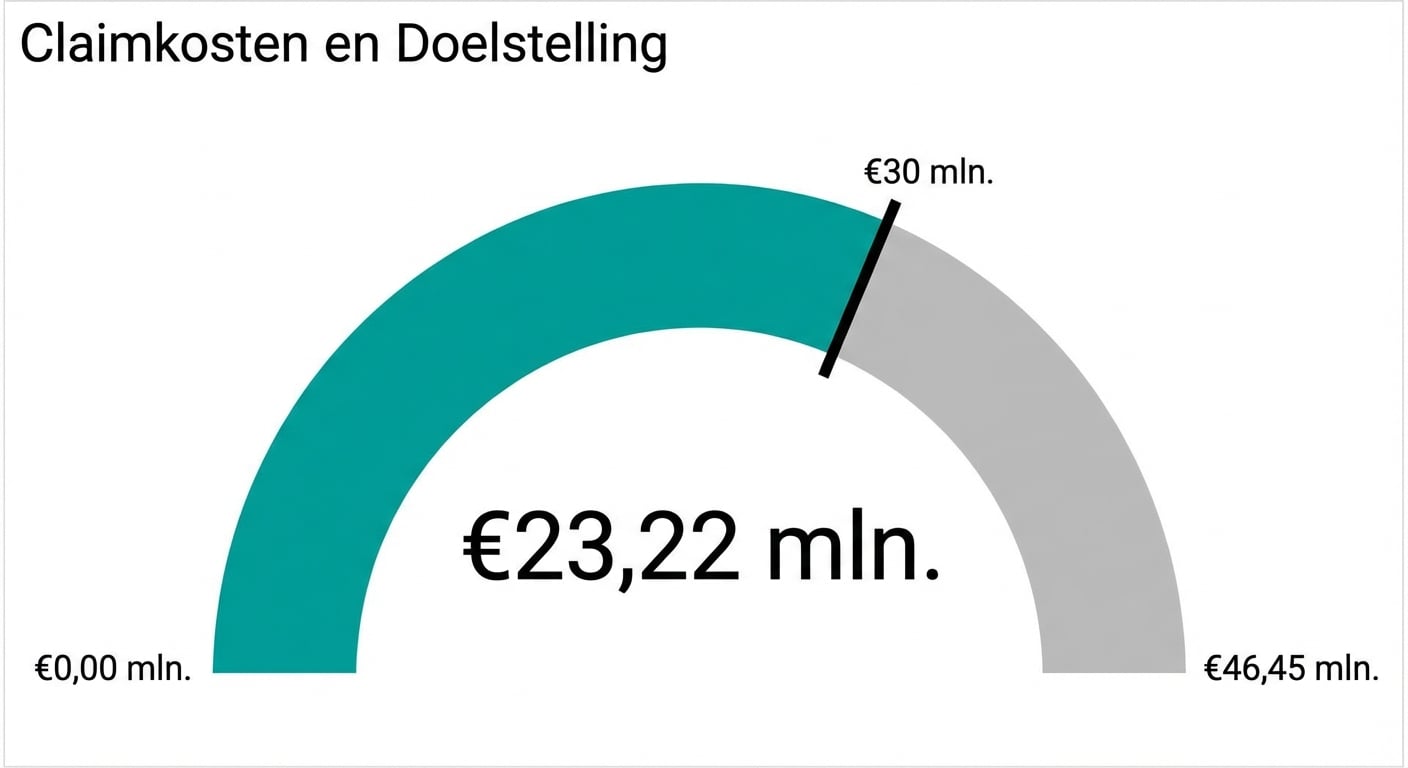
Meterdiagram
KPI
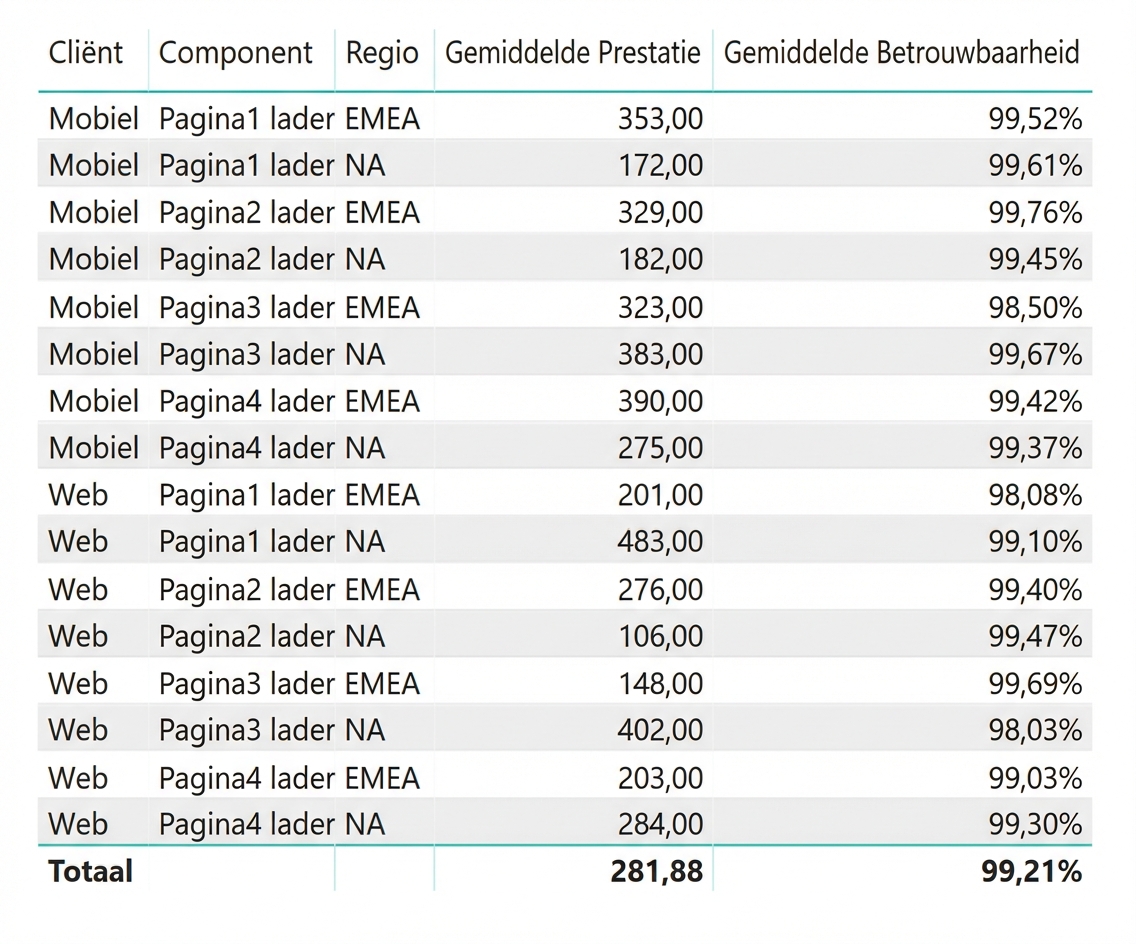
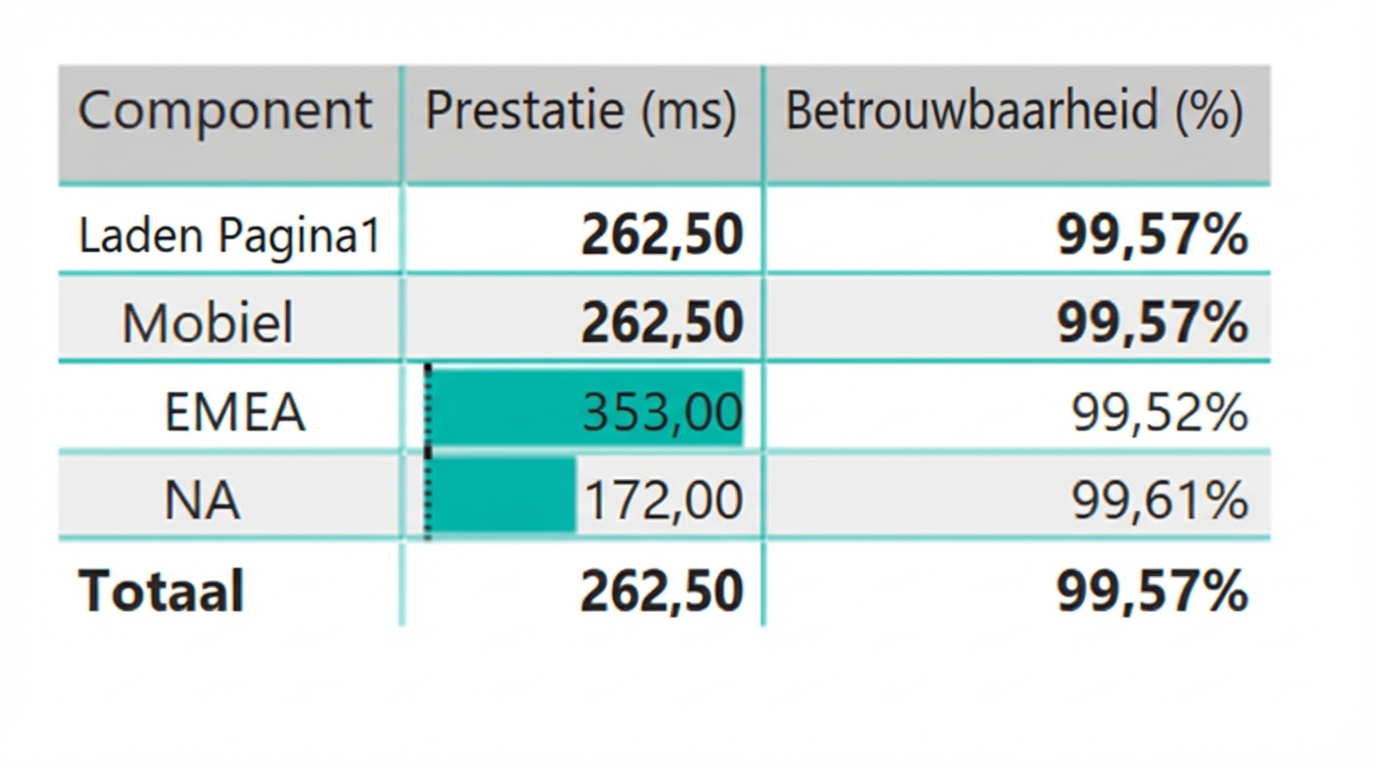
Tabel en matrix
Tabel
Matrix
Visualisaties bewerken
Contoso datawarehouse-dataset