Kanttekeningen bij correlatie

Introductie tot statistiek in Python

Maggie Matsui

Content Developer, DataCamp

Niet-lineaire verbanden
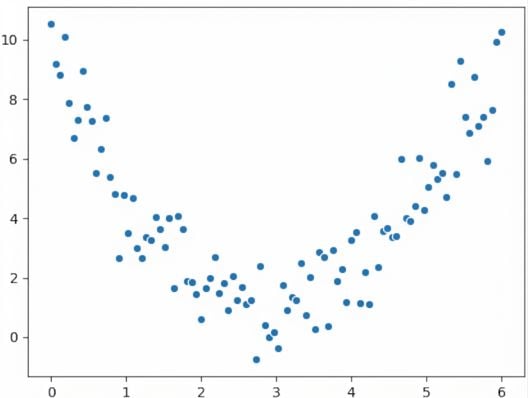
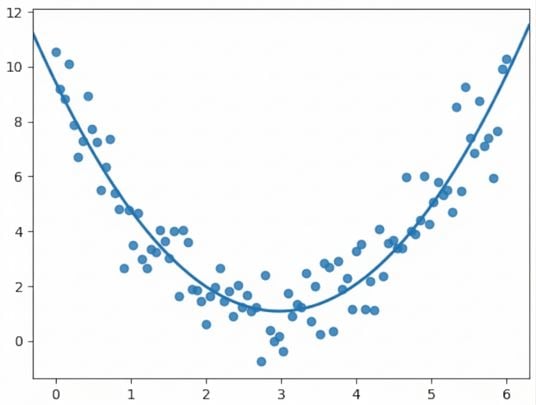
spreidingsdiagram van variabelen met een kwadratisch verband

$$r = 0.18$$

Introductie tot statistiek in Python

Niet-lineaire verbanden

Wat we zien:

spreidingsdiagram van variabelen met een kwadratisch verband met kwadratische trendlijn

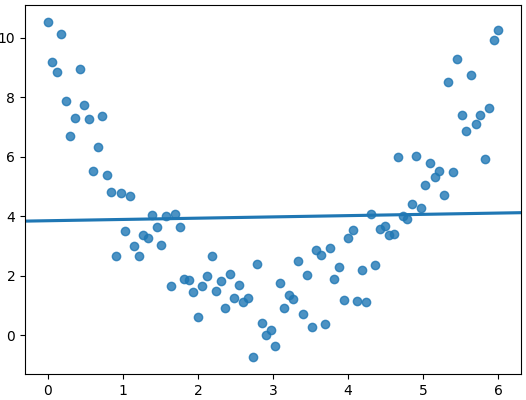
Wat de correlatiecoëfficiënt ziet:

spreidingsdiagram van variabelen met een kwadratisch verband met een lineaire trendlijn

Introductie tot statistiek in Python

Correlatie dekt alleen lineaire verbanden

Gebruik correlatie niet blindelings

df['x'].corr(df['y'])
0.081094

Visualiseer je data altijd

spreidingsdiagram van variabelen met een kwadratisch verband

Introductie tot statistiek in Python

Slaappatroongegevens van zoogdieren

print(msleep)
                 name       genus   vore         order  ... sleep_cycle  awake  brainwt   bodywt
1             Cheetah    Acinonyx  carni     Carnivora  ...         NaN   11.9      NaN   50.000
2          Owl monkey       Aotus   omni      Primates  ...         NaN    7.0  0.01550    0.480
3     Mountain beaver  Aplodontia  herbi      Rodentia  ...         NaN    9.6      NaN    1.350
4 Greater short-ta...     Blarina   omni  Soricomorpha  ...    0.133333    9.1  0.00029    0.019
5                 Cow         Bos  herbi  Artiodactyla  ...    0.666667   20.0  0.42300  600.000
..                ...         ...    ...           ...  ...         ...    ...      ...      ...
79         Tree shrew      Tupaia   omni    Scandentia  ...    0.233333   15.1  0.00250    0.104
80 Bottle-nosed do...    Tursiops  carni       Cetacea  ...         NaN   18.8      NaN  173.330
81              Genet     Genetta  carni     Carnivora  ...         NaN   17.7  0.01750    2.000
82         Arctic fox      Vulpes  carni     Carnivora  ...         NaN   11.5  0.04450    3.380
83            Red fox      Vulpes  carni     Carnivora  ...    0.350000   14.2  0.05040    4.230
Introductie tot statistiek in Python

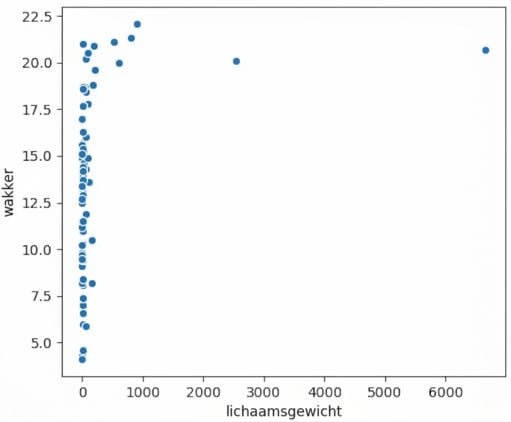
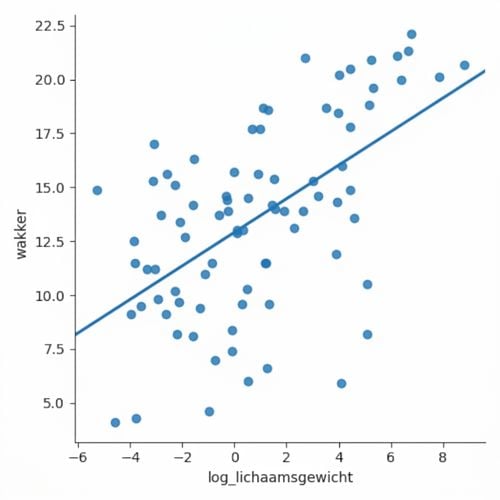
Lichaamsgewicht vs. wakkere tijd

Spreidingsdiagram van lichaamsgewicht vs wakkere tijd

msleep['bodywt'].corr(msleep['awake'])
0.3119801
Introductie tot statistiek in Python

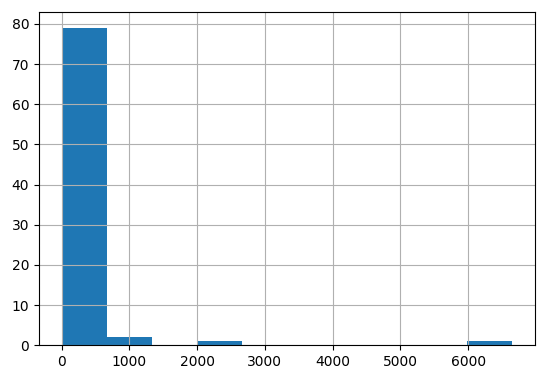
Verdeling van lichaamsgewicht

Histogram van variabele bodywt

Introductie tot statistiek in Python

Logtransformatie

msleep['log_bodywt'] = np.log(msleep['bodywt'])

sns.lmplot(x='log_bodywt', y='awake', data=msleep, ci=None) plt.show()
msleep['log_bodywt'].corr(msleep['awake'])
0.5687943

Spreidingsdiagram van log bodywt vs awake

Introductie tot statistiek in Python

Andere transformaties

  • Logtransformatie (log(x))
  • Worteltransformatie (sqrt(x))
  • Reciproque transformatie (1 / x)

  • Combinaties hiervan, bijv.:

    • log(x) en log(y)
    • sqrt(x) en 1 / y
Introductie tot statistiek in Python

Waarom een transformatie gebruiken?

  • Bepaalde statistische methoden vereisen een lineair verband tussen variabelen
    • Correlatiecoëfficiënt
    • Lineaire regressie


Introduction to Linear Modeling in Python

Introductie tot statistiek in Python

Correlatie impliceert geen causaliteit

                x is gecorreleerd met y betekent niet x veroorzaakt y
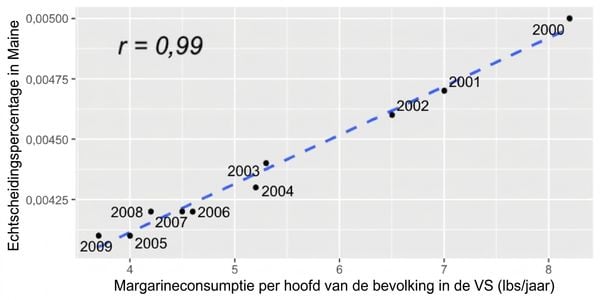
Spreidingsdiagram van margarineconsumptie per persoon in de VS vs echtscheidingspercentage in Maine. De variabelen zijn sterk gecorreleerd met een correlatiecoëfficiënt van 0,99

Introductie tot statistiek in Python

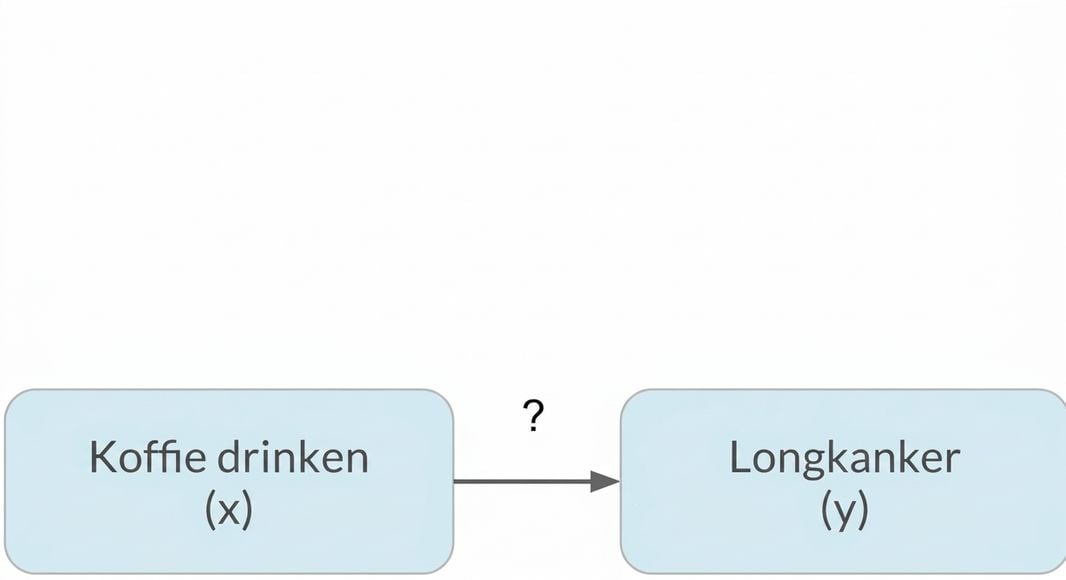
Verwarring (confounding)

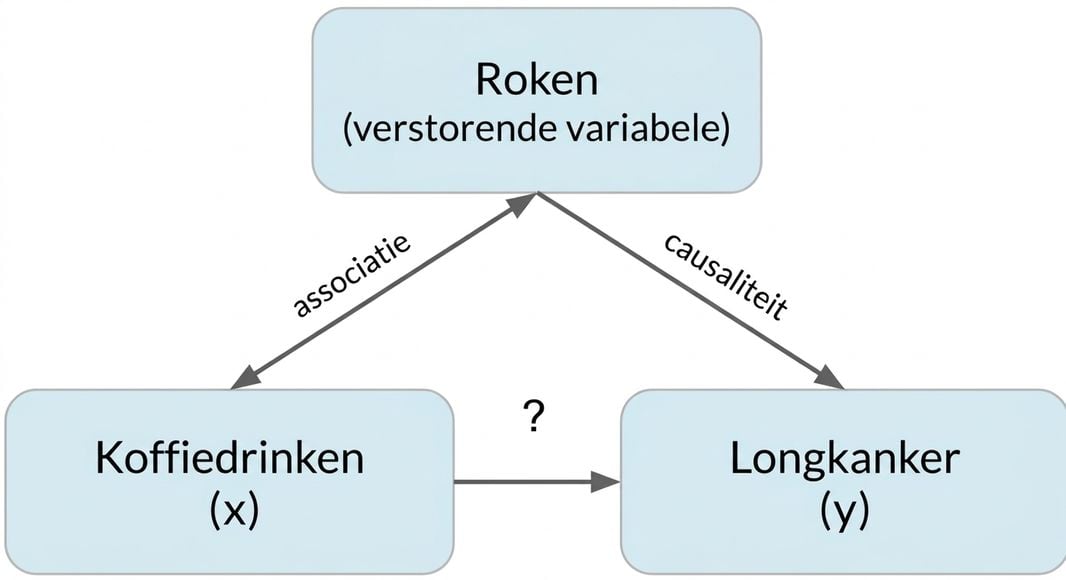
  Koffiedrinken (x) wijst naar longkanker (y)

Introductie tot statistiek in Python

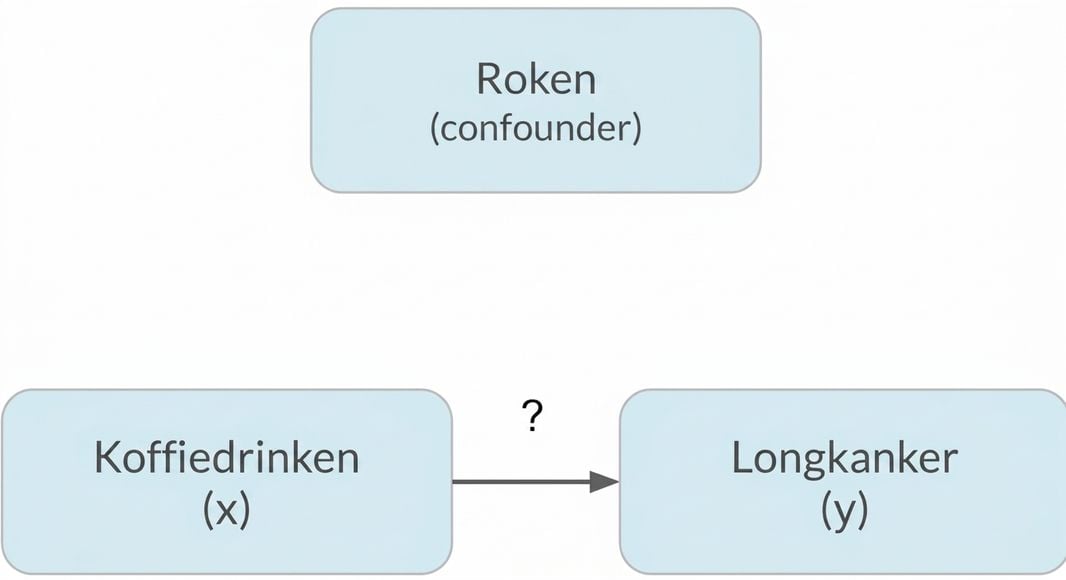
Verwarring (confounding)

  Koffiedrinken (x) wijst naar longkanker (y) met roken (confounder) erboven

Introductie tot statistiek in Python

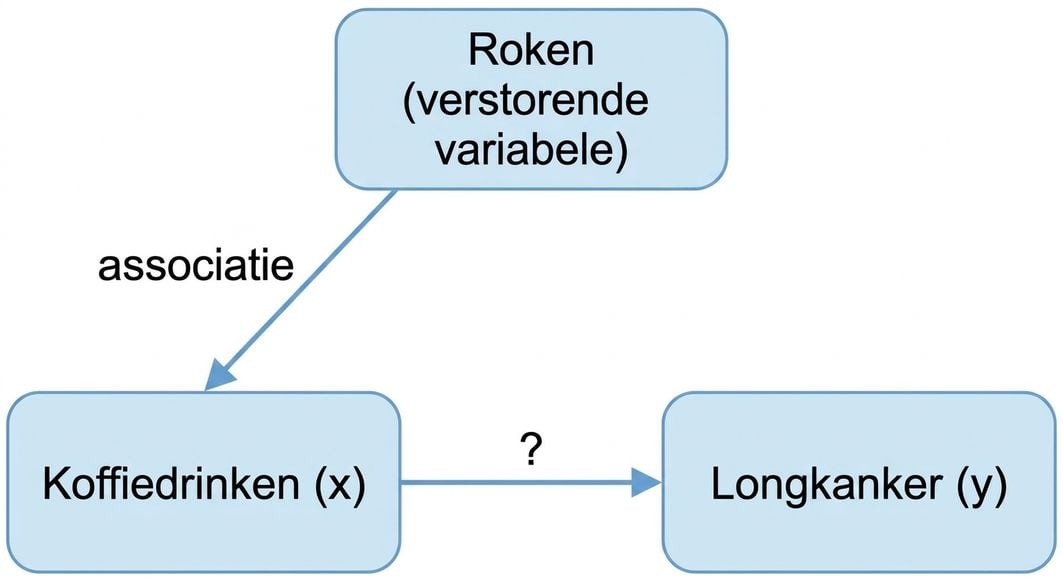
Verwarring (confounding)

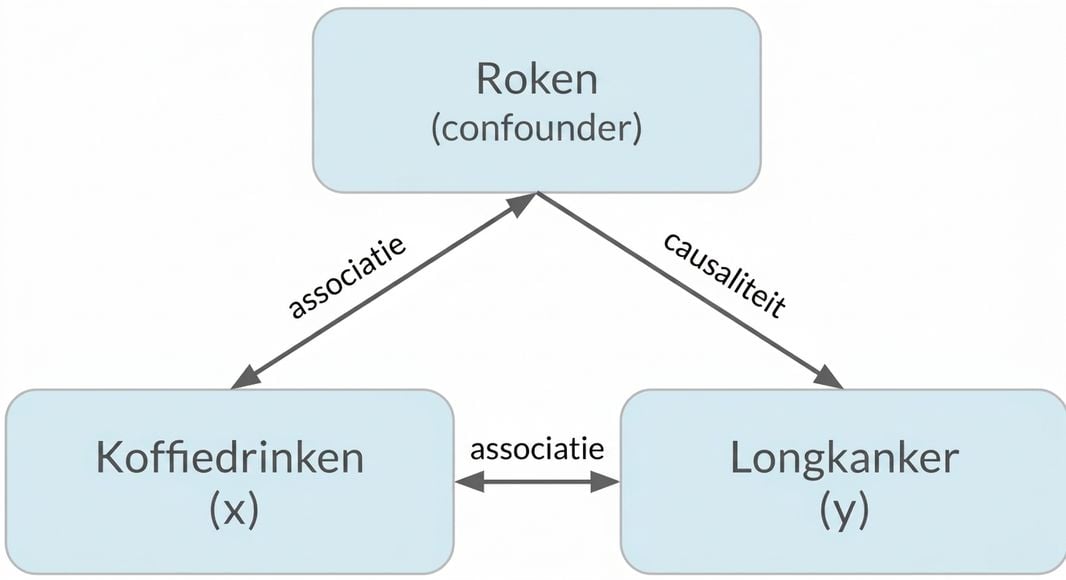
  Koffiedrinken (x) wijst naar longkanker (y) met roken (confounder). Dubbele pijl tussen roken en koffiedrinken, gelabeld "associatie".

Introductie tot statistiek in Python

Verwarring (confounding)

  Koffiedrinken (x) wijst naar longkanker (y) met roken (confounder). Dubbele pijl tussen roken en koffiedrinken, gelabeld "associatie". Pijl van roken naar longkanker gelabeld "causaliteit"

Introductie tot statistiek in Python

Verwarring (confounding)

  Koffiedrinken (x) met dubbele pijl naar longkanker (y) gelabeld "associatie". Dubbele pijl tussen roken en koffiedrinken, gelabeld "associatie". Pijl van roken naar longkanker gelabeld "causaliteit".

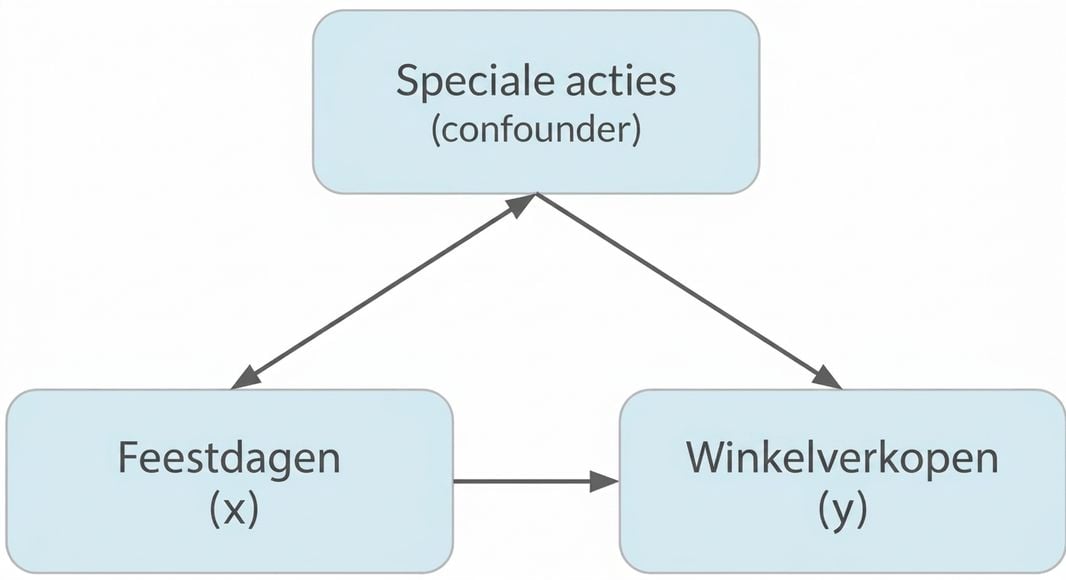
  Feestdagen (x) wijst naar detailhandelsomzet (y). Speciale aanbiedingen (confounder) heeft een dubbele pijl naar feestdagen en een enkele pijl naar detailhandelsomzet.

Introductie tot statistiek in Python

Laten we oefenen!

Introductie tot statistiek in Python

Preparing Video For Download...