Spreidingsmaten

Introductie tot statistiek in Python

Maggie Matsui

Content Developer, DataCamp

Wat is spreiding?
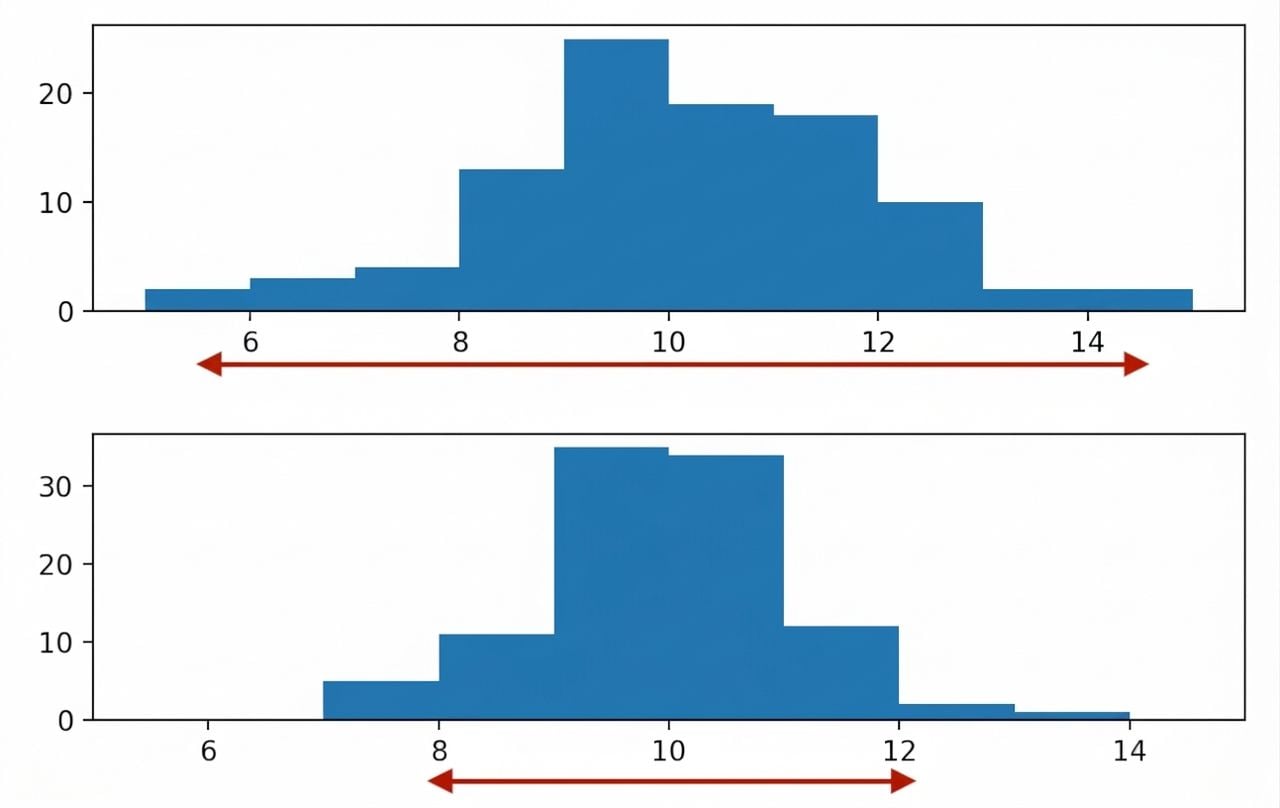
Twee histogrammen: één smal met data over enkele waarden, één breder met data over meer waarden.

Introductie tot statistiek in Python

Variantie

Gemiddelde afstand van elk datapunt tot het gemiddelde
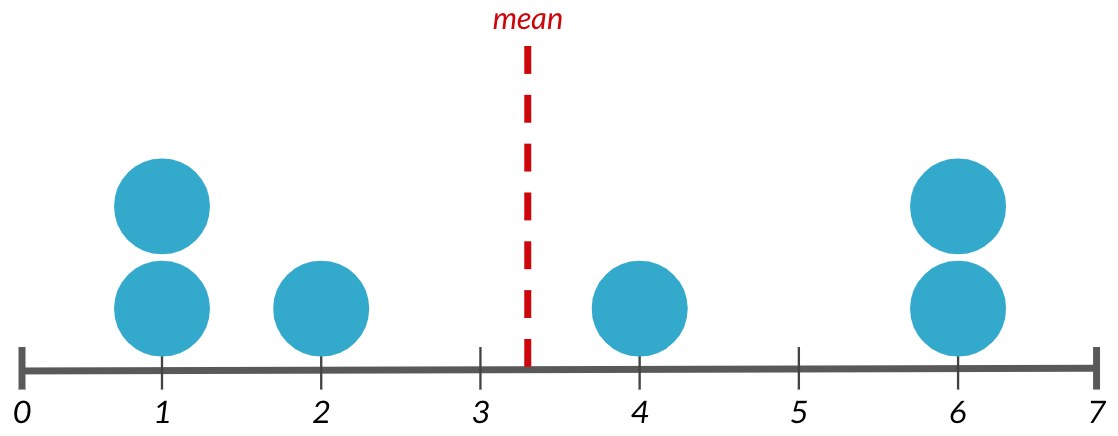
Een dotplot van 7 datapunten met een rode lijn in het midden die het gemiddelde aangeeft.

Introductie tot statistiek in Python

Variantie

Gemiddelde afstand van elk datapunt tot het gemiddelde
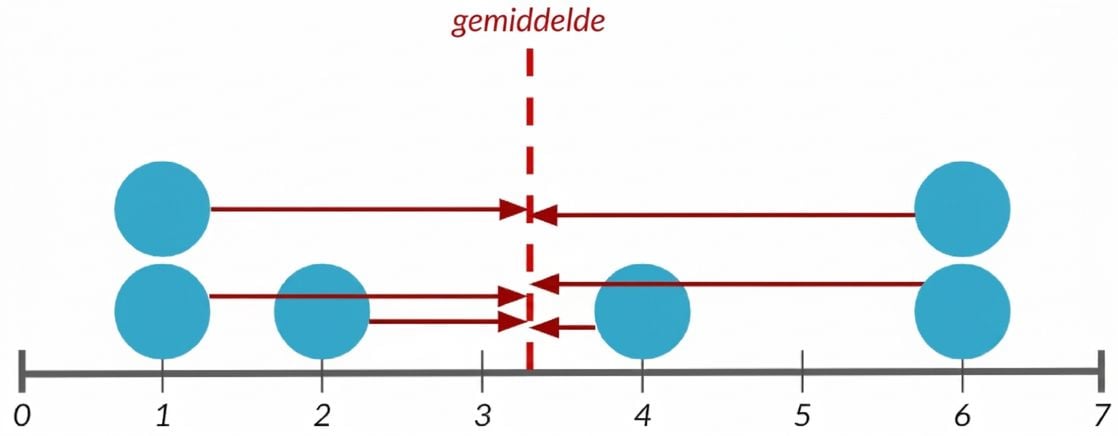
Een dotplot van 7 datapunten met een rode lijn in het midden voor het gemiddelde. Pijlen zijn getekend tussen elk punt en de middelste lijn.

Introductie tot statistiek in Python

Variantie berekenen

1. Trek het gemiddelde af van elk datapunt

dists = msleep['sleep_total'] - 
        np.mean(msleep['sleep_total'])
print(dists)
0     1.666265
1     6.566265
2     3.966265
3     4.466265
4    -6.433735
      ...

2. Kwadrateer elke afstand

sq_dists = dists ** 2
print(sq_dists)
0      2.776439
1     43.115837
2     15.731259
3     19.947524
4     41.392945
      ...
Introductie tot statistiek in Python

Variantie berekenen

3. Sommeer gekwadrateerde afstanden

sum_sq_dists = np.sum(sq_dists)
print(sum_sq_dists)
1624.065542

4. Deel door aantal datapunten - 1

variance = sum_sq_dists / (83 - 1)
print(variance)
19.805677

Gebruik np.var()

np.var(msleep['sleep_total'], ddof=1)
19.805677

Zonder ddof=1 wordt populatievariantie berekend in plaats van steekproefvariantie:

np.var(msleep['sleep_total'])
19.567055
Introductie tot statistiek in Python

Standaarddeviatie

np.sqrt(np.var(msleep['sleep_total'], ddof=1))
4.450357
np.std(msleep['sleep_total'], ddof=1)
4.450357
Introductie tot statistiek in Python

Gemiddelde absolute afwijking

dists = msleep['sleep_total'] - np.mean(msleep['sleep_total'])

np.mean(np.abs(dists))
3.566701

Standaarddeviatie vs. gemiddelde absolute afwijking

  • Standaarddeviatie kwadrateert afstanden en straft grote afstanden zwaarder.
  • Gemiddelde absolute afwijking weegt elke afstand even zwaar.
  • Geen van beide is altijd beter, maar SD is gebruikelijker dan MAD.
Introductie tot statistiek in Python

Kwantielen

np.quantile(msleep['sleep_total'], 0.5)
10.1

$$

                        0.5-kwantiel = mediaan

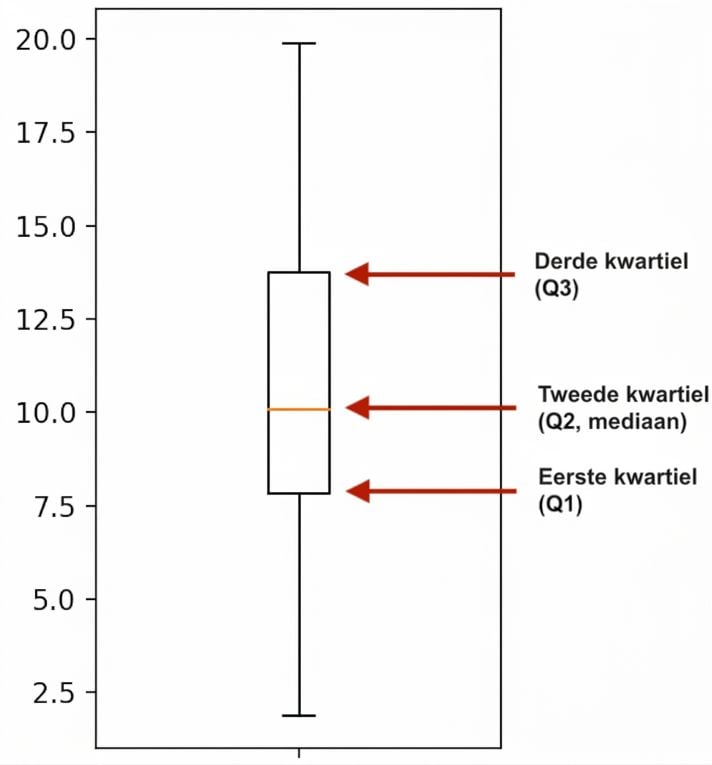
Kwartielen:

np.quantile(msleep['sleep_total'], [0, 0.25, 0.5, 0.75, 1])
array([ 1.9 ,  7.85, 10.1 , 13.75, 19.9 ])
Introductie tot statistiek in Python

Boxplots gebruiken kwartielen

import matplotlib.pyplot as plt
plt.boxplot(msleep['sleep_total'])
plt.show()

sleep_total boxplot.png

Introductie tot statistiek in Python

Kwantielen met np.linspace()

np.quantile(msleep['sleep_total'], [0, 0.2, 0.4, 0.6, 0.8, 1])
array([ 1.9 ,  6.24,  9.48, 11.14, 14.4 , 19.9 ])


np.linspace(start, stop, num)

np.quantile(msleep['sleep_total'], np.linspace(0, 1, 5))
array([ 1.9 ,  7.85, 10.1 , 13.75, 19.9 ])
Introductie tot statistiek in Python

Interkwartielafstand (IQR)

Hoogte van de box in een boxplot

np.quantile(msleep['sleep_total'], 0.75) - np.quantile(msleep['sleep_total'], 0.25)
5.9
from scipy.stats import iqr
iqr(msleep['sleep_total'])
5.9
Introductie tot statistiek in Python

Uitschieters

Uitschieter: datapunt dat aanzienlijk afwijkt van de rest

Hoe weet je wat aanzienlijk is? Een datapunt is een uitschieter als:

  • $\text{data} < \text{Q1} - 1.5\times\text{IQR}$    of
  • $\text{data} > \text{Q3} + 1.5\times\text{IQR}$
Introductie tot statistiek in Python

Uitschieters vinden

from scipy.stats import iqr
iqr = iqr(msleep['bodywt'])

lower_threshold = np.quantile(msleep['bodywt'], 0.25) - 1.5 * iqr upper_threshold = np.quantile(msleep['bodywt'], 0.75) + 1.5 * iqr
msleep[(msleep['bodywt'] < lower_threshold) | (msleep['bodywt'] > upper_threshold)]
                    name   vore  sleep_total    bodywt
4                    Cow  herbi          4.0   600.000
20        Asian elephant  herbi          3.9  2547.000
22                 Horse  herbi          2.9   521.000
...
Introductie tot statistiek in Python

Alles in één keer

msleep['bodywt'].describe()
count      83.000000
mean      166.136349
std       786.839732
min         0.005000
25%         0.174000
50%         1.670000
75%        41.750000
max      6654.000000
Name: bodywt, dtype: float64
Introductie tot statistiek in Python

Laten we oefenen!

Introductie tot statistiek in Python

Preparing Video For Download...