Overwegingen voor categorische data
Exploratory Data Analysis in Python

George Boorman
Curriculum Manager, DataCamp
Waarom EDA doen?

1 Image credit: https://unsplash.com/@simonesecci
Representatieve data


1 Image credits: https://unsplash.com/@cristina_glebova; https://unsplash.com/@nimbus_vulpis
Klassen-ongelijkheid

Kruistabel

pd.crosstab(
Index kiezen
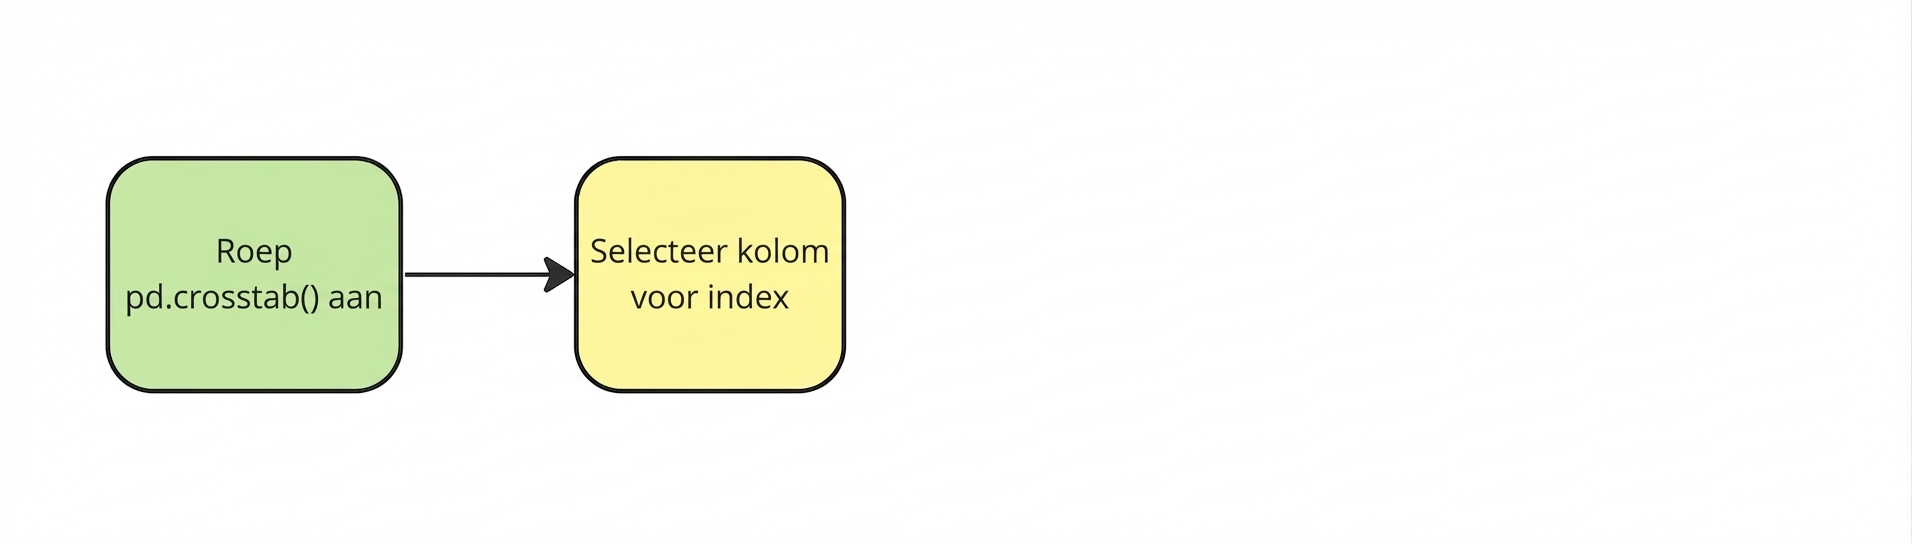
pd.crosstab(planes["Source"],
Kolommen kiezen
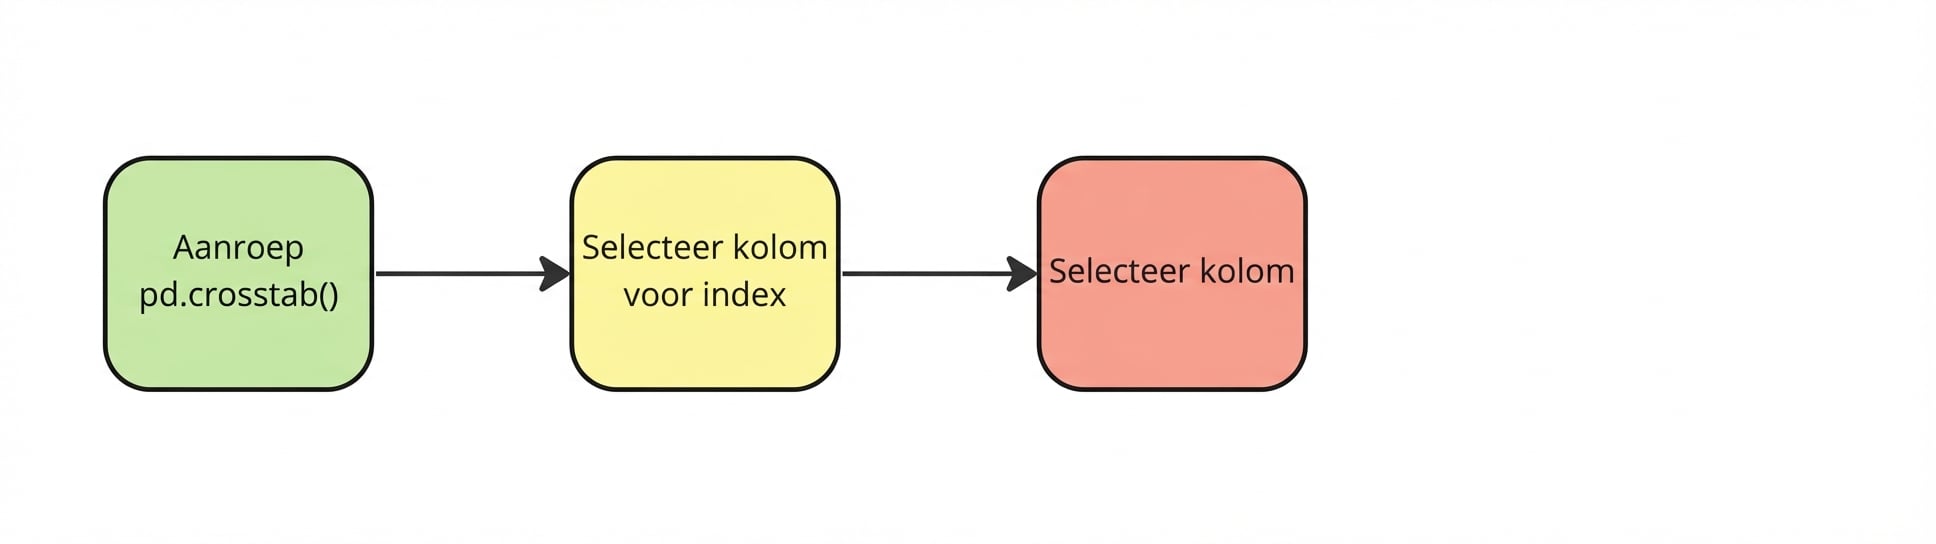
pd.crosstab(planes["Source"], planes["Destination"])

