Flexibiliteit van thema’s
Introductie tot datavisualisatie met ggplot2

Rick Scavetta
Founder, Scavetta Academy
Thema-objecten definiëren
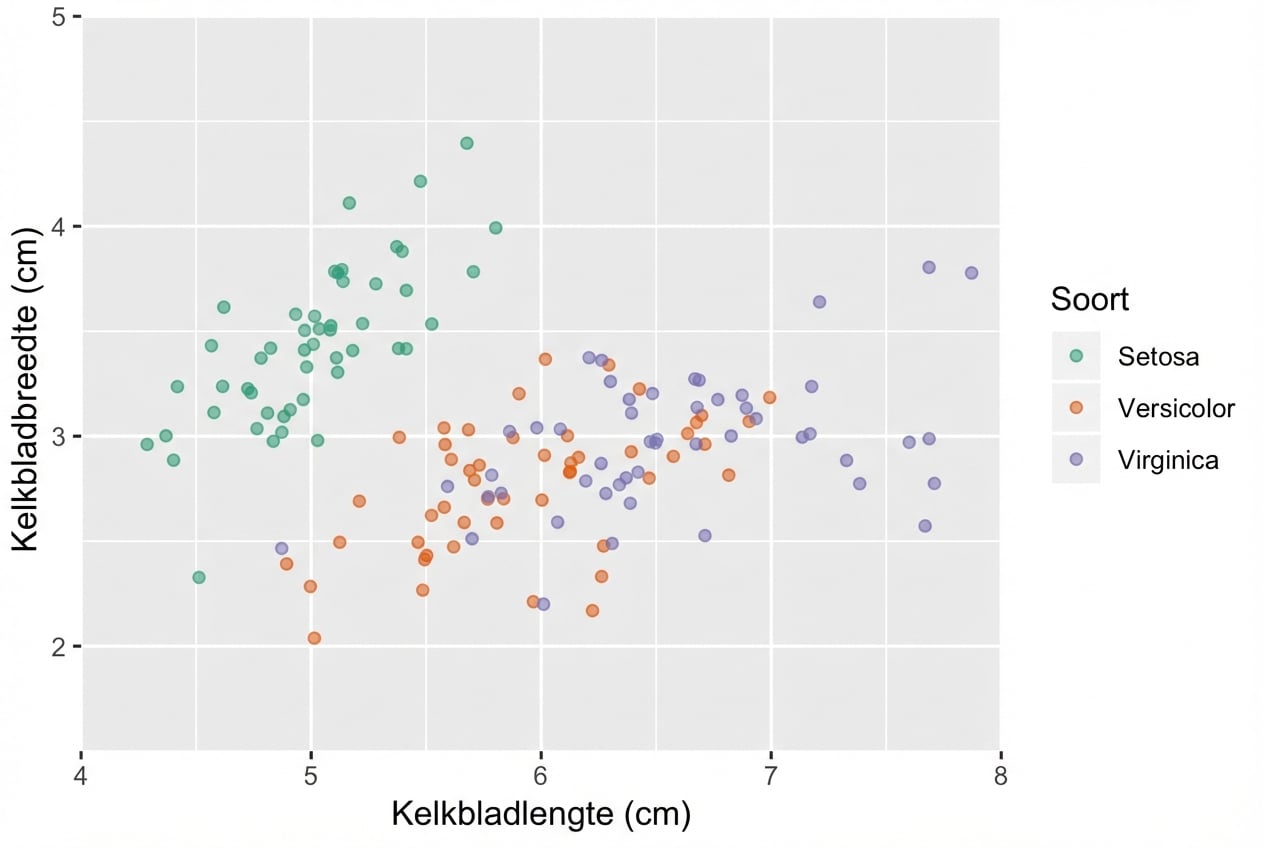
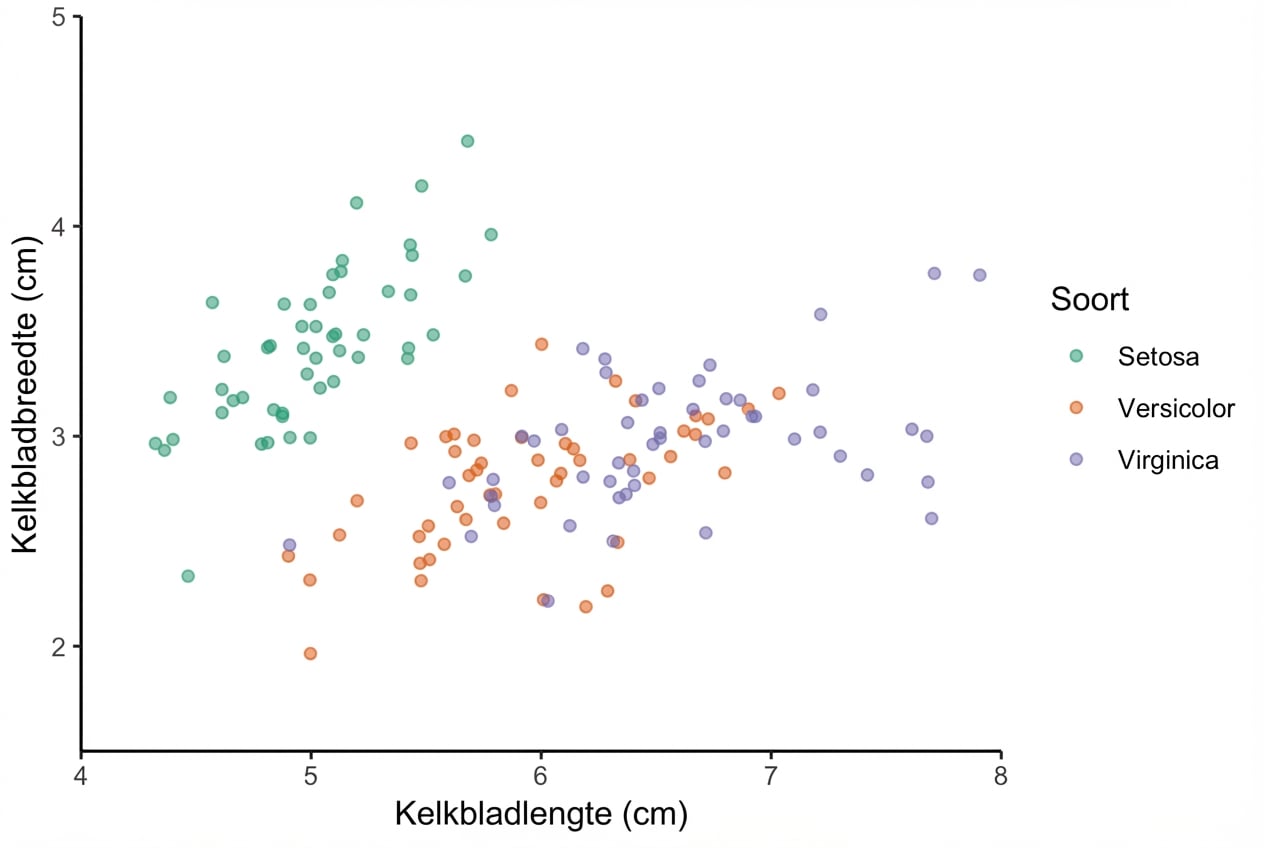
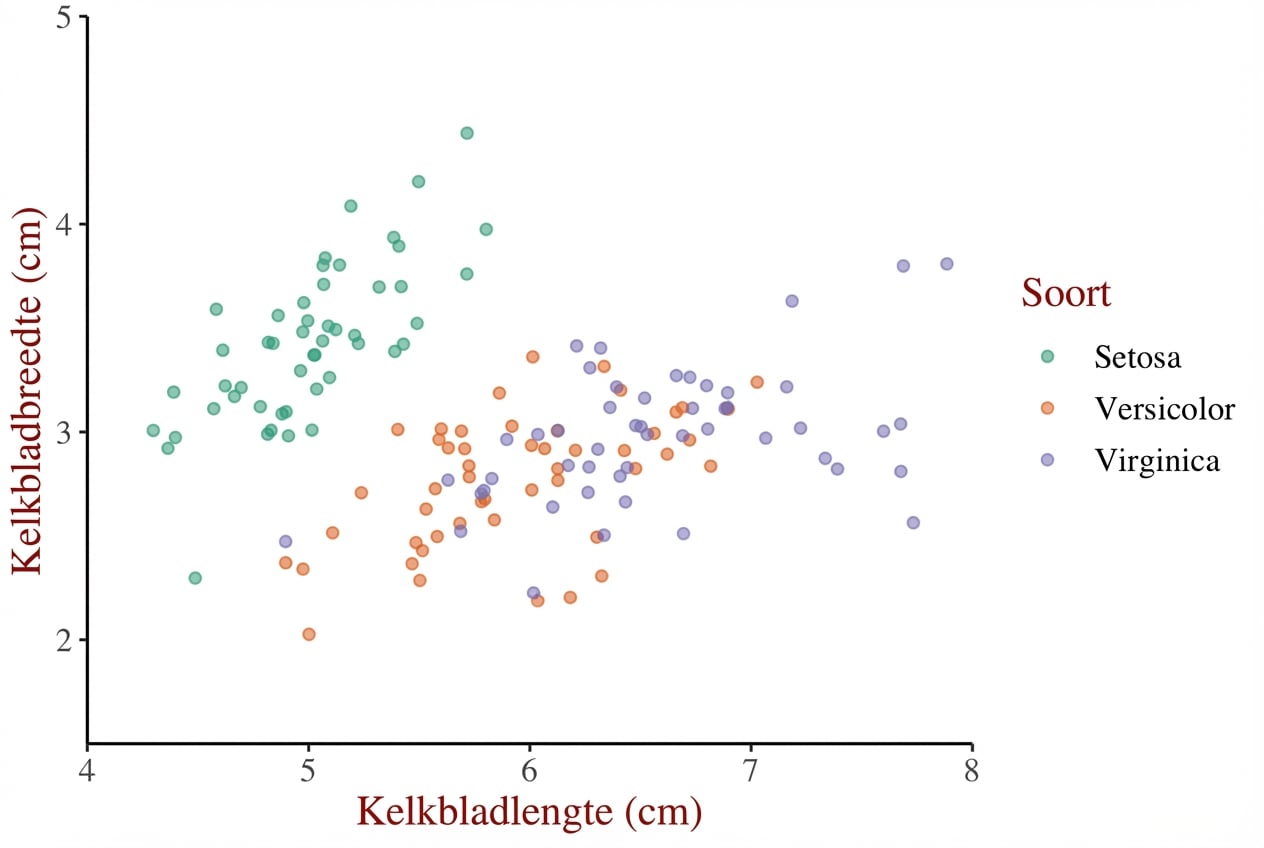
z <- ggplot(iris, aes(x = Sepal.Length, y = Sepal.Width, color = Species)) +
  geom_jitter(alpha = 0.6) +
  scale_x_continuous("Sepal Length (cm)", limits = c(4,8), expand = c(0,0)) +
  scale_y_continuous("Sepal Width (cm)", limits = c(1.5,5), expand = c(0,0)) +
  scale_color_brewer("Species", palette = "Dark2", labels = c("Setosa", "Versicolor", "Virginica"))
Thema-objecten definiëren
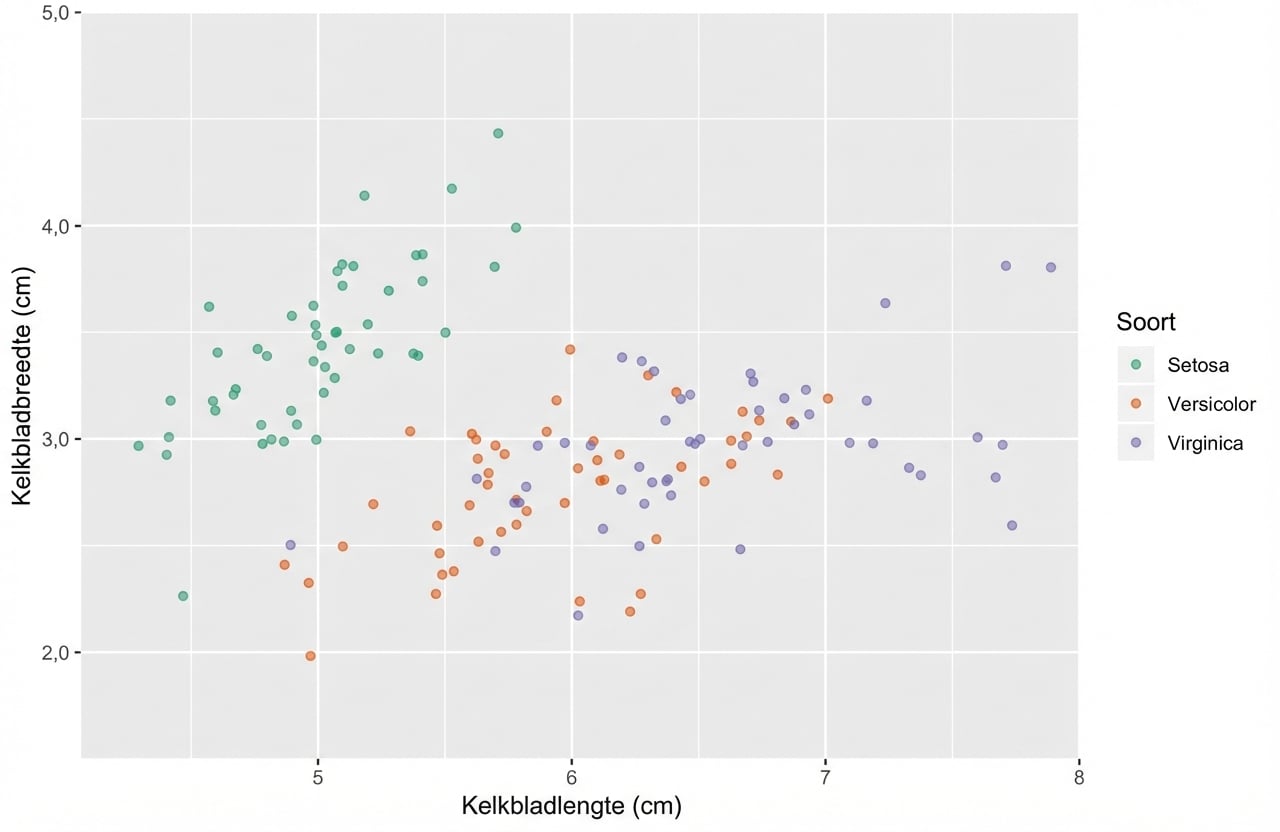
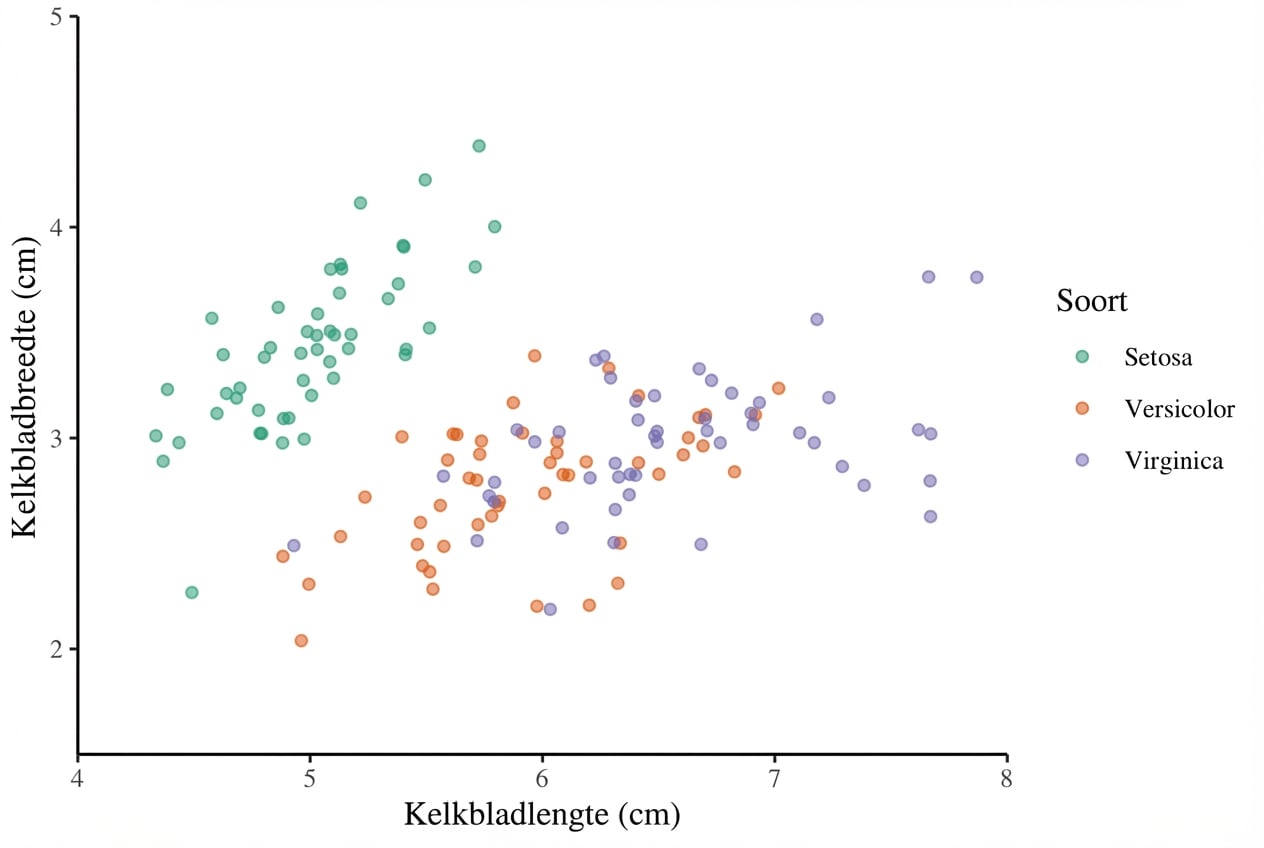
z + theme(text = element_text(family = "serif", size = 14),
          rect = element_blank(),
          panel.grid = element_blank(),
          title = element_text(color = "#8b0000"),
          axis.line = element_line(color = "black"))
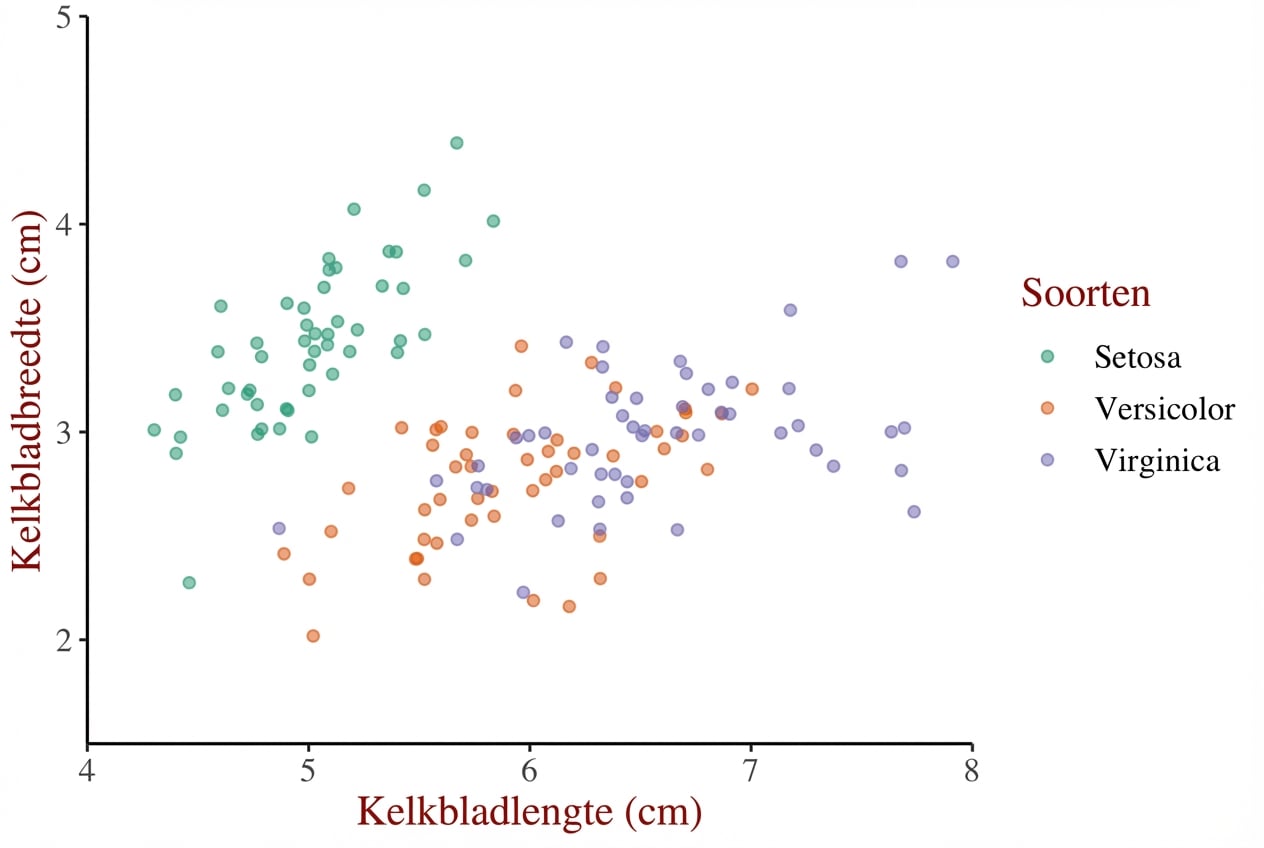
Thema-objecten hergebruiken
z + theme_iris

Thema-objecten hergebruiken
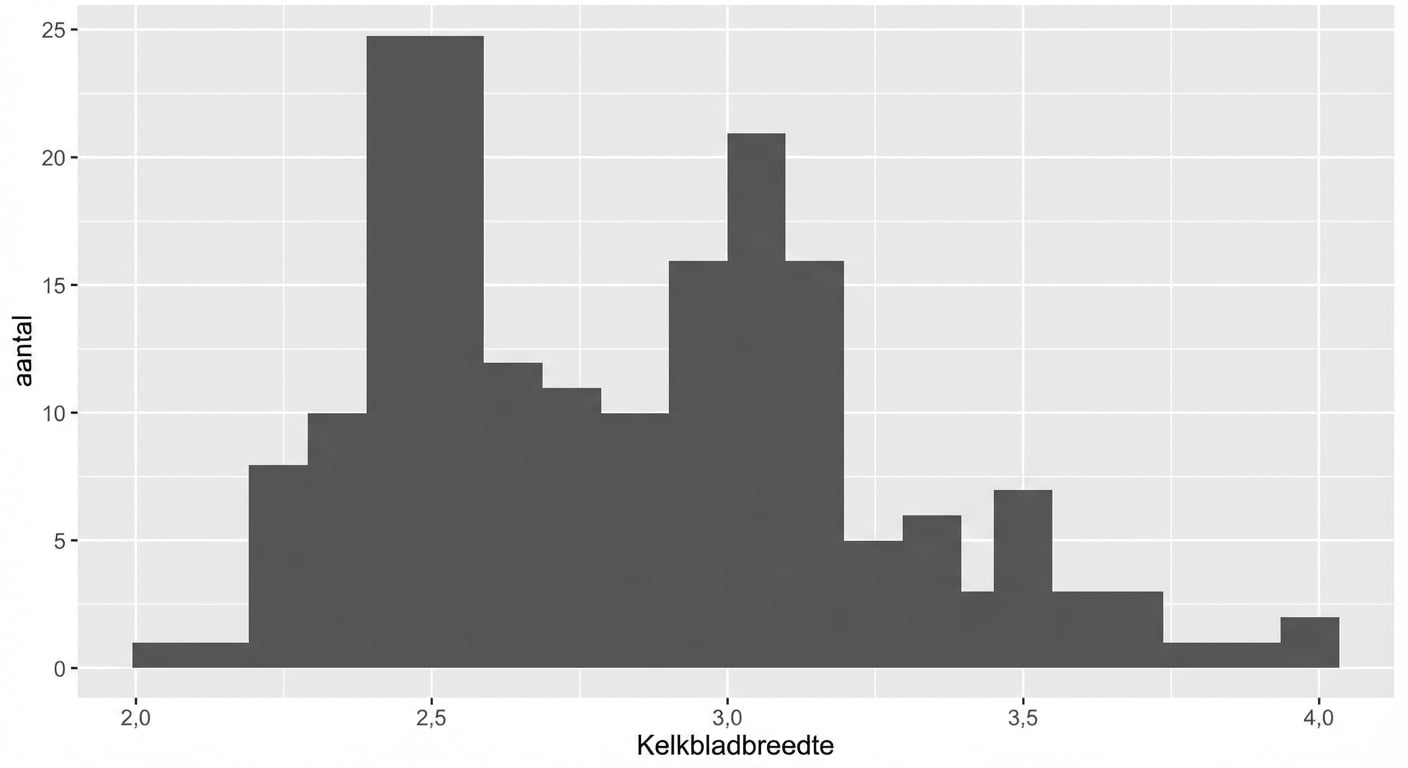
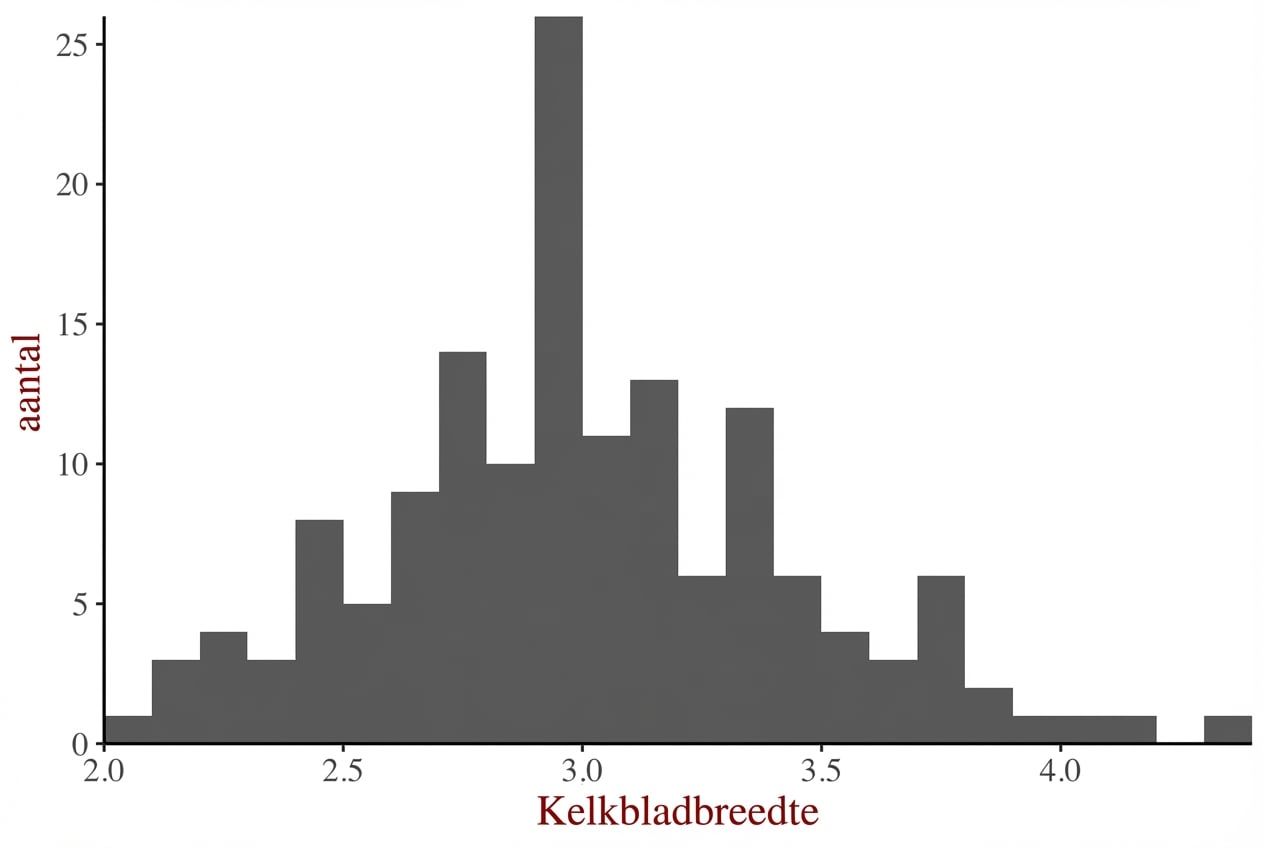
m <- ggplot(iris, aes(x = Sepal.Width)) +
    geom_histogram(binwidth = 0.1,
                   center = 0.05)
m
Thema-objecten hergebruiken
m +
  theme_iris
Thema-objecten hergebruiken
m +
  theme_iris +
  theme(axis.line.x = element_blank())

Ingebouwde thema’s gebruiken
Gebruik theme_*()-functies voor ingebouwde thema’s.
z +
  theme_classic()
Ingebouwde thema’s gebruiken
Gebruik theme_*()-functies voor ingebouwde thema’s.
z +
  theme_classic() +
  theme(text = element_text(family = "serif"))
Het ggthemes-pakket
Gebruik het ggthemes-pakket voor meer functies.
library(ggthemes)
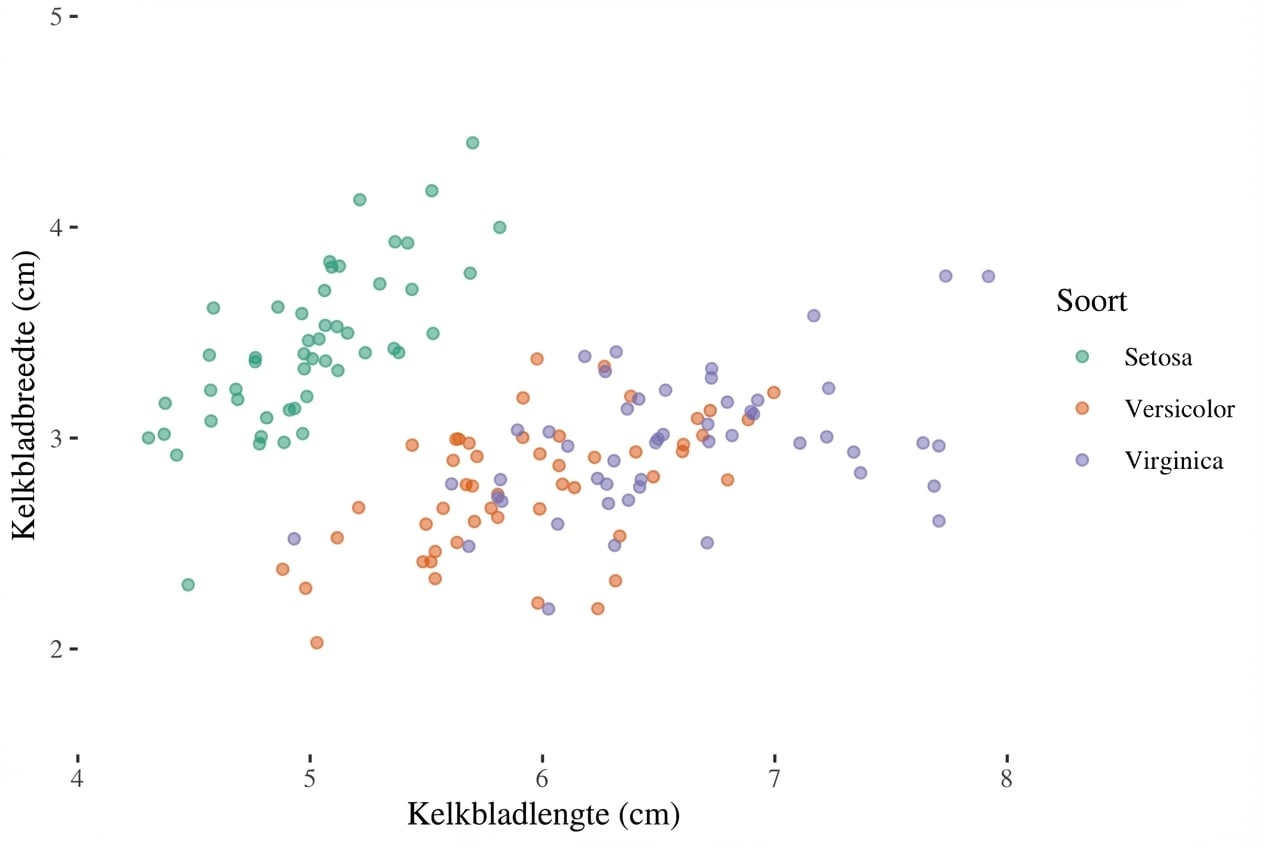
z +
theme_tufte()
Thema’s bijwerken
z
Thema’s instellen
theme_set(original)

# Alternatively
# theme_set(theme_grey())